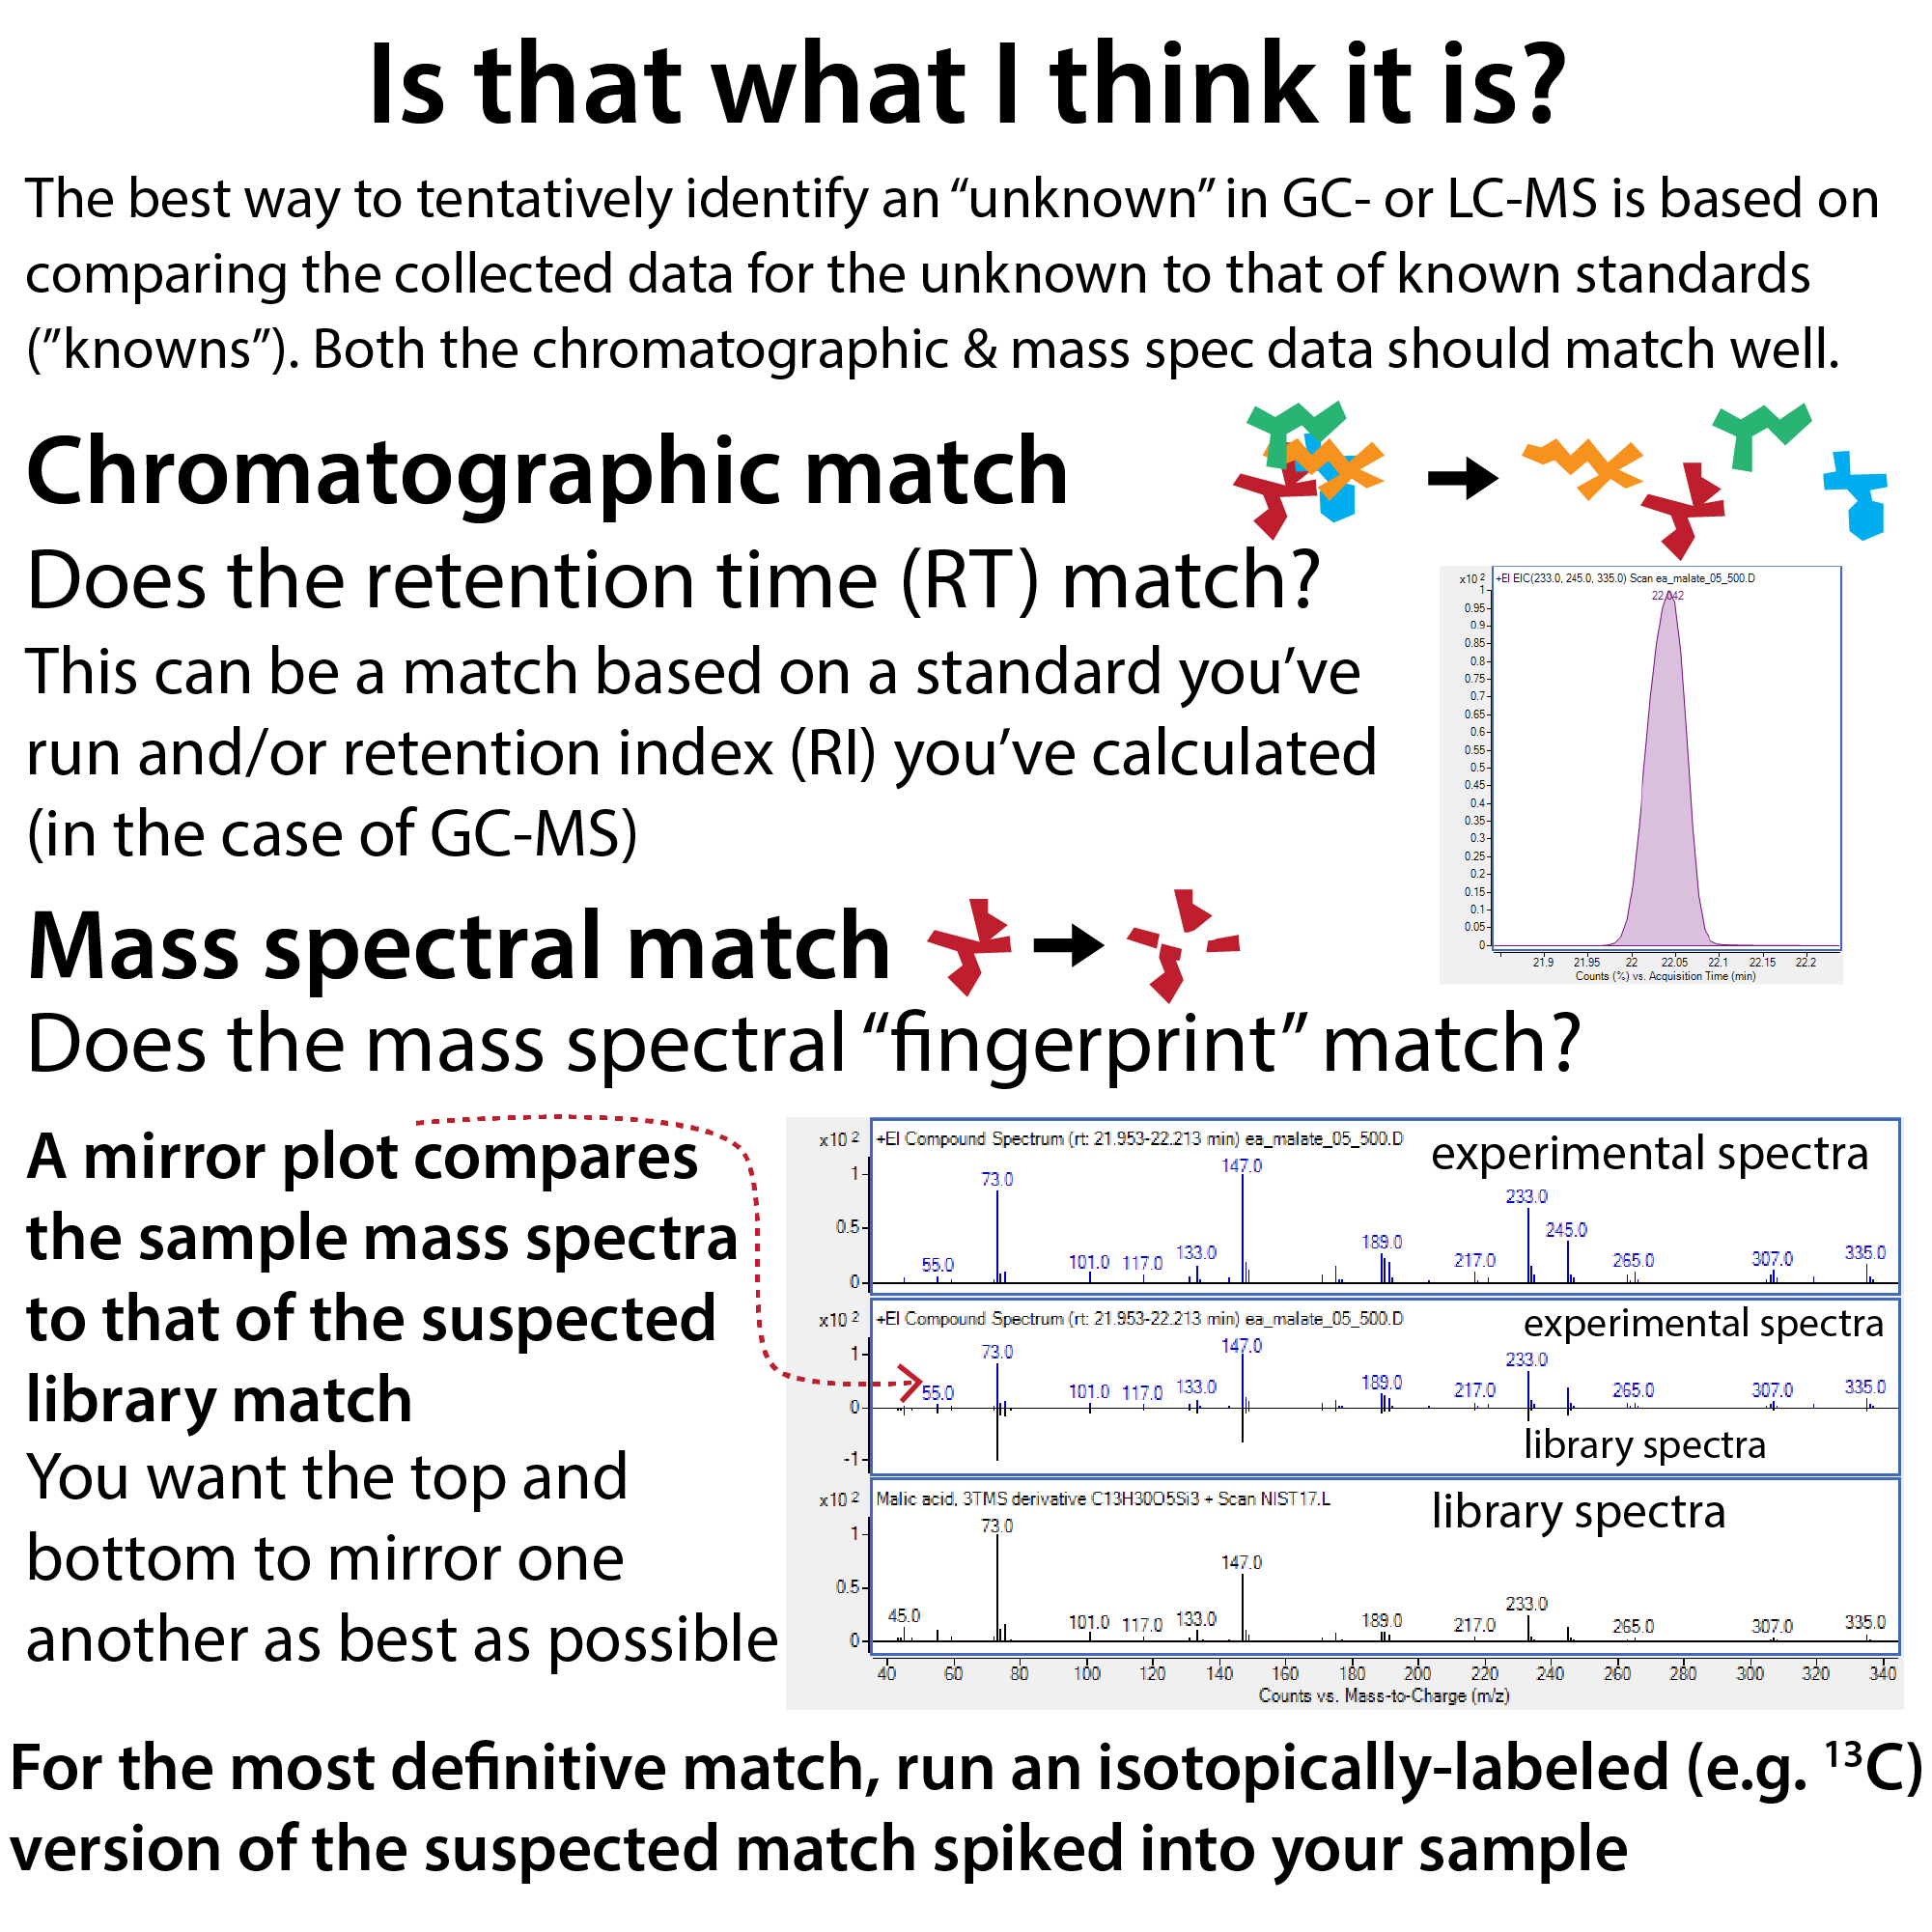
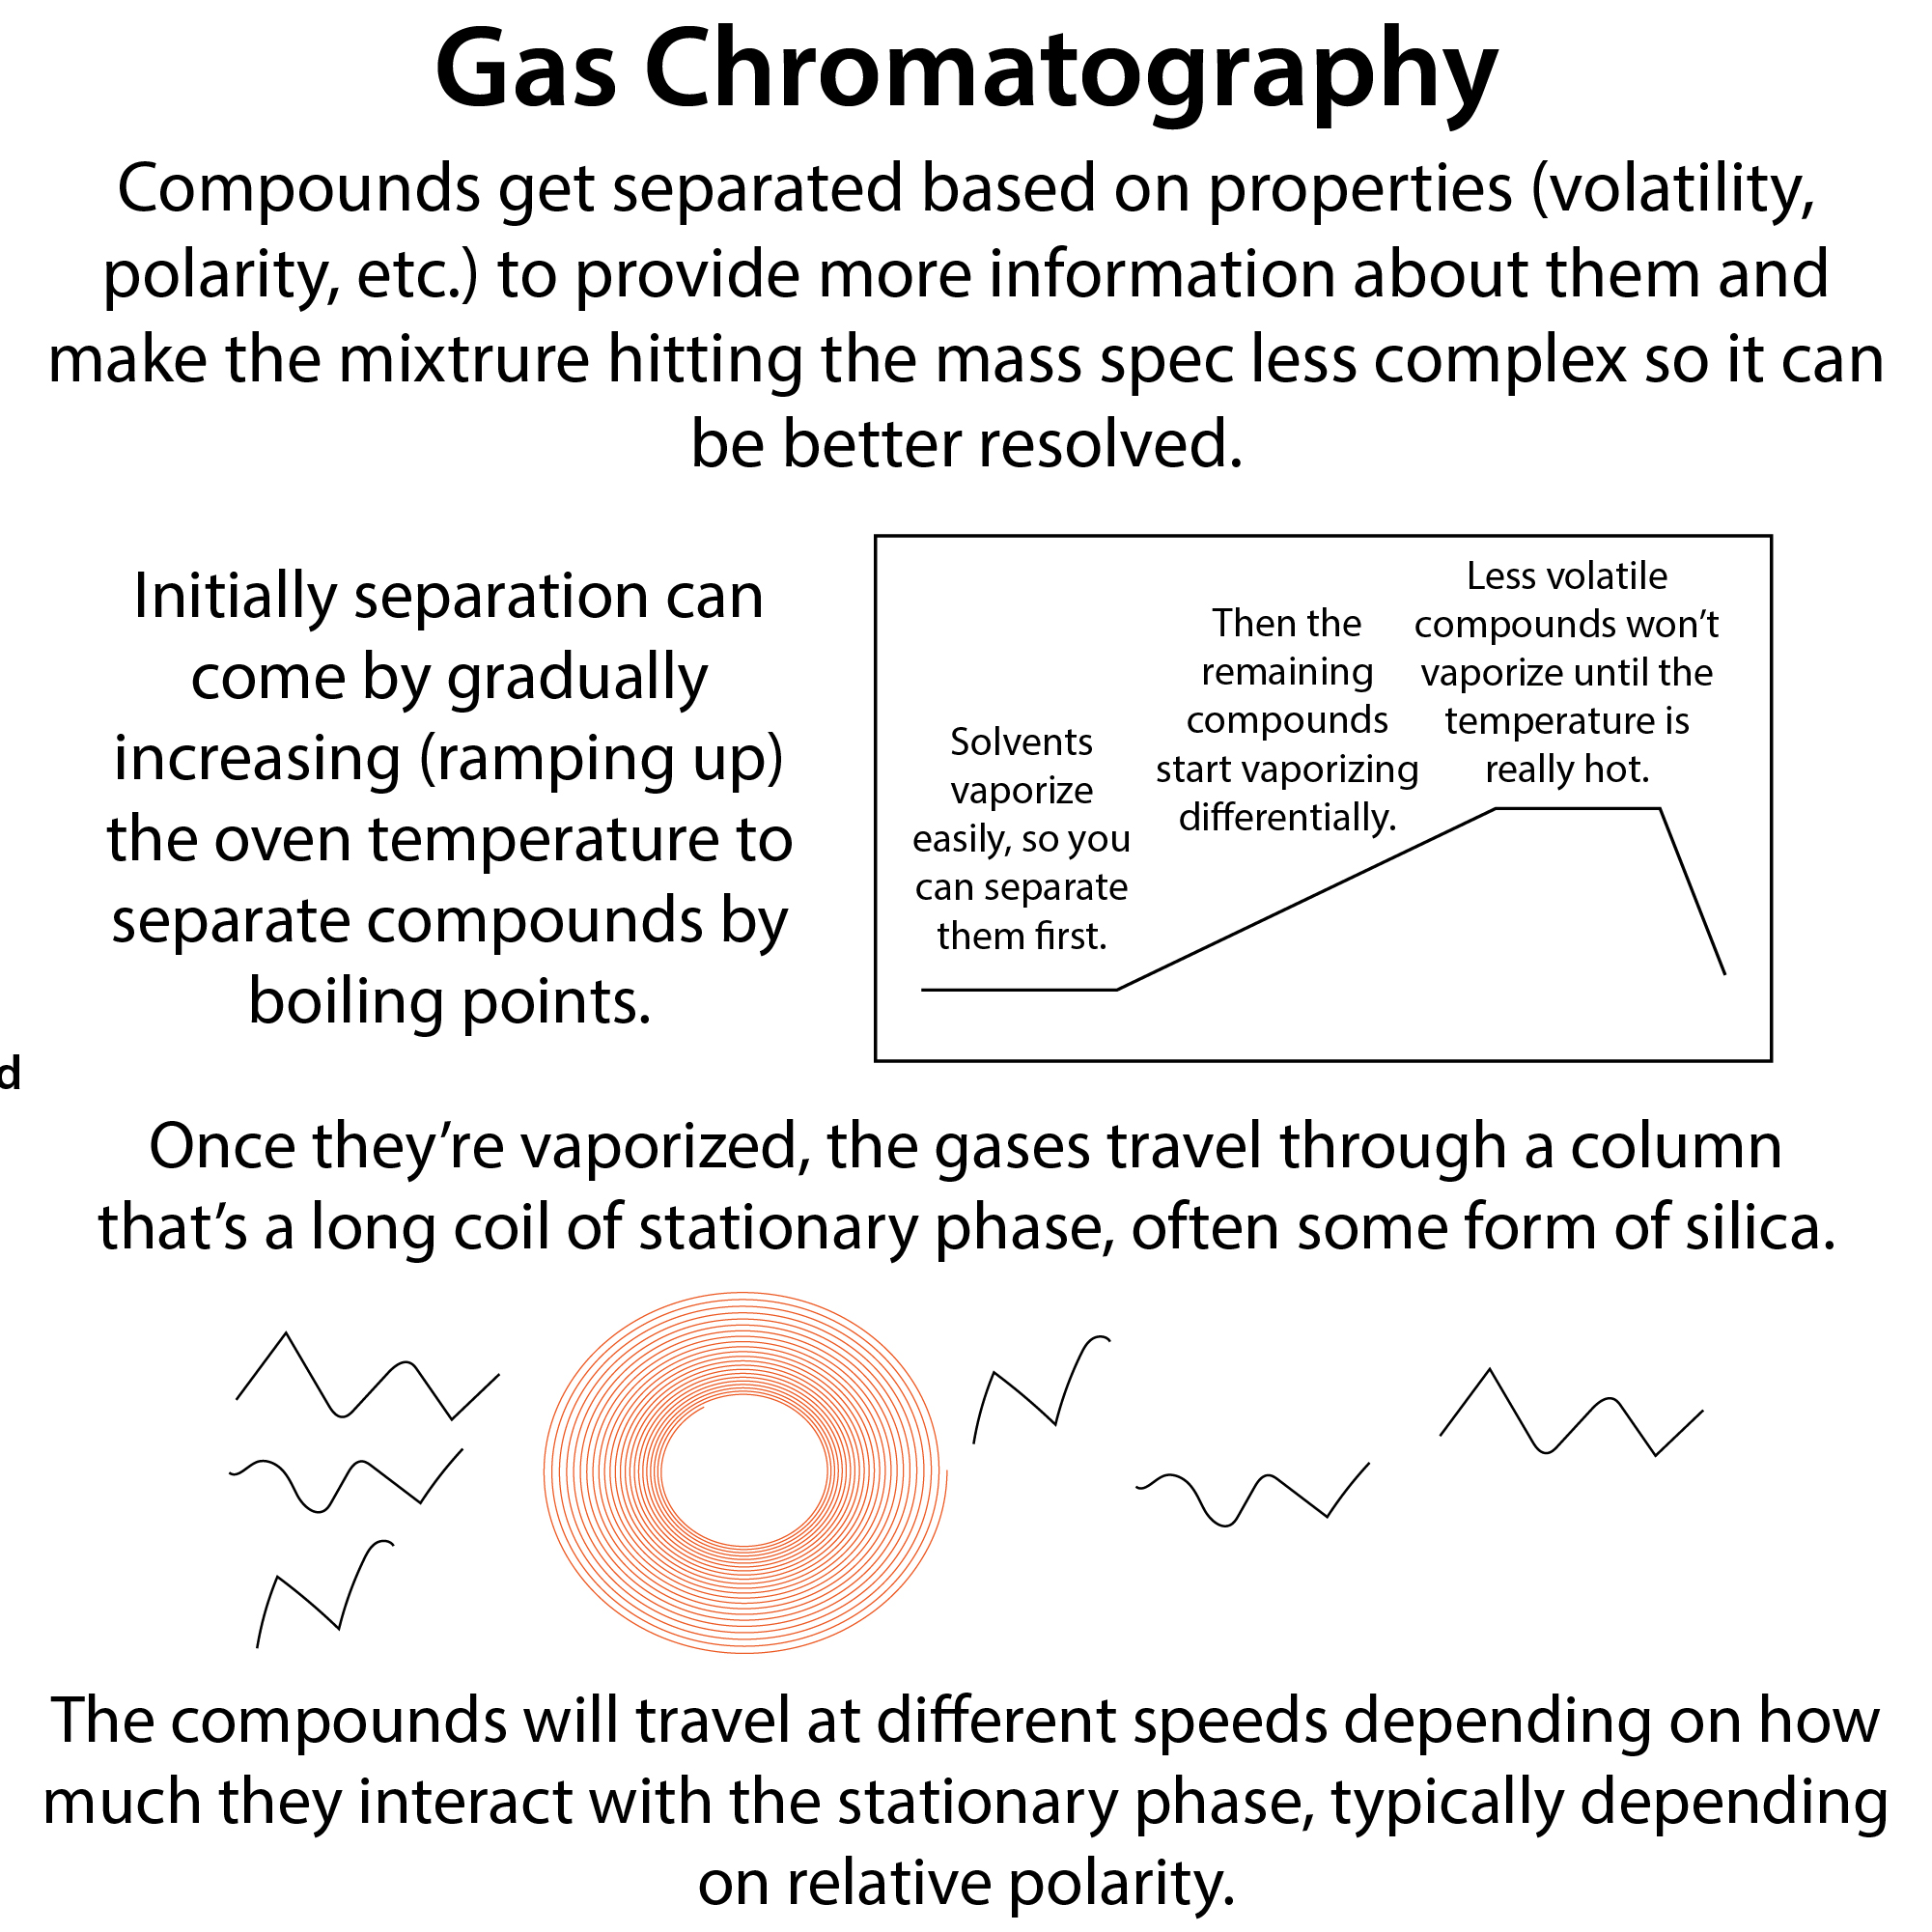
Chromatography-paired mass spectrometry typically uses mass spectrometry (MS), coupled to liquid chromatography (LC) or gas chromatography (GC) to aid in separation prior to measuring the mass/charge (m/z) ratios of the molecules and/or their fragments to ID them. The best way to tentatively identify an “unknown” in GC- or LC-MS is based on comparing the collected data for the unknown to that of known standards (”knowns”). Both the chromatographic & mass spec data should match well.
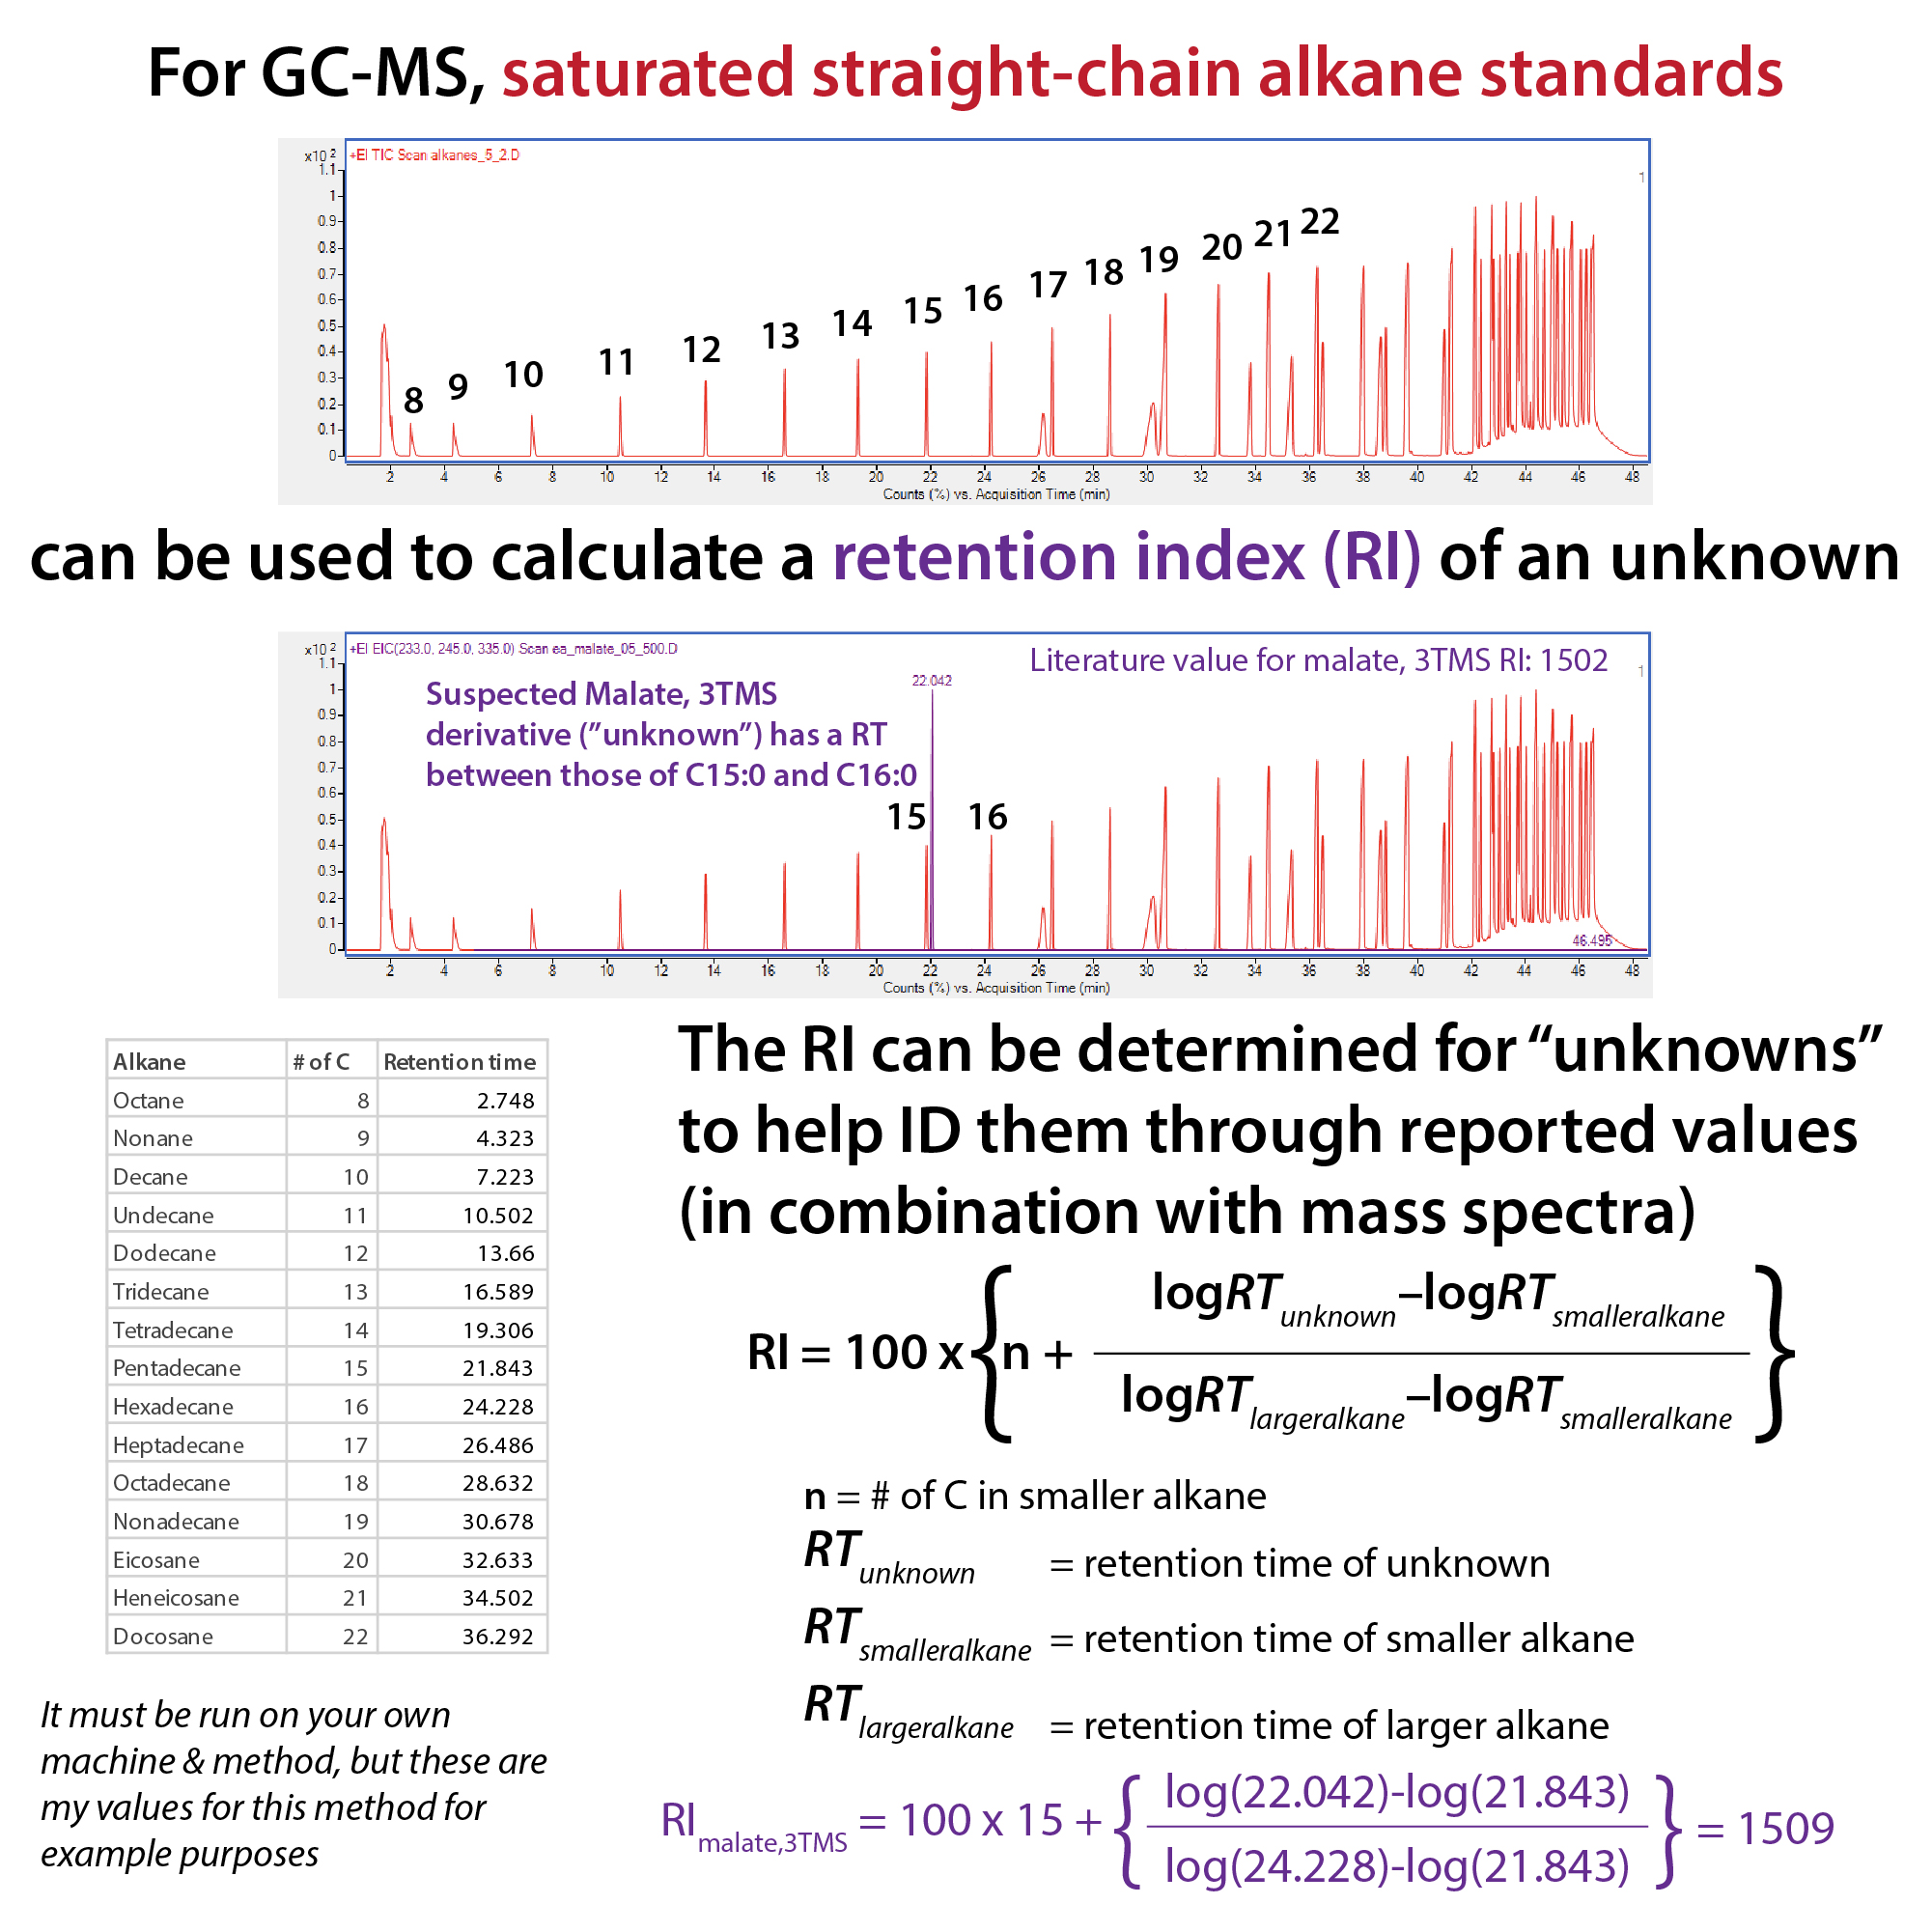
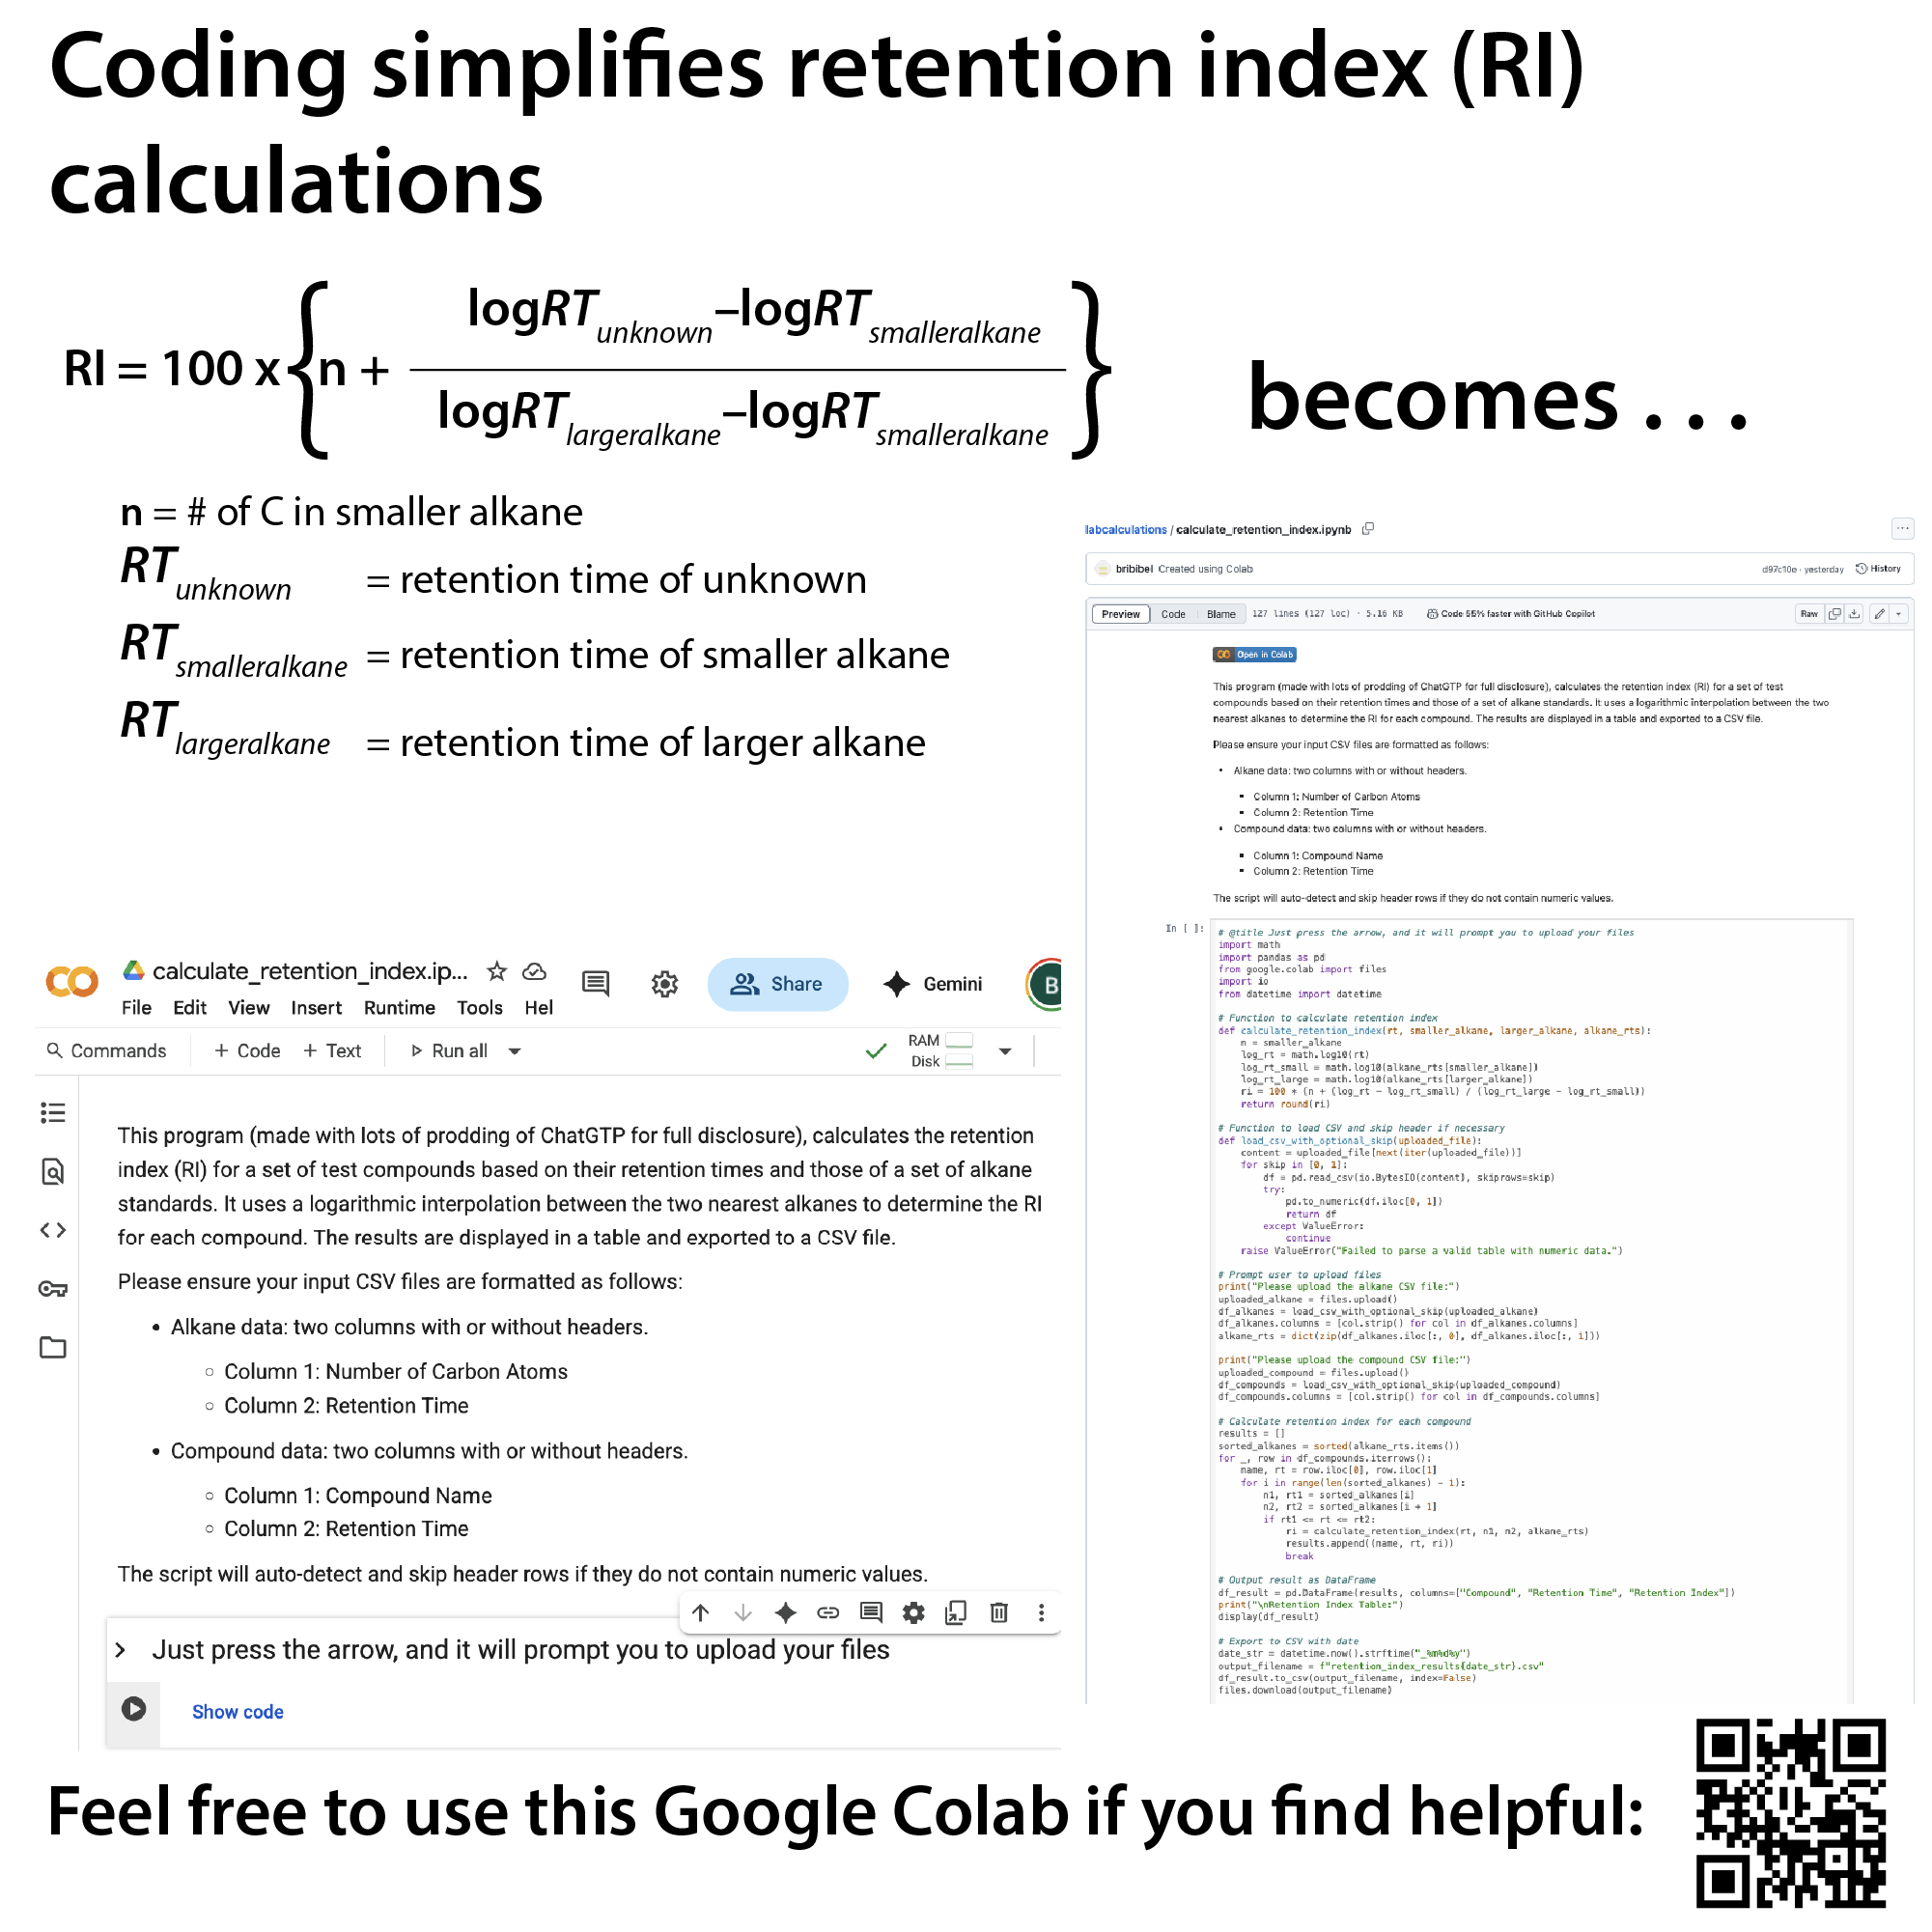
Chromatographic match: Does the retention time (RT) match? (Retention time (RT) is the time it takes a compound to elute (go through the chromatography column) and thus have its ions show up at the detector. This can be a match based on a standard you’ve run and/or retention index (RI) you’ve calculated (in the case of GC-MS).
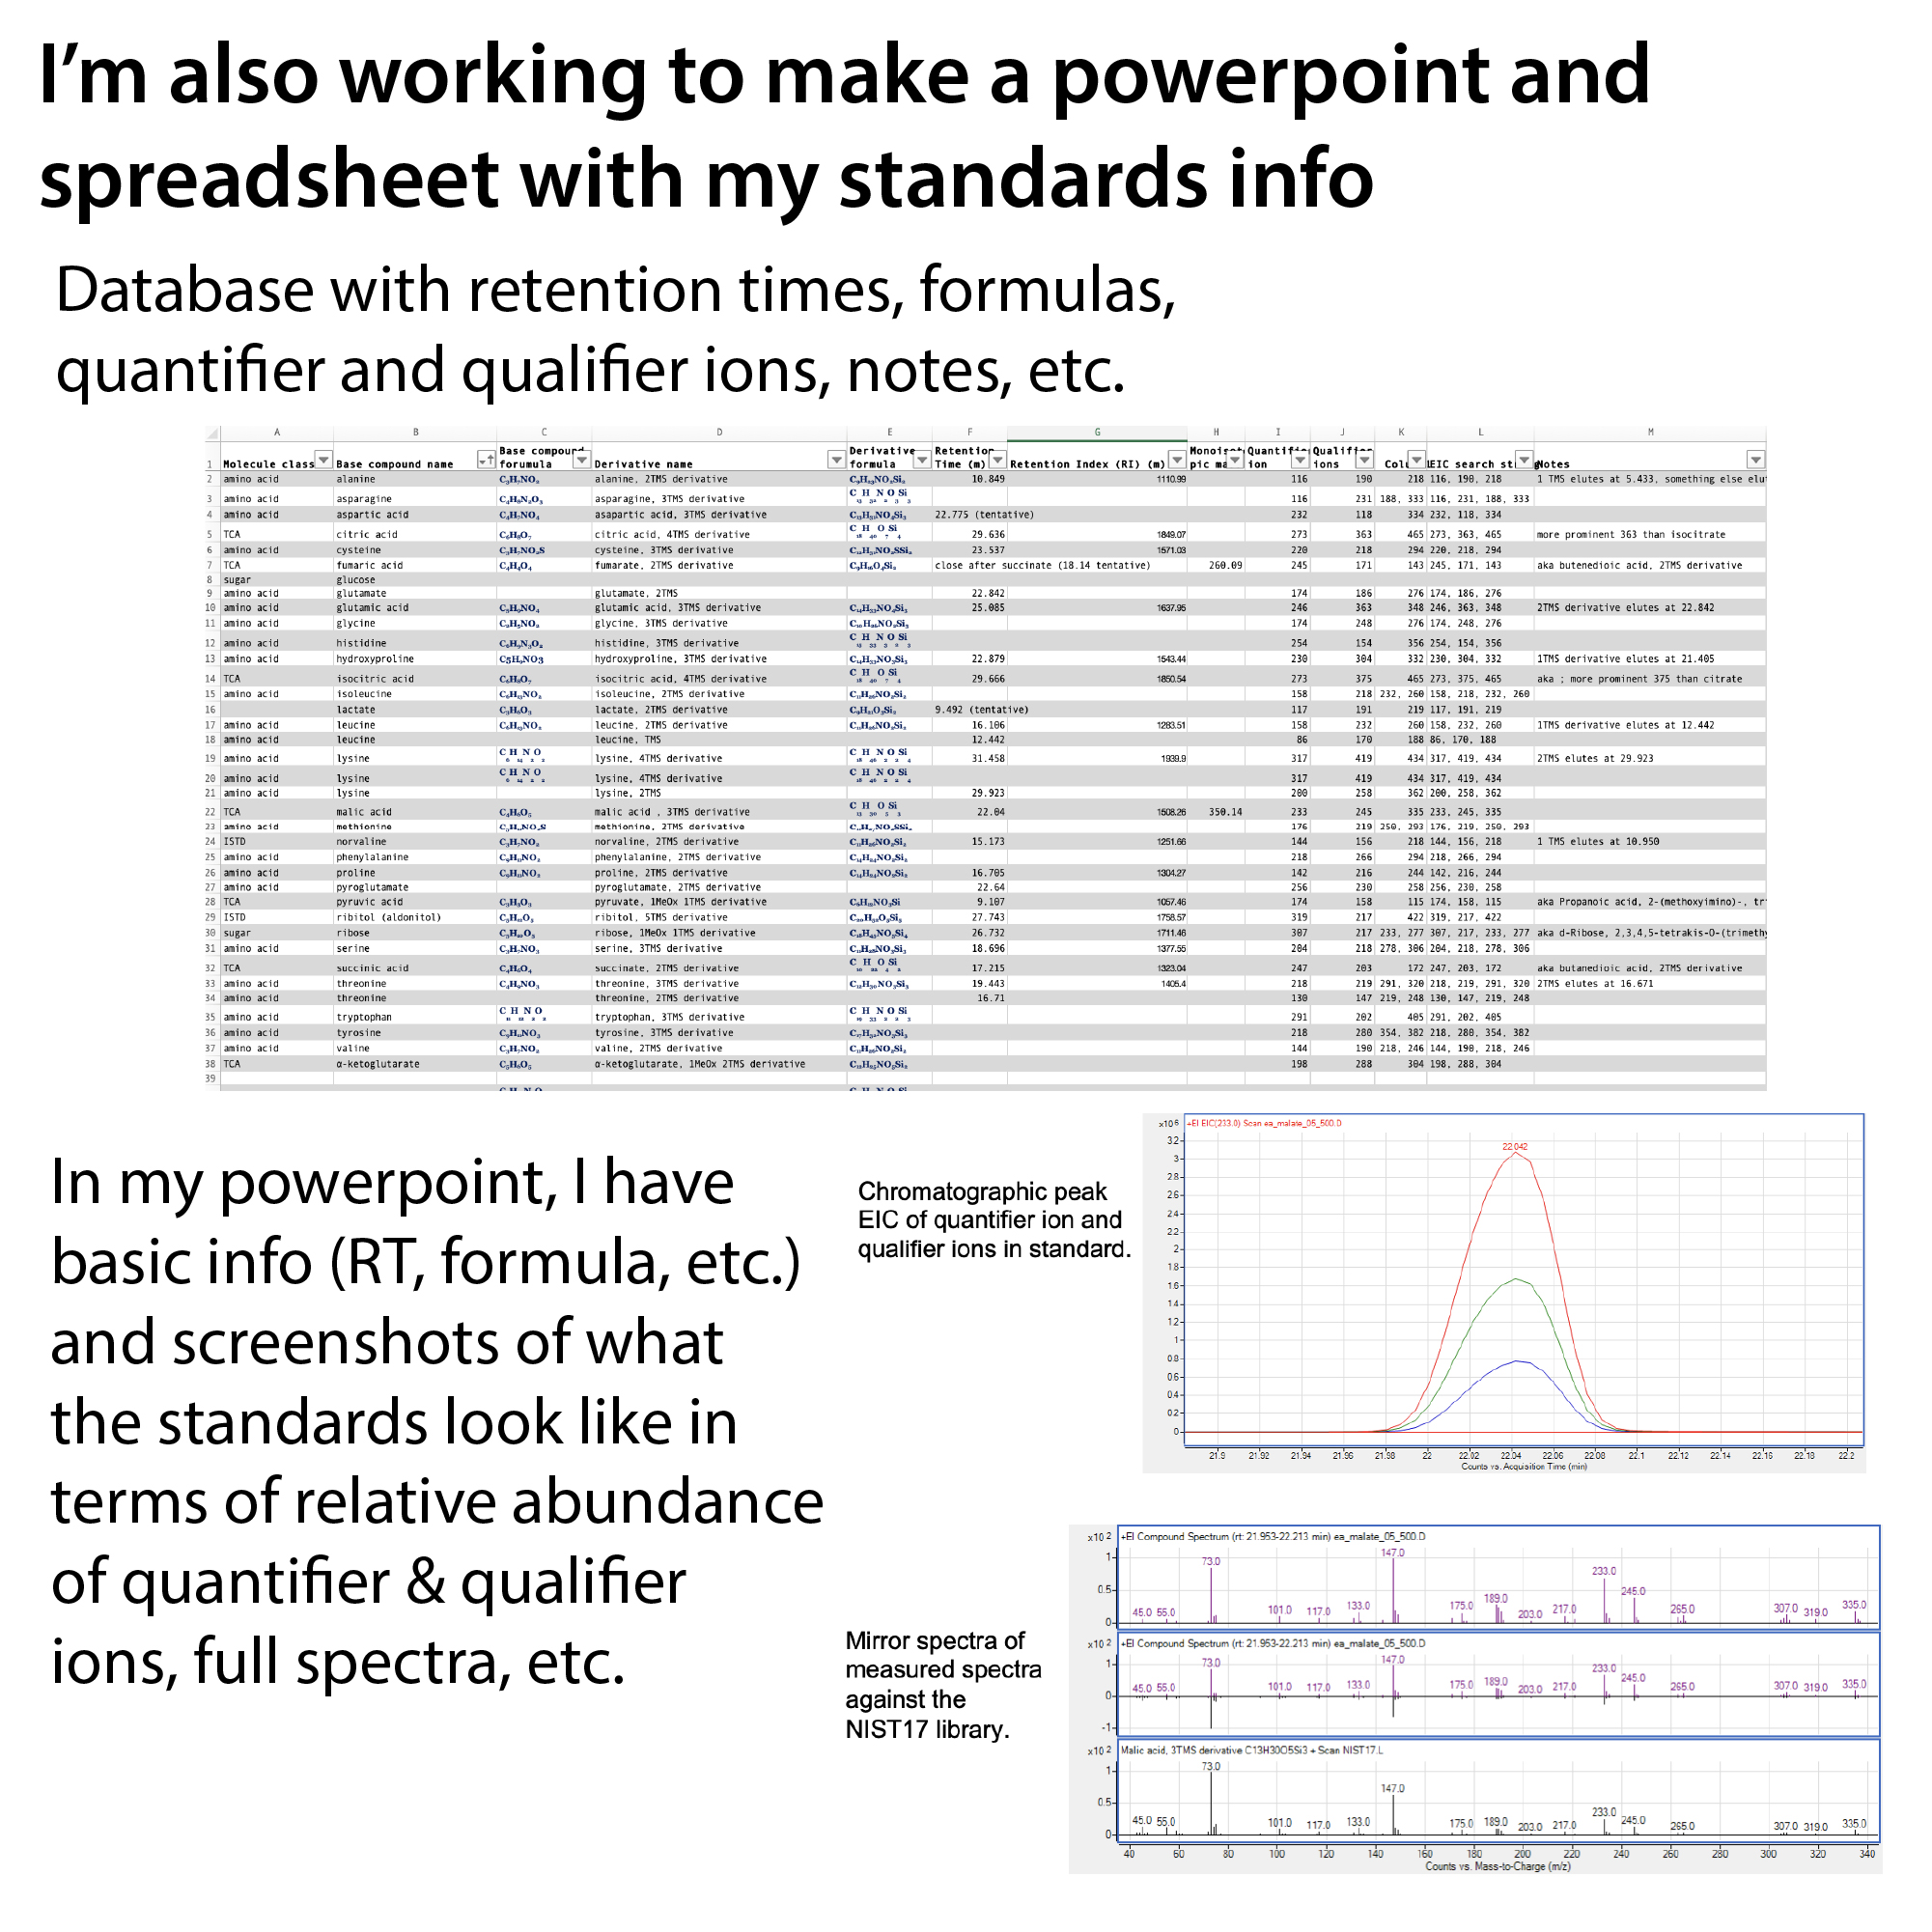
Mass spectral match: Does the mass spectral “fingerprint” match? A mirror plot compares the sample mass spectra to that of the suspected library match. You want the top and bottom to mirror one another as best as possible
For the most definitive match, run an isotopically-labeled (e.g. 13C) version of the suspected match spiked into your sample
When you’re looking at data, and looking to ID things, you’ll see a few types of graphs:
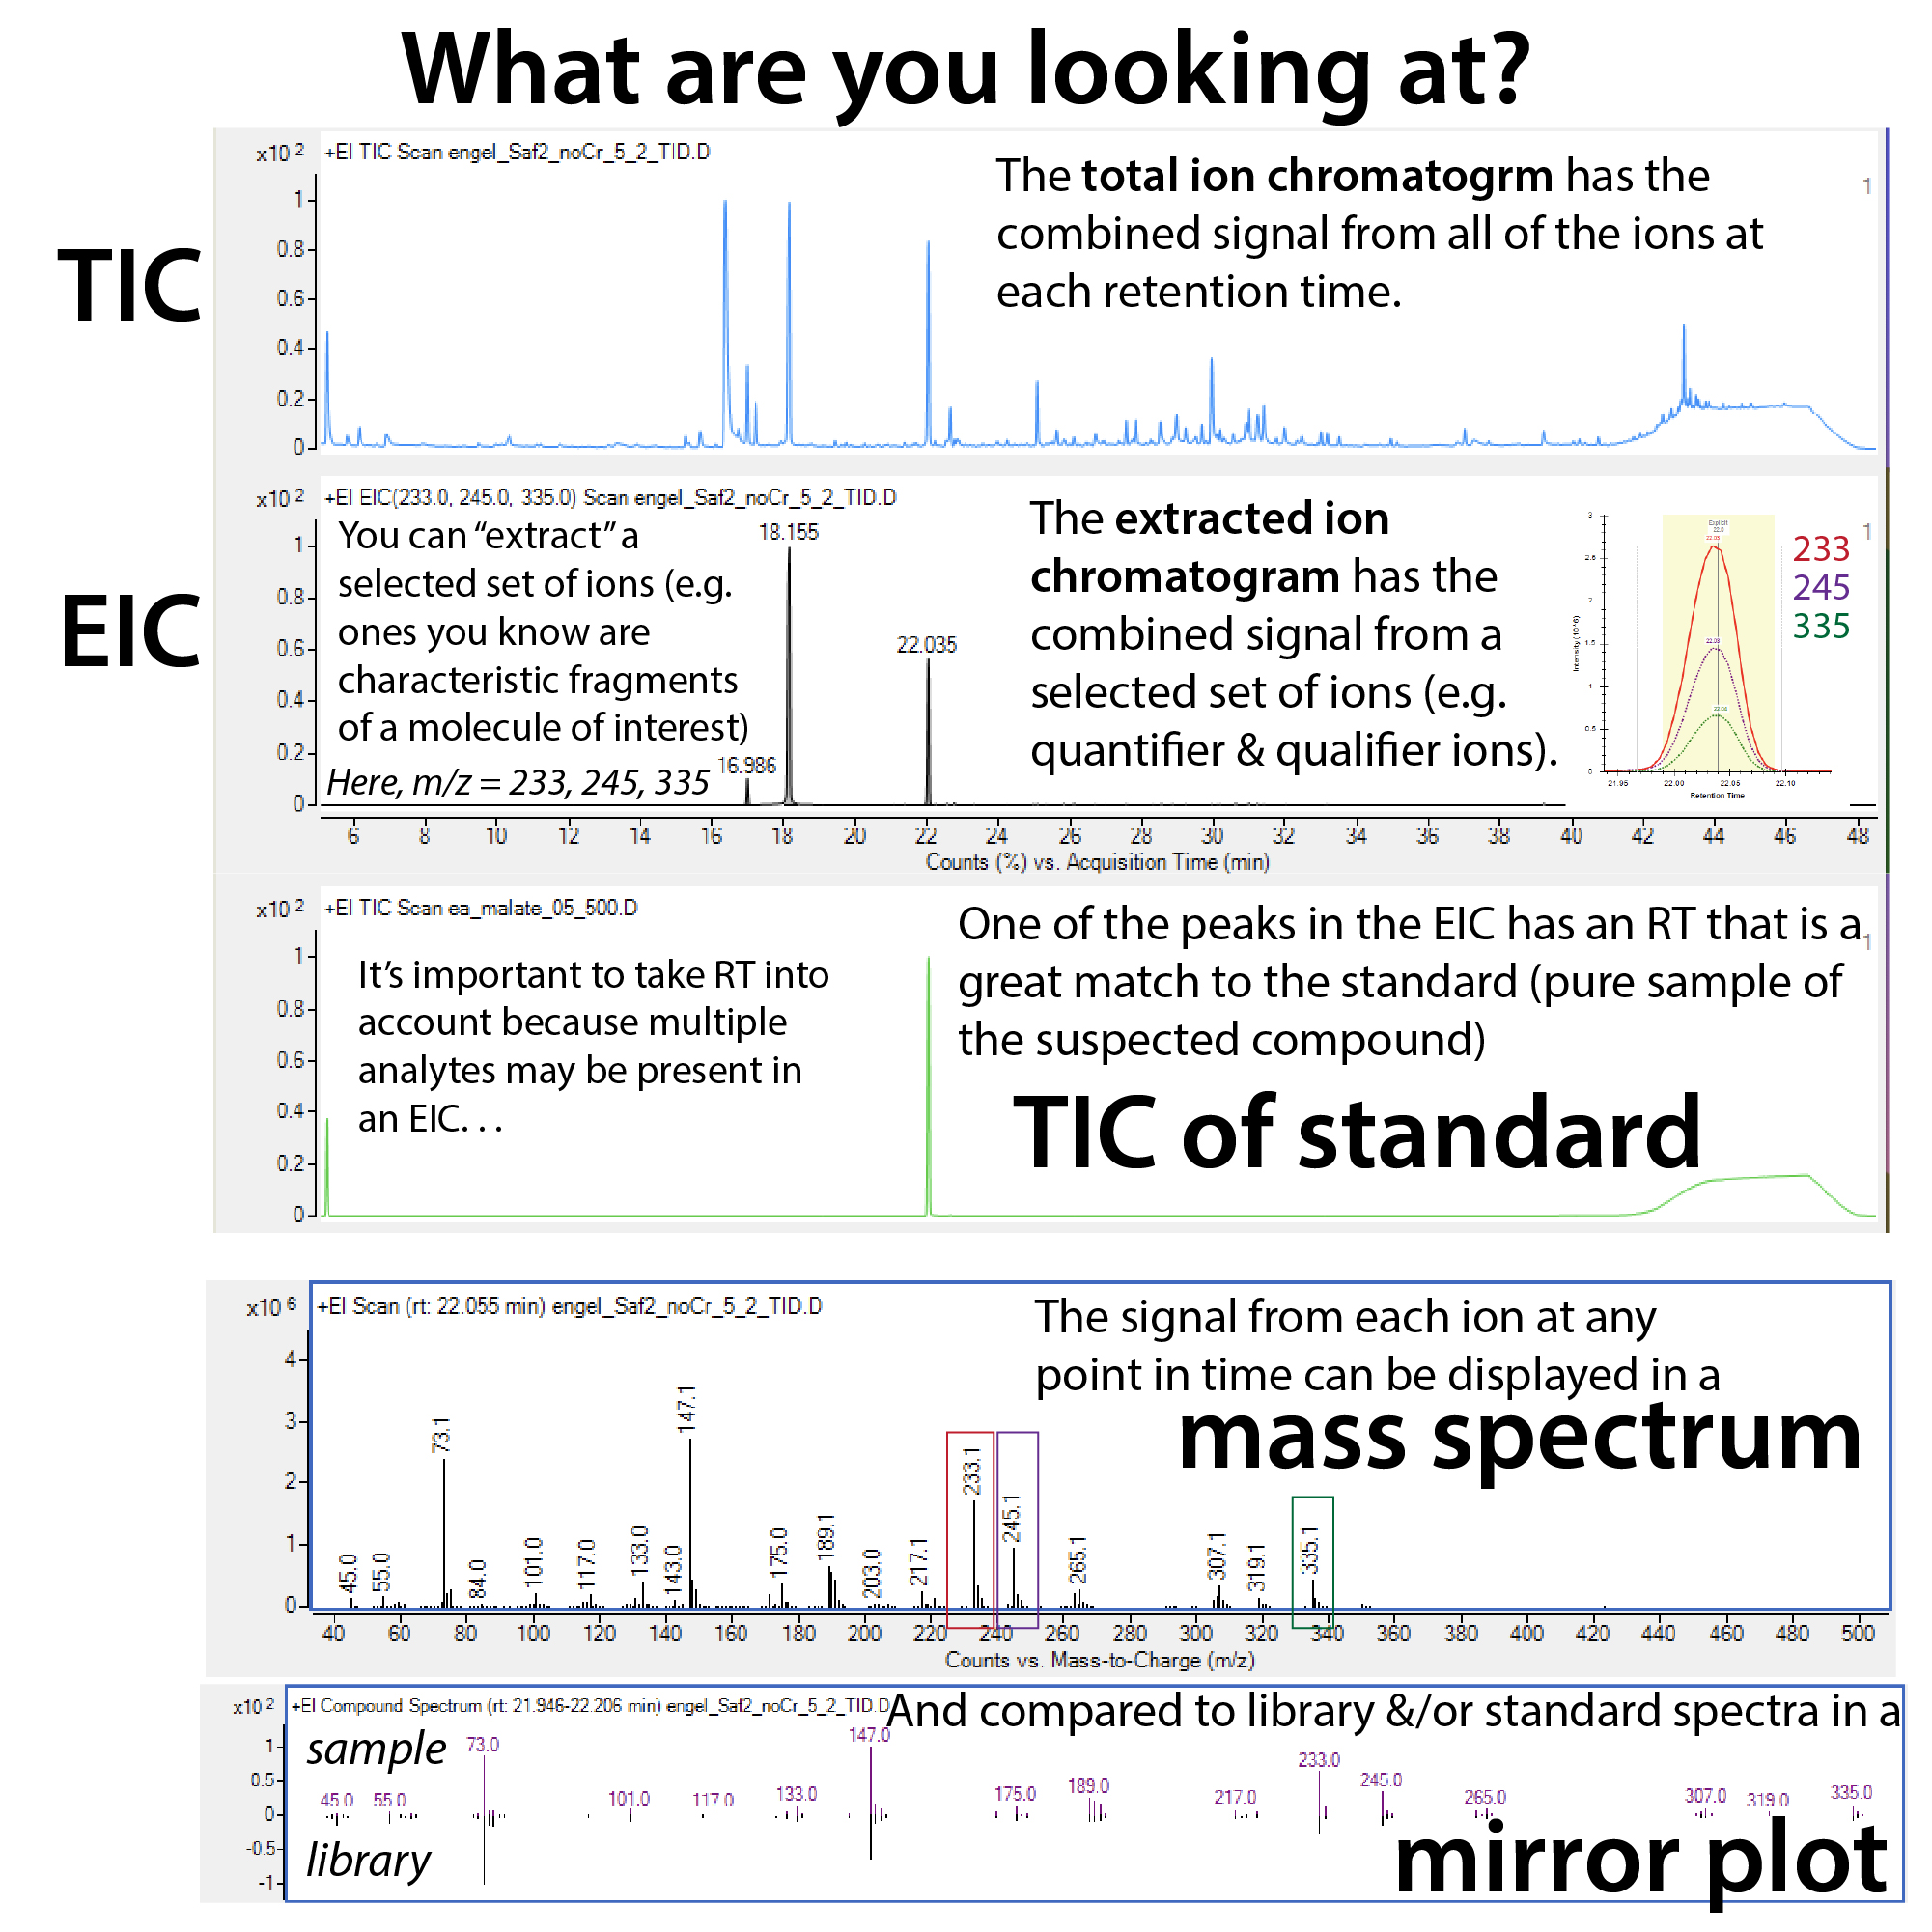
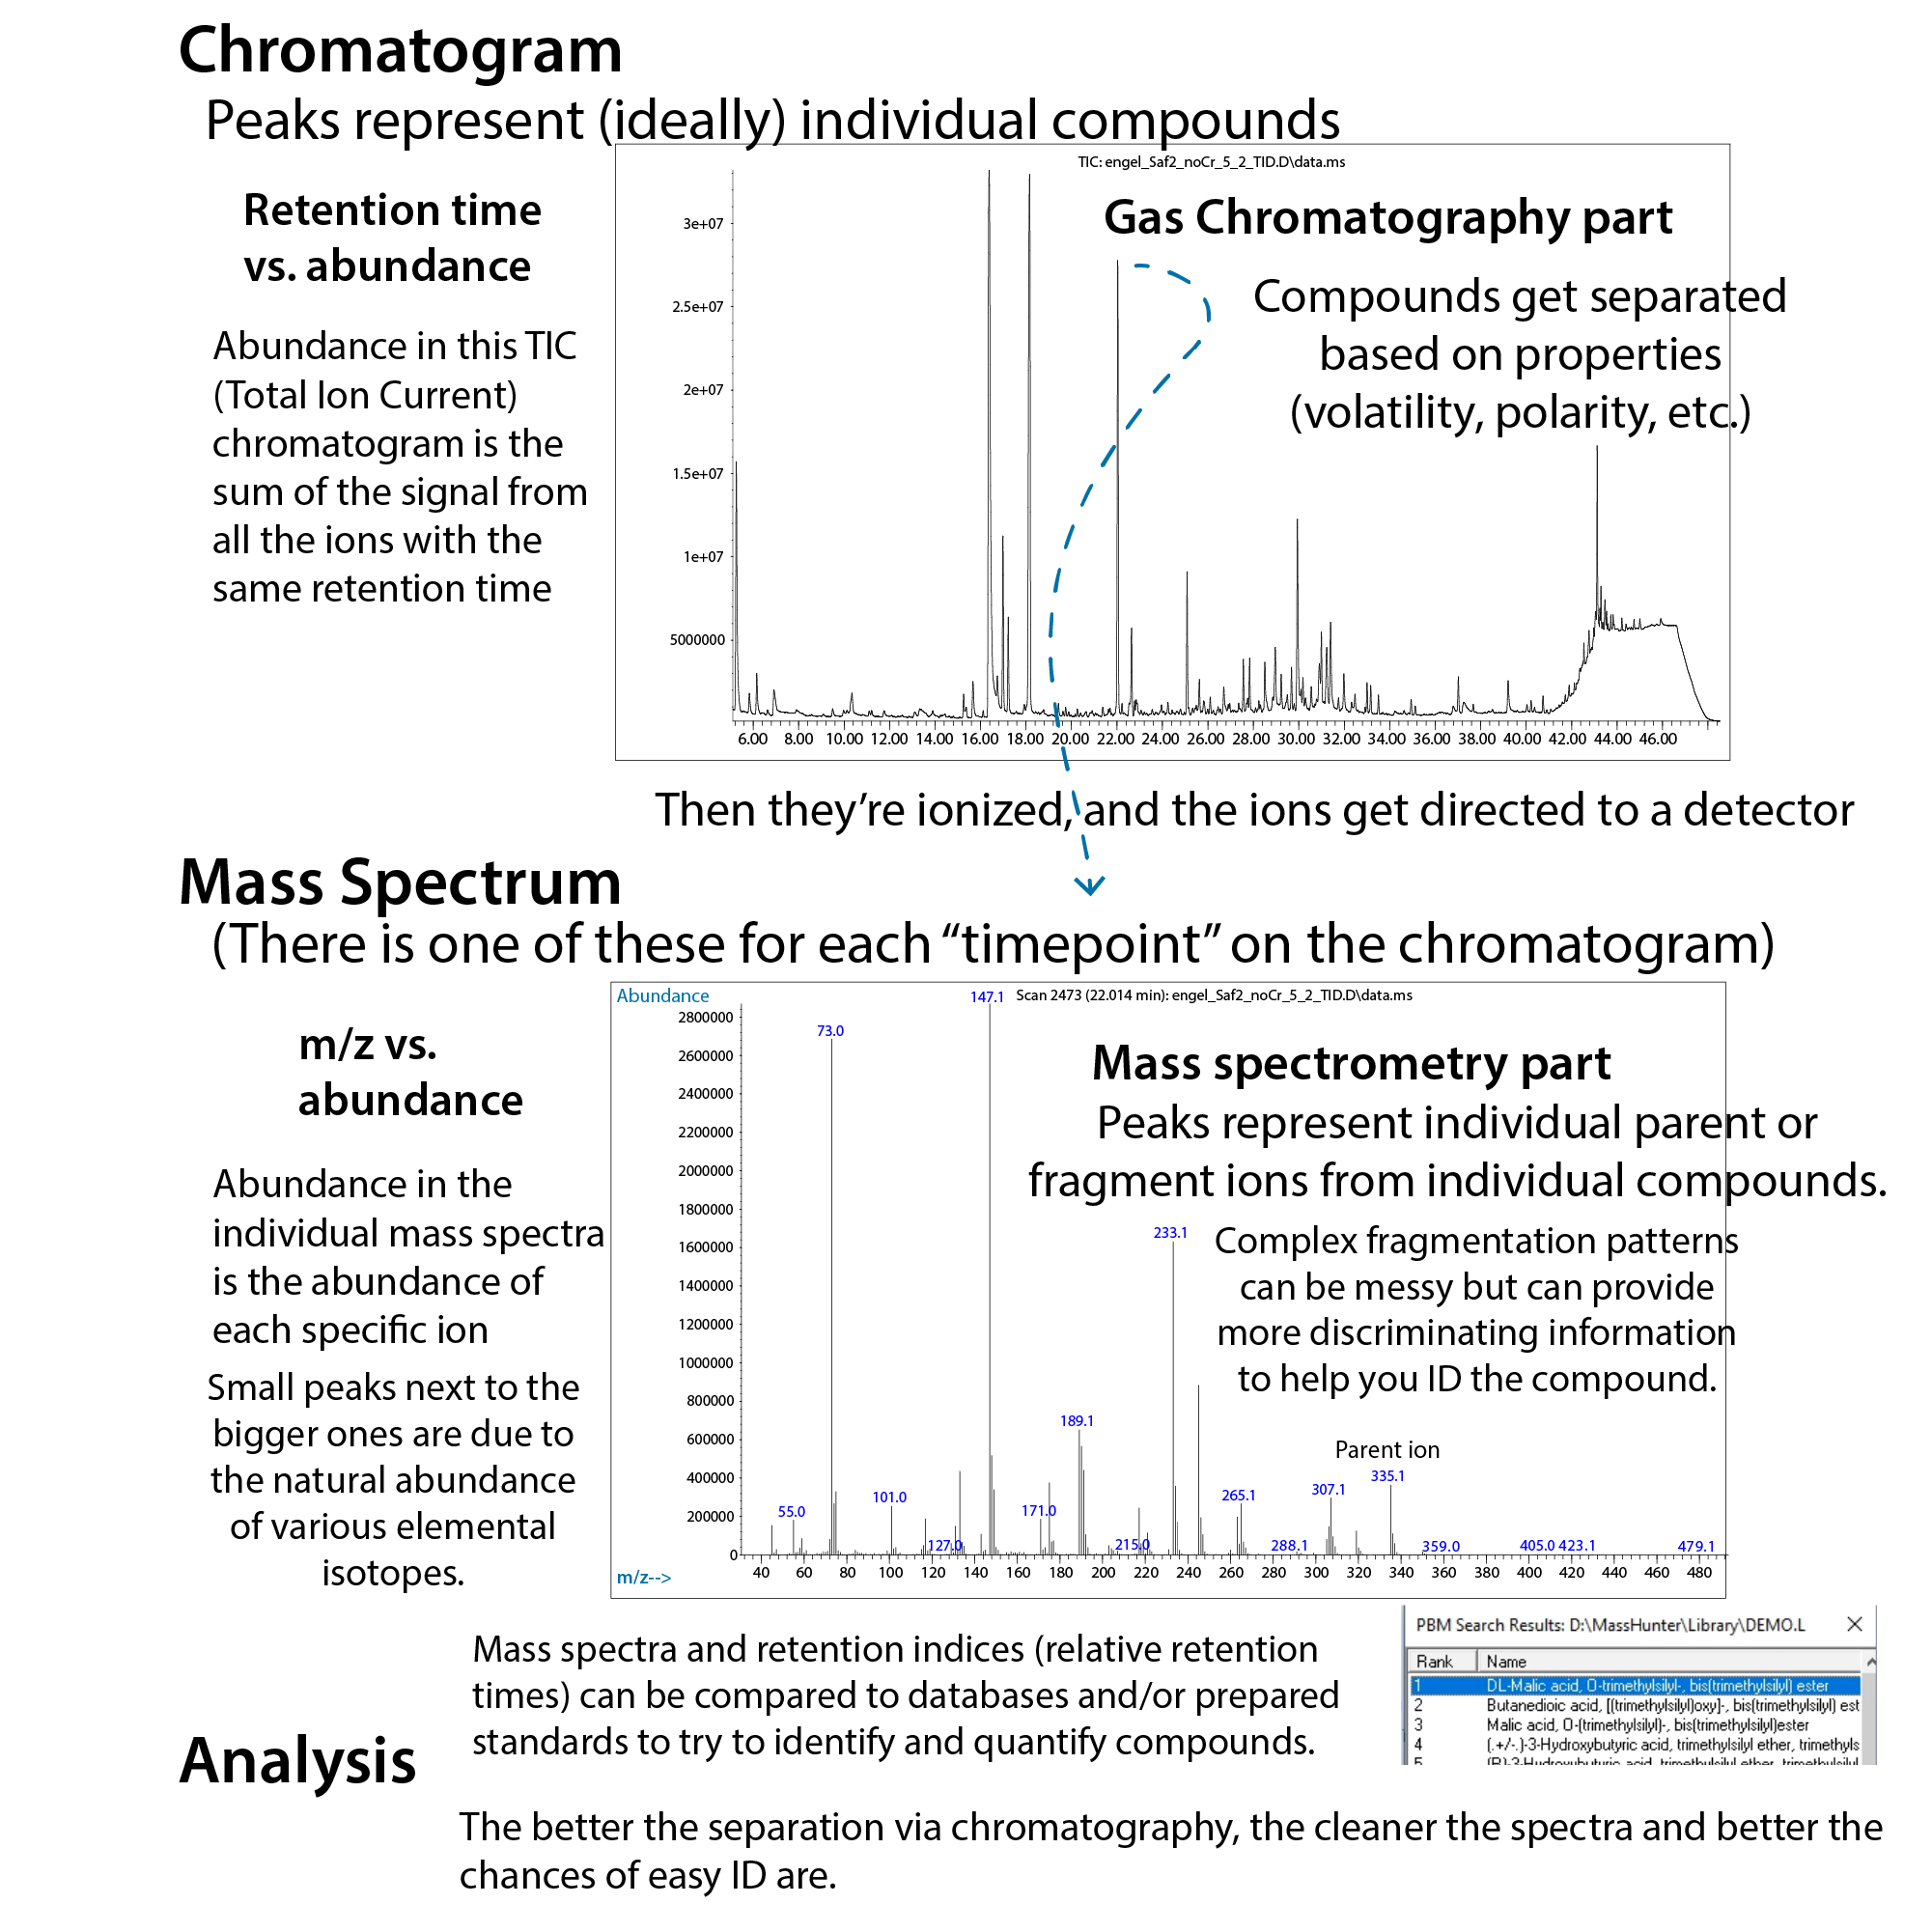
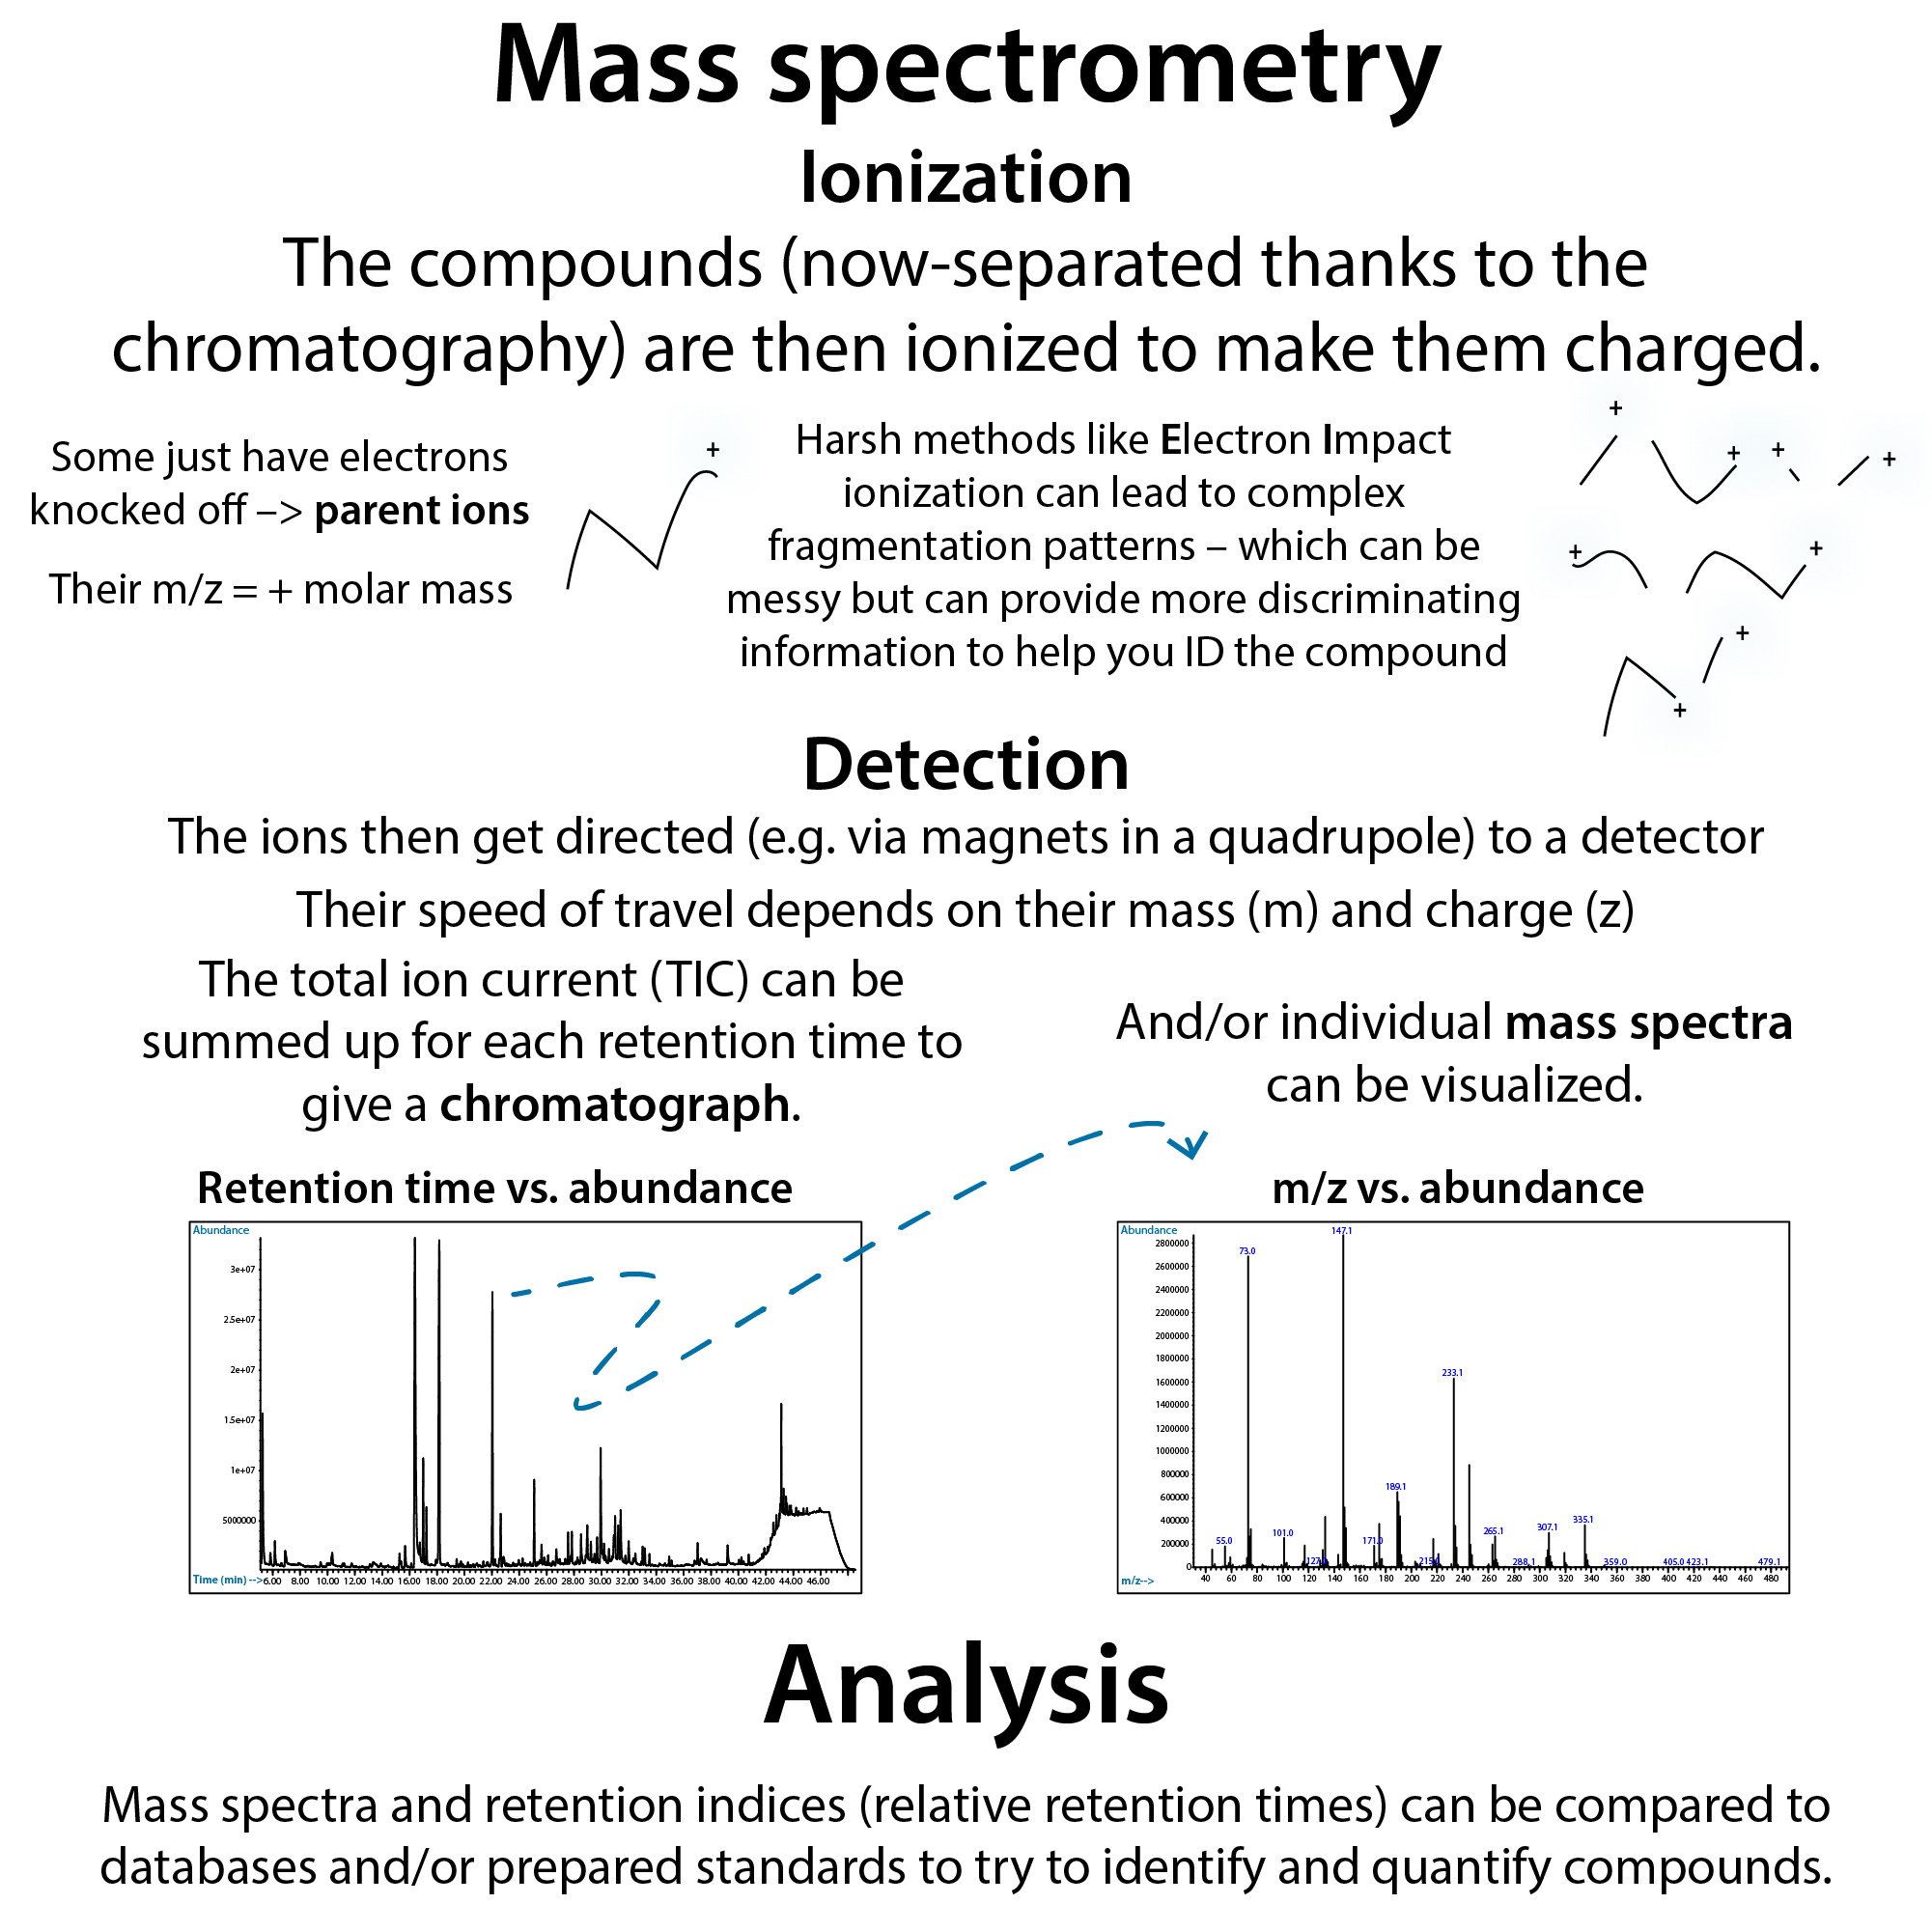
The total ion chromatogram (TIC) has the combined signal from all of the ions at each retention time. The signal from each ion at any point in time can be displayed in a mass spectrum. This “fingerprint,” combined with RT, helps you identify compounds. The sum of all the signals in the spectrum = the signal in the TIC at that RT.
You can also see where specific ions elute. Extracted Ion Chromatogram (EIC or XIC) “extracts” a selected set of ions (e.g. ones you know are characteristic fragments of a molecule of interest) and shows the chromatogram for just those. These are often quantifier and qualifier ions.
The quantifer ion is the one you use to actually quantitate things. Often, this is the ion with the highest specific signal, though it could also be one with a lesser signal if it has less interference from other molecules. You also don’t want to use the base ion (most abundant peak) if that ion is shared by a lot of molecules (such as the characteristic m/z = 73 fragments coming from TMS-derivatization).
Because there could be multiple molecules with that same ion, you then want to have additional ions to verify the identity. These can be called qualifier ions, and you typically might have two or three of them. You don’t use these for quantitation, but you do use these to make sure what you’re looking at is the molecule you think you’re looking at. These can be lower abundance but should be fairly distinct for analyte. Typically, higher mass ones are less likely to be common to many things and thus good choices.
You want all of these ions (the quantify and qualifier ions) to have the same retention time or else you are looking at ions from different molecules. You also want the ratio between their signals to match that of the library entry.
Note that the total signal (y-axis) on an EIC is lower, because you’re only looking at a subset of ions. Also note that it’s important to take RT into account because multiple analytes may be present in an EIC, but only one of the peaks in the EIC should have an RT that is a great match to the standard (pure sample of the suspected compound).
You might be wondering how you’re able to accurately quantify if you’re only using a single ion?! The thing is, ionization is compound-dependent -> different compounds will ionize differently so you can’t compare abundance of one compound to that of another without going through a calibration curve anyway. And you’d use that same ion to quantify your standard, allowing for a fair comparison. You can compare between samples, however (assuming normalization of samples).
The spectra will look different depending on the resolution of your mass detector and your fragmentation strategy (or lack of fragmentation). Without fragmentation (e.g. you’re looking at MS1 data for precursor/parent ions) you’ll “just” see the molecular ions (whole molecules rather than fragments) and adducts of them (a Na+ stuck on or something), whereas those molecular ions will be mostly lost with fragmentation, but replaced with a distinct “fingerprint” of ions. If you don’t fragment, you only have hope of ID-ing if you are measuring on a high-resolution mass spec (HRMS) (e.g. orbitrap, time-of-flight (TOF)) as opposed to a lower-res one like a single quadrupole or triple quad. With “HRMS,” you can take advantage of something called the mass defect.
A molecule’s mass comes from the makeup of its atoms. Atoms are made up of protons and neutrons (which each on their own have a mass ~1 amu) and electrons (which are really light but still have a mass (~0.00055 amu). We often simplify things by thinking of the mass of electrons being negligible and a proton or a neutron always being exactly 1. Therefore, if we sum up a molecule’s # of protons and neutrons (assuming the most common isotope of each element) we get an integer called the nominal mass.
But, those simplifications mask differences between different molecules, which can come into play (and be super useful) when working with high resolution accurate mass spectrometry (HRAMS), because the mass of a subatomic particle actually differs depending on the atom it’s part of! So, the precise, out to multiple decimal places, “exact mass” differs from the nominal mass. This difference between the exact mass and the nominal mass called is the mass defect. And, while we’re at it, the closeness of a measured mass to an exact mass is the mass accuracy.
The mass defect comes from differences in nuclear binding energy (which comes from the combination of the strong “nuclear force” attracting protons (+) and electrons (-) and the weaker coulombic repulsion from the protons repulsing one another). Thinking back to Einstein’s E = mc^2, when subatomic particles form a stable nucleus, they release energy, and thus a bit of mass. How much, depends on how much energy is released, which depends on the makeup of the atom. Molecules with different empirical formulas (# of each element) will always have different exact masses (though not necessarily different nominal masses). If a mass is measured accurately, therefore you can determine an empirical formula. If not, you may not be able to.
Even with an accurate mass, you may have to contend with isobars (other molecules with that mass). That’s where the chromatography part can hopefully come to your rescue. Look to the retention time!
Ultimately, however, no matter your method, you’ll want to, if at all possible, spike your sample with an isotopically-labeled (“heavy”) version of the suspected compound. If you do so, you should see them elute with the exact same retention time and have spectra that “match” with an offset of the mass added by the labels (e.g. +1 for each 13C vs 12C or 15N vs 14N). Unfortunately, as I’m finding, those can be very expensive!
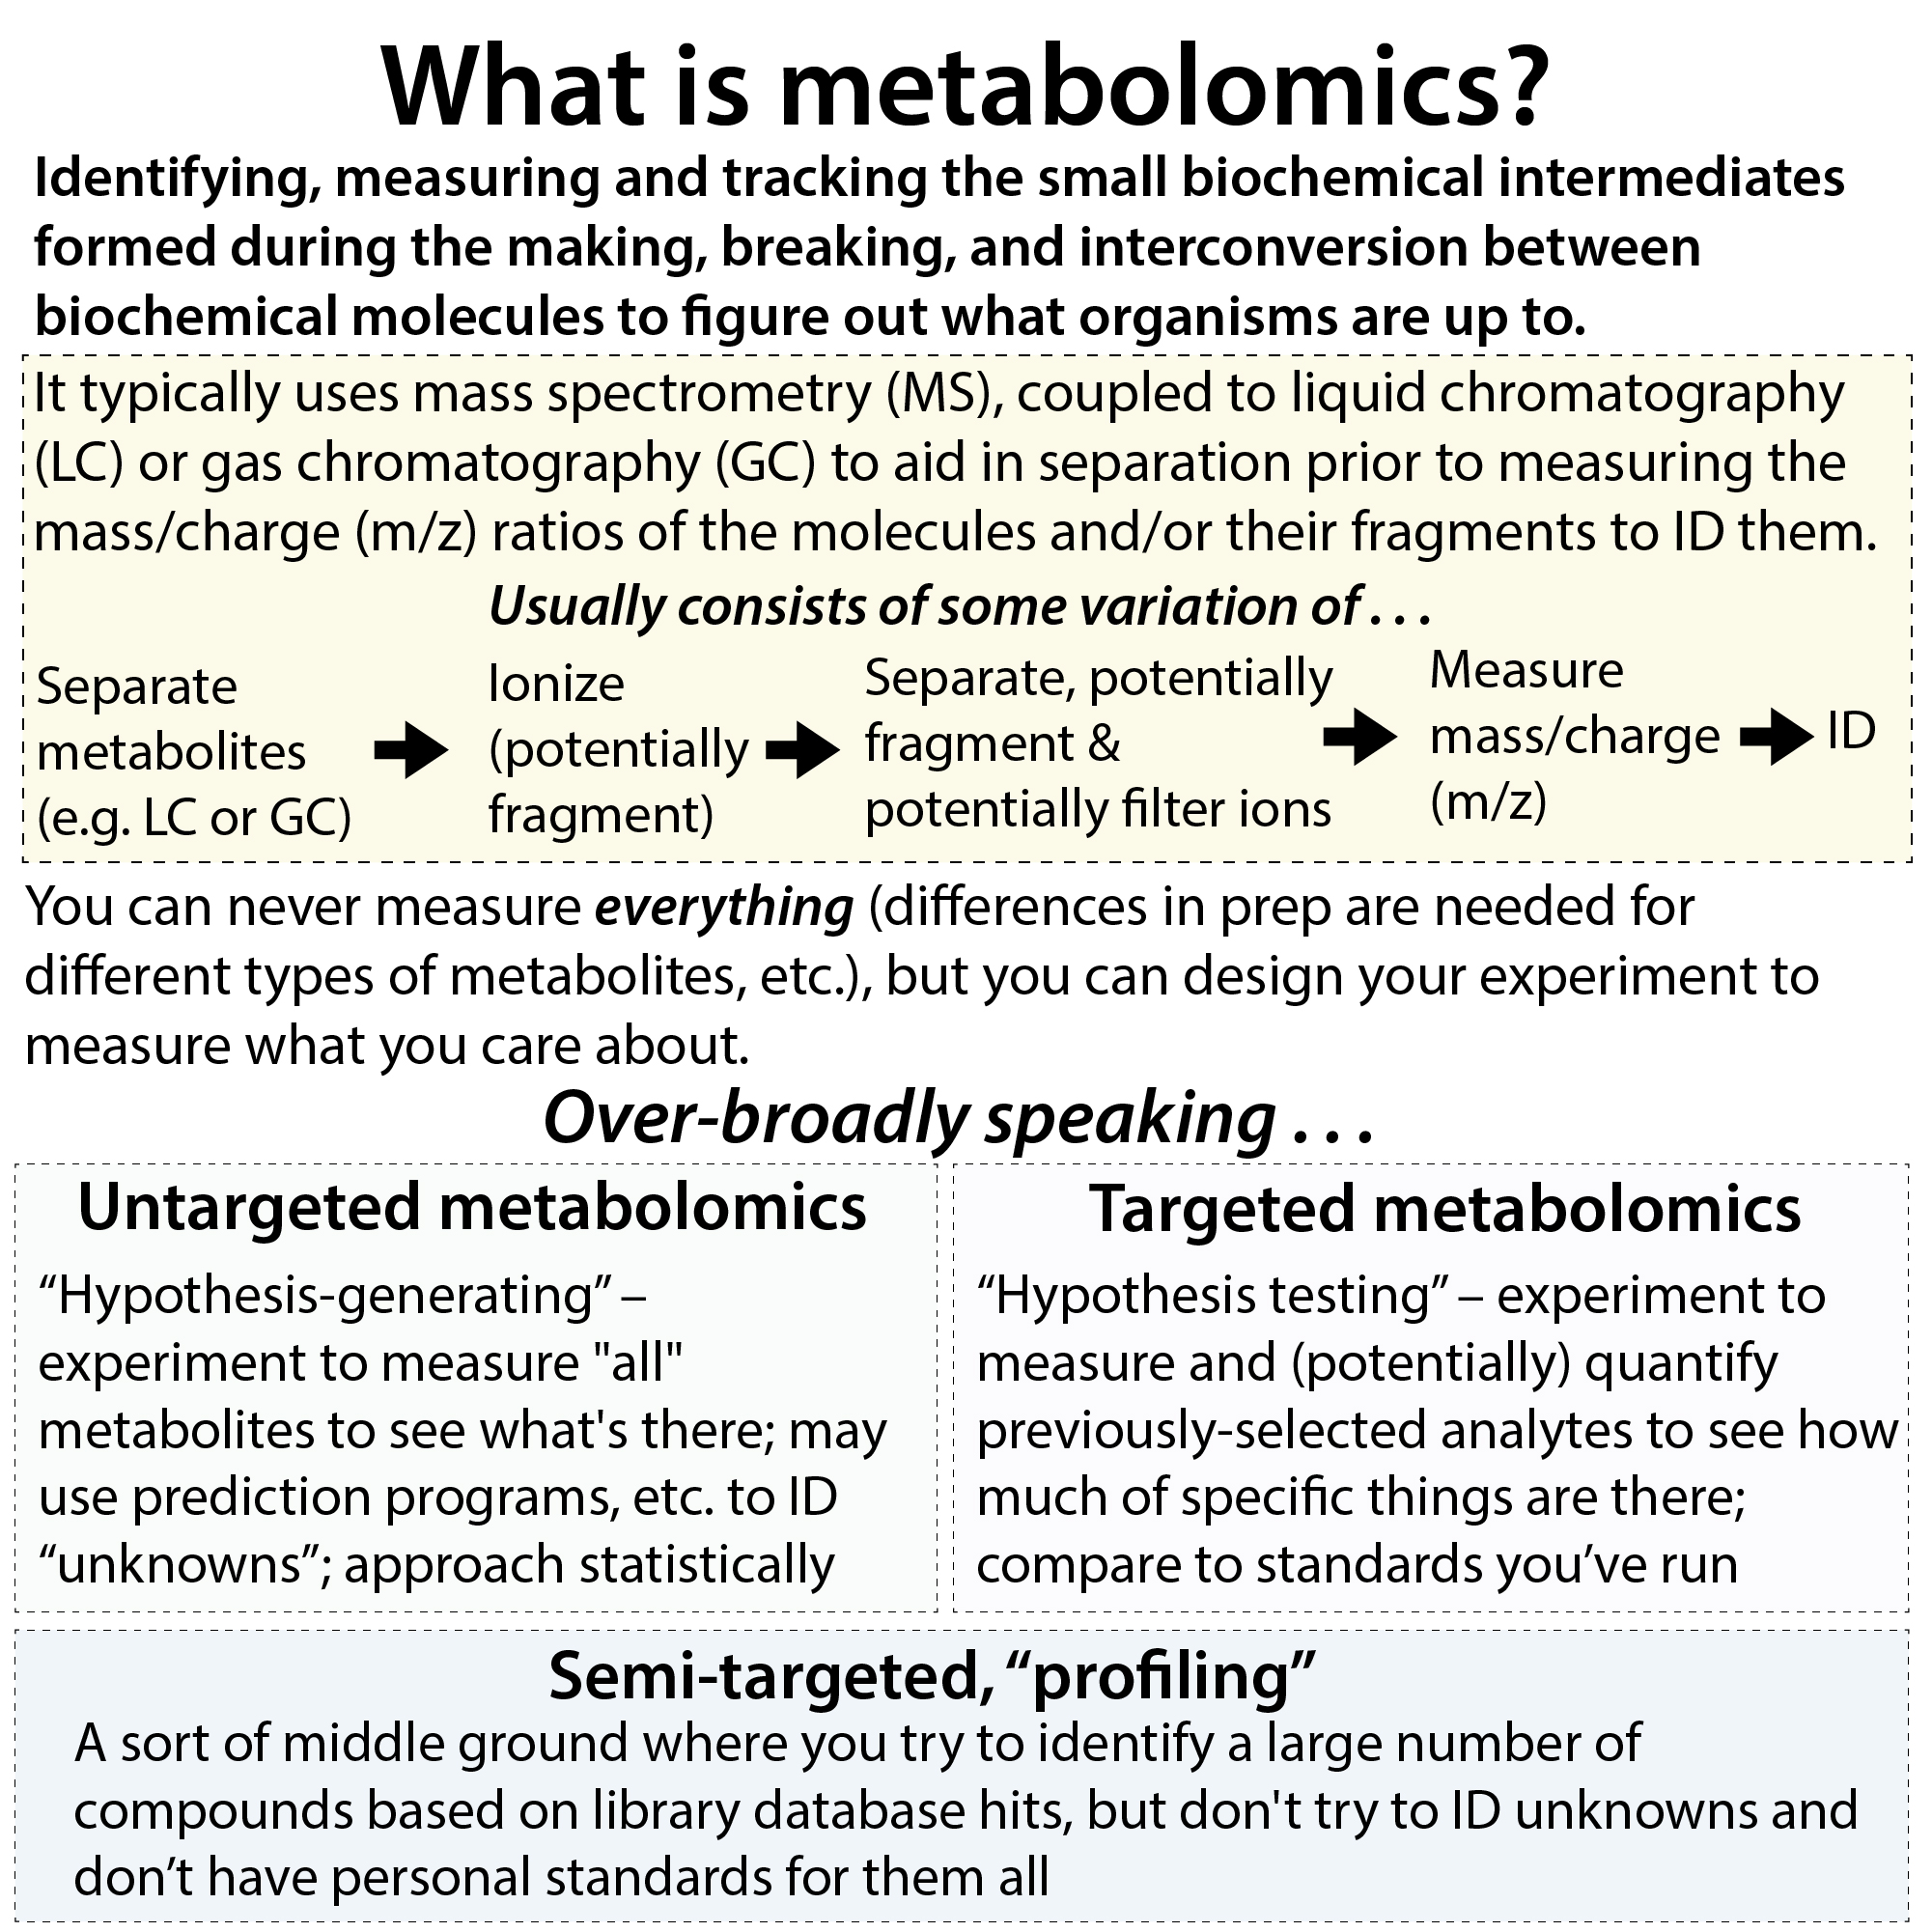
I use GC-MS for metabolomics, which I like to define as identifying, measuring and tracking the small biochemical intermediates formed during the making, breaking, and interconversion between biochemical molecules to figure out what organisms are up to. You can never measure everything (differences in prep are needed for different types of metabolites, etc.), but you can design your experiment to measure what you care about.
Broadly speaking . . .
Untargeted metabolomics: “Hypothesis-generating” – experiment to measure “all” metabolites to see what’s there; may use prediction programs, etc. to ID “unknowns”; approach statistically
Targeted metabolomics: “Hypothesis testing” – experiment to measure and (potentially) quantify previously-selected analytes to see how much of specific things are there; compare to standards you’ve run
Semi-targeted, “profiling”: A sort of middle ground where you try to identify a large number of compounds based on library database hits, but don’t try to ID unknowns and don’t have personal standards for them all
More to come!
Some helpful links:
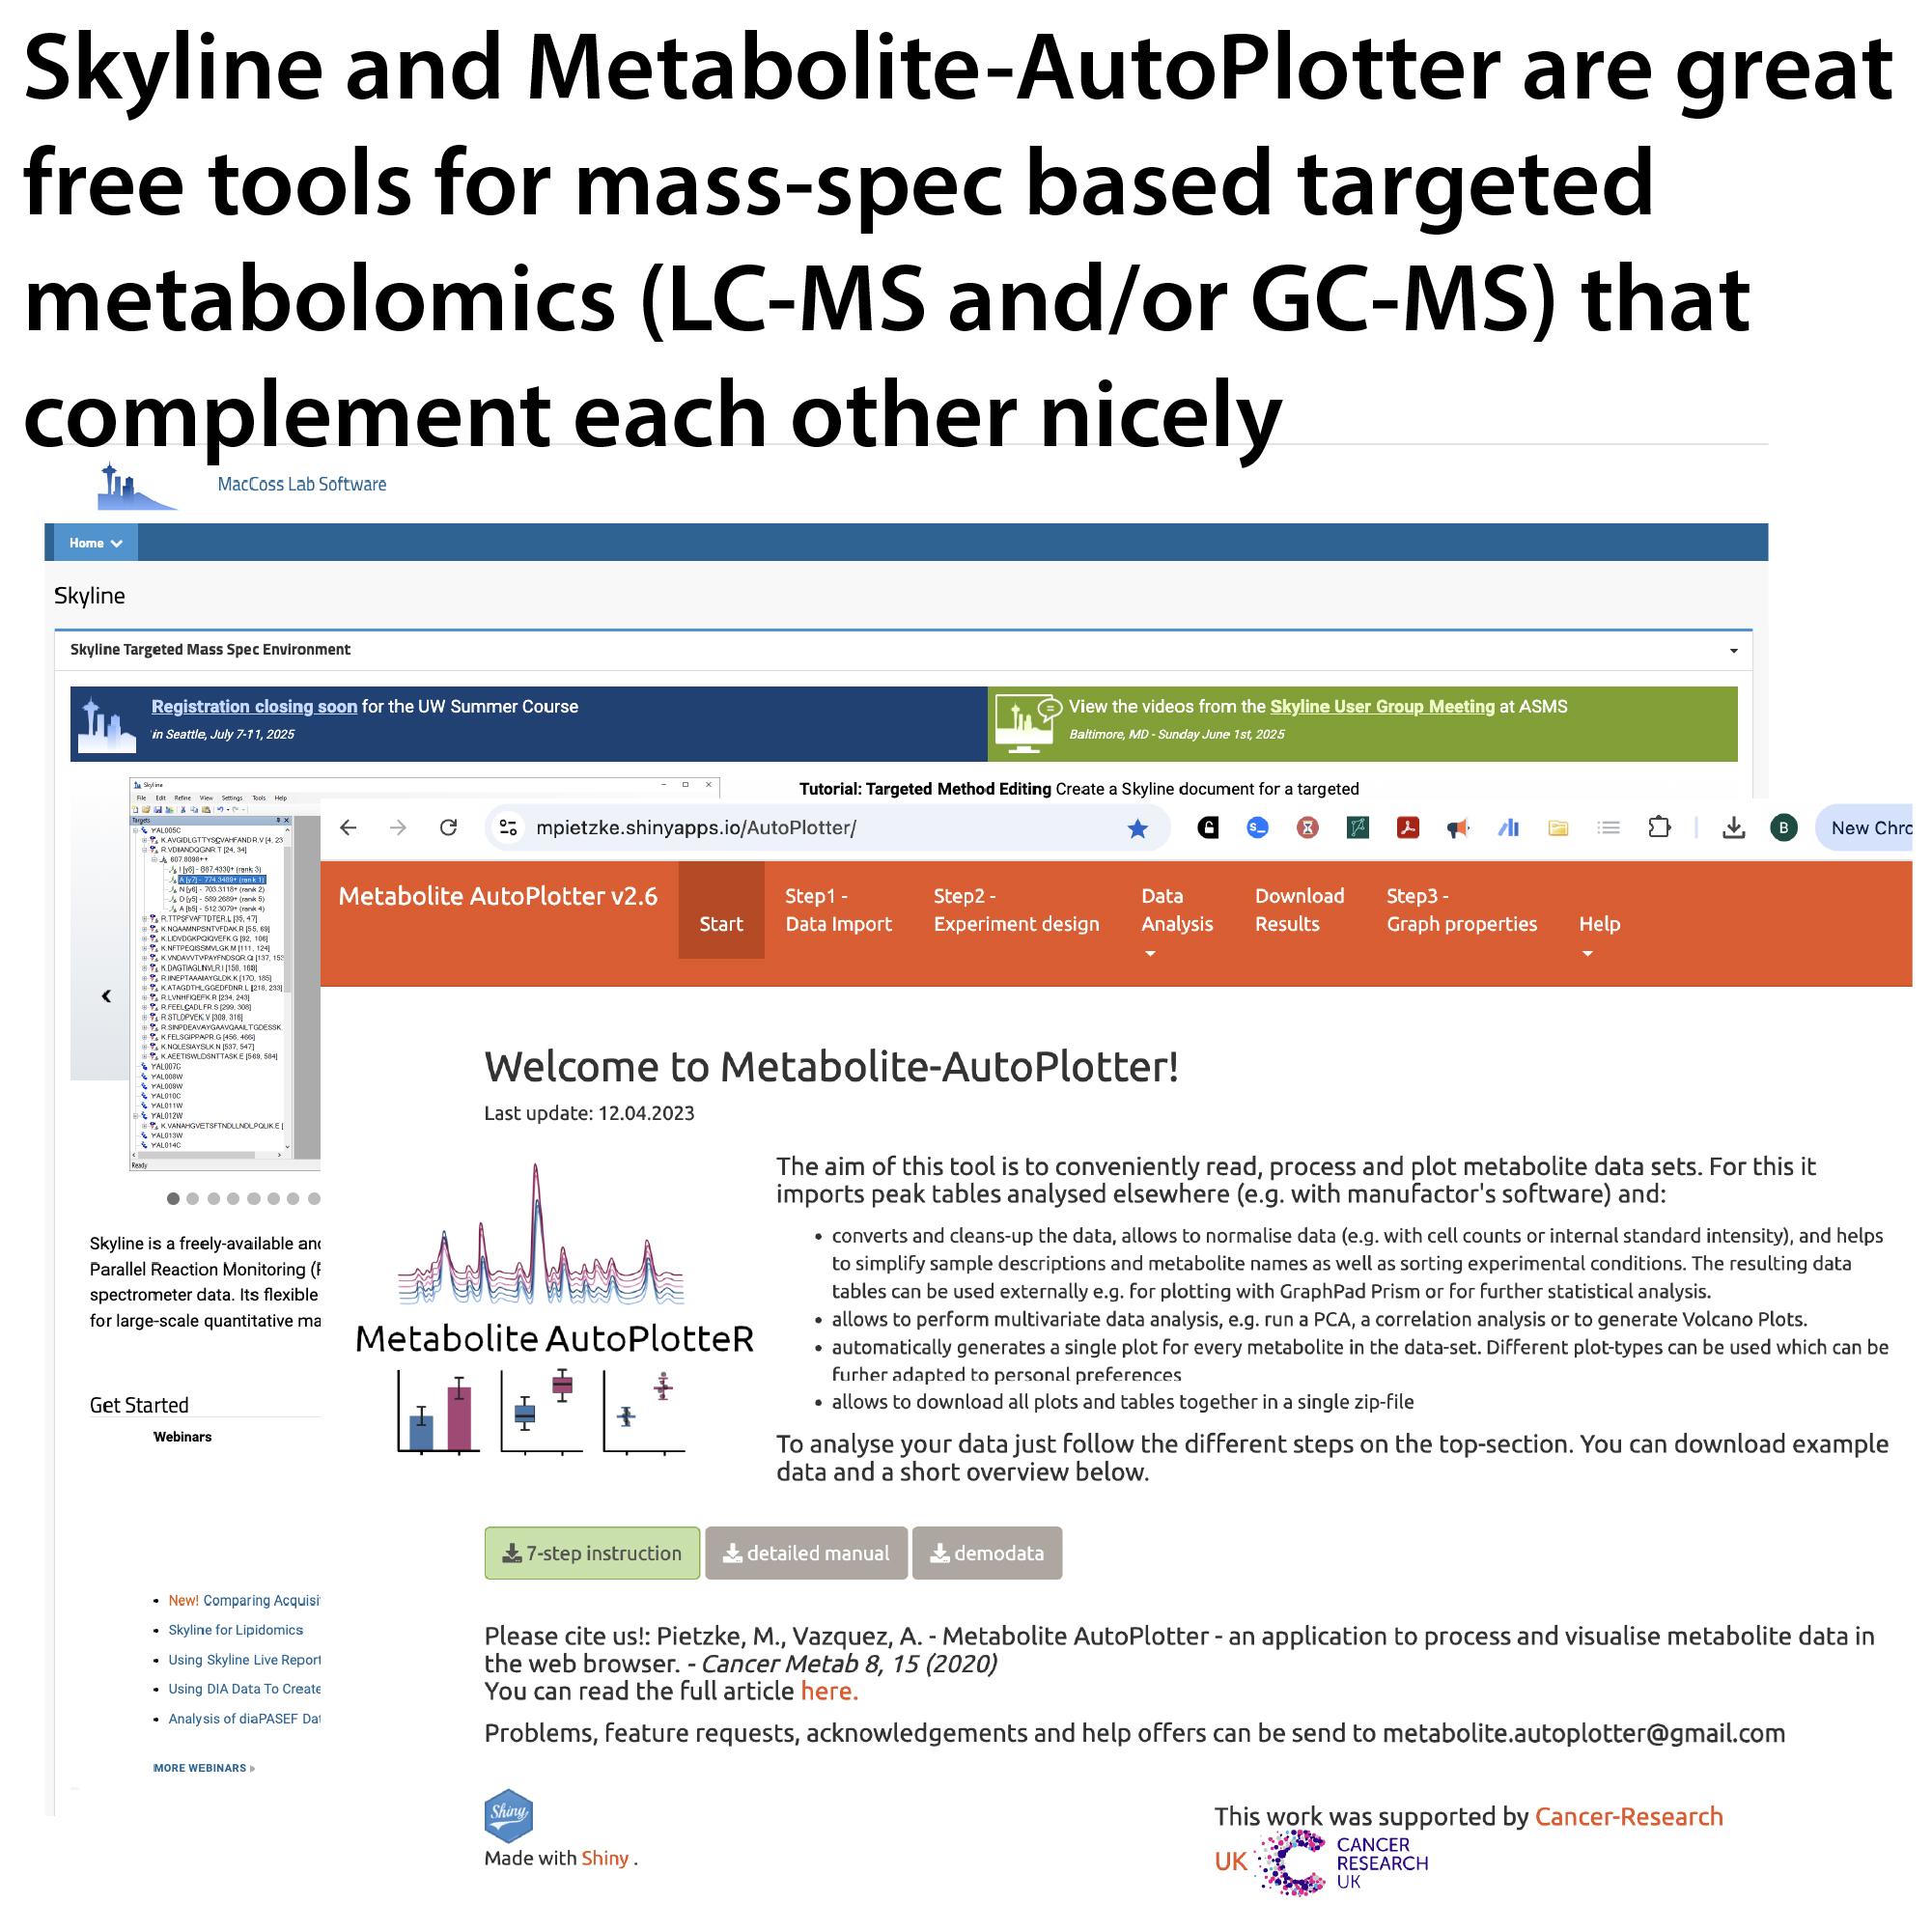
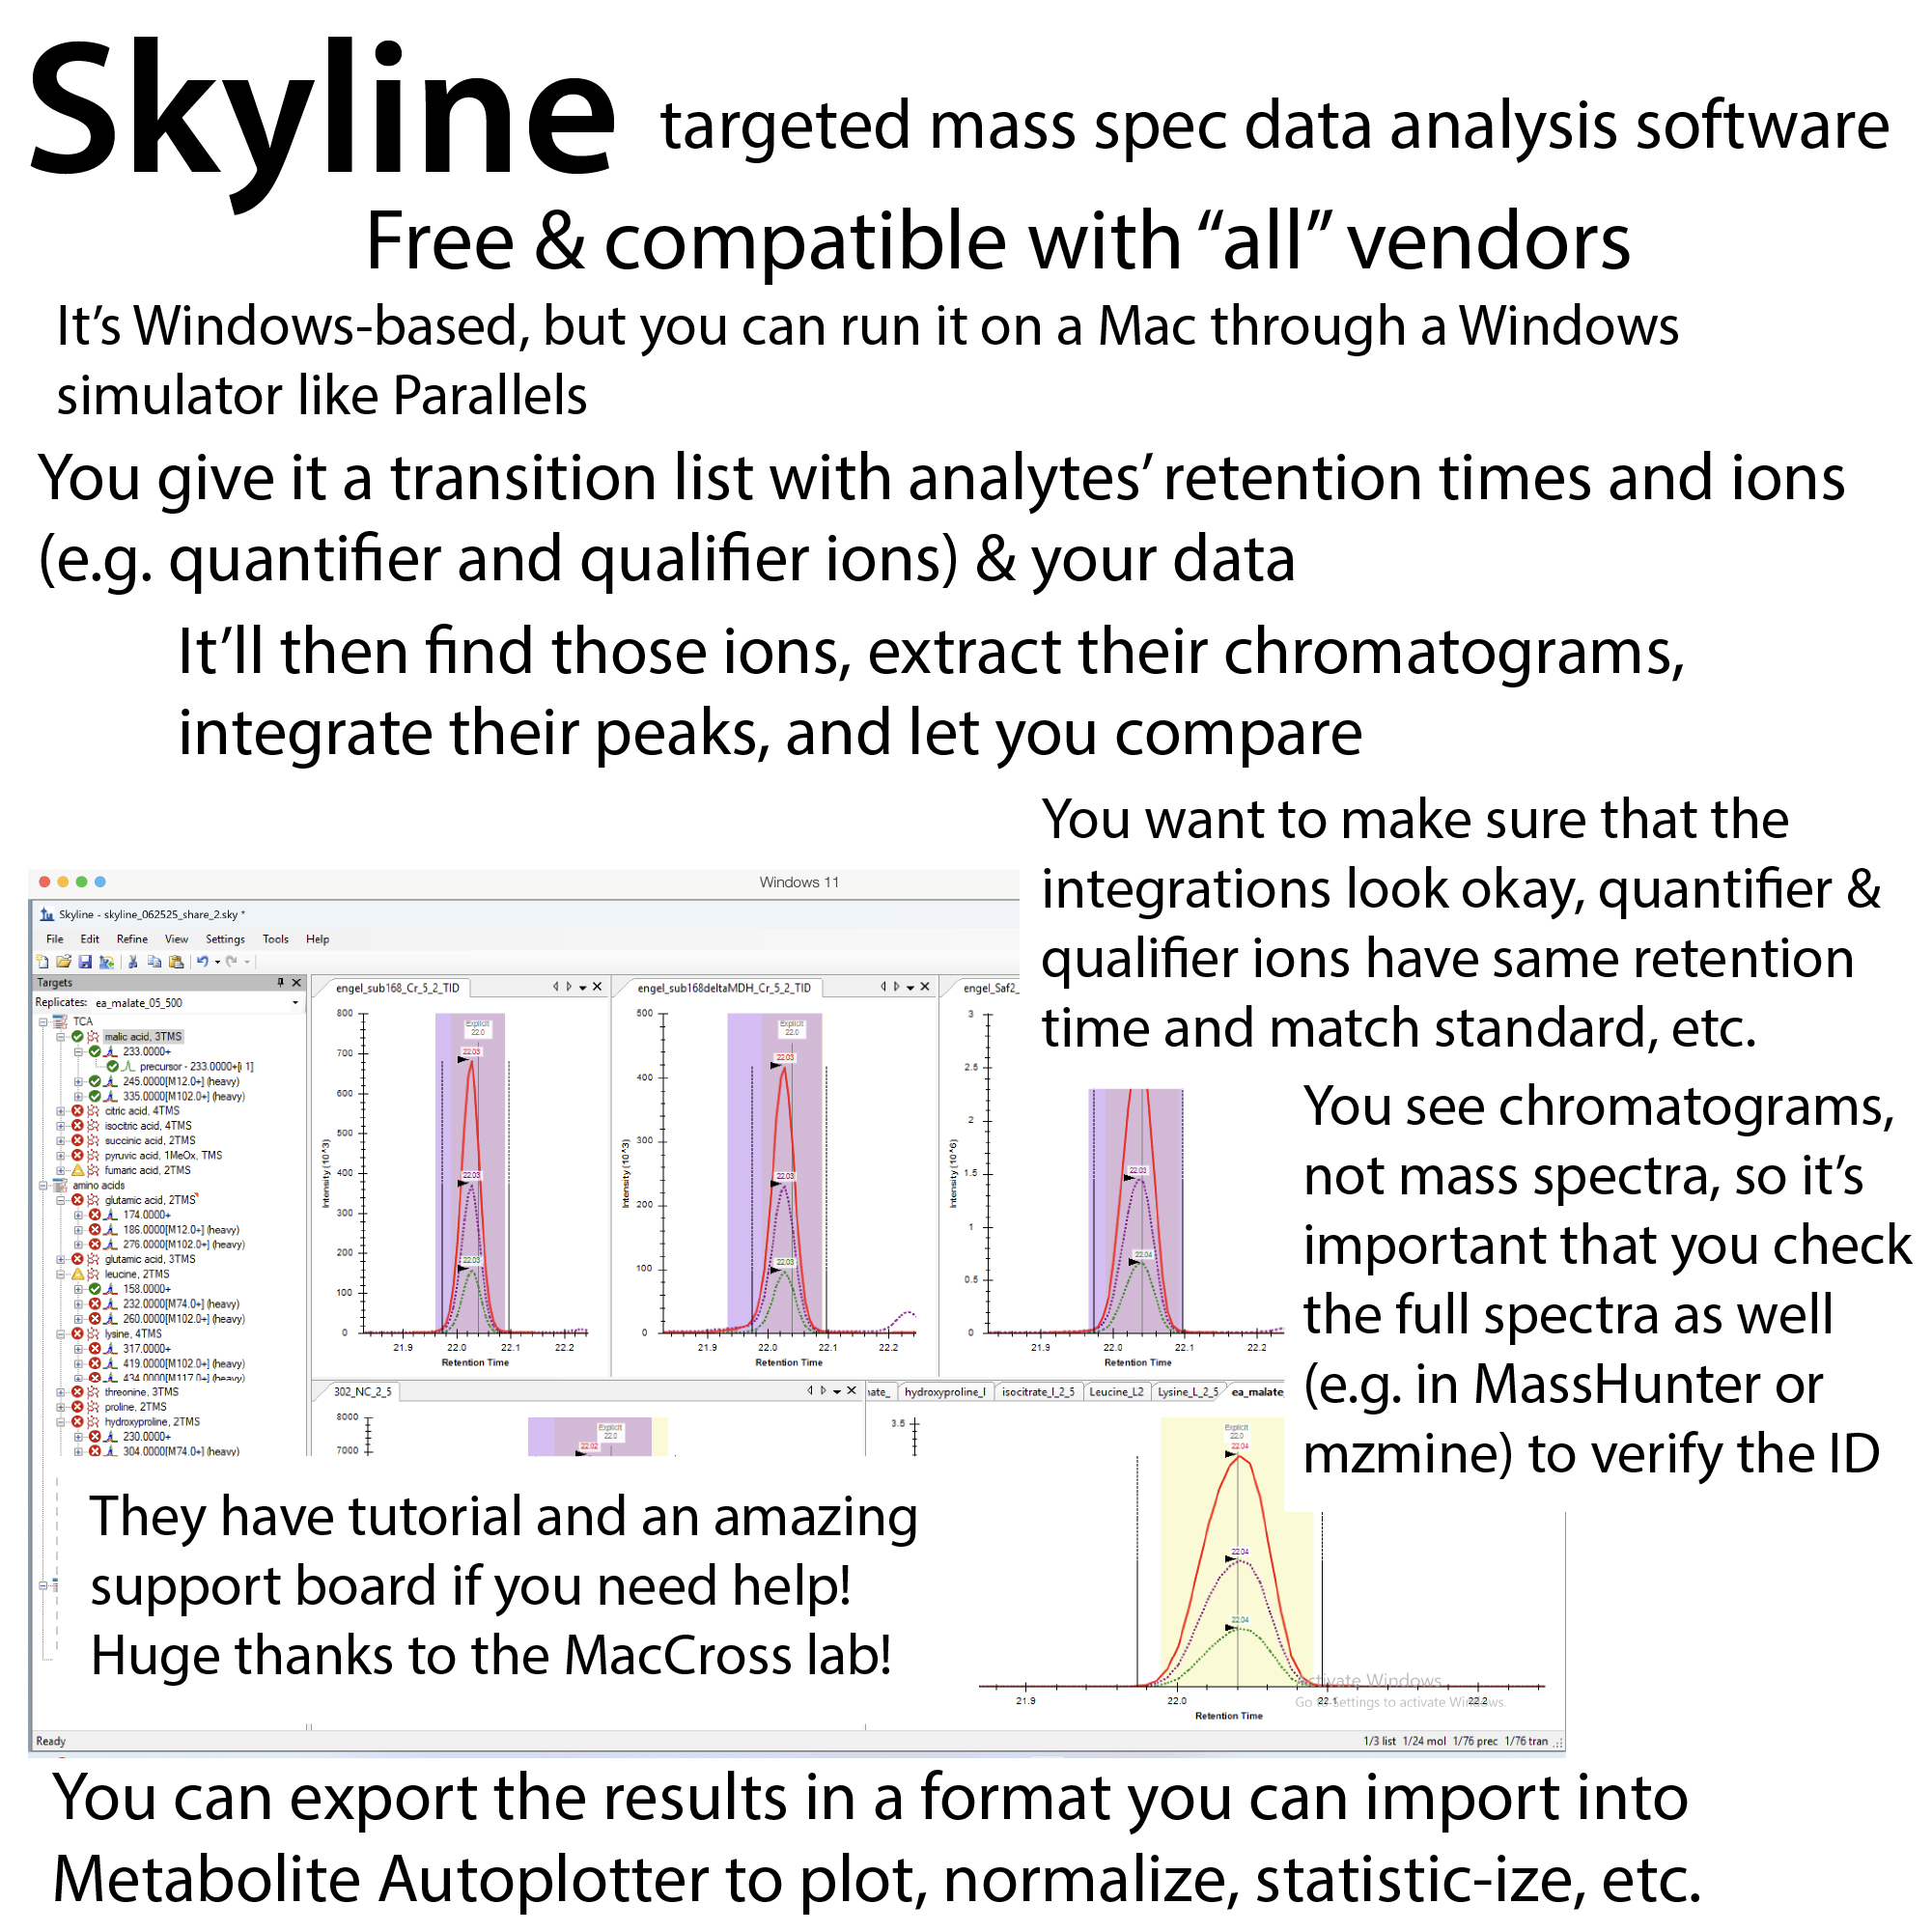
Skyline: https://skyline.ms/project/home/software/Skyline/begin.view Adams, K. J., Pratt, B., Bose, N., Dubois, L. G., John‐Williams, L. S., Perrott, K. M., … & Thompson, J. W. (2020). Skyline for small molecules: a unifying software package for quantitative metabolomics. Journal of Proteome Research, 19(4), 1447-1458. https://doi.org/10.1021/acs.jproteome.9b00640
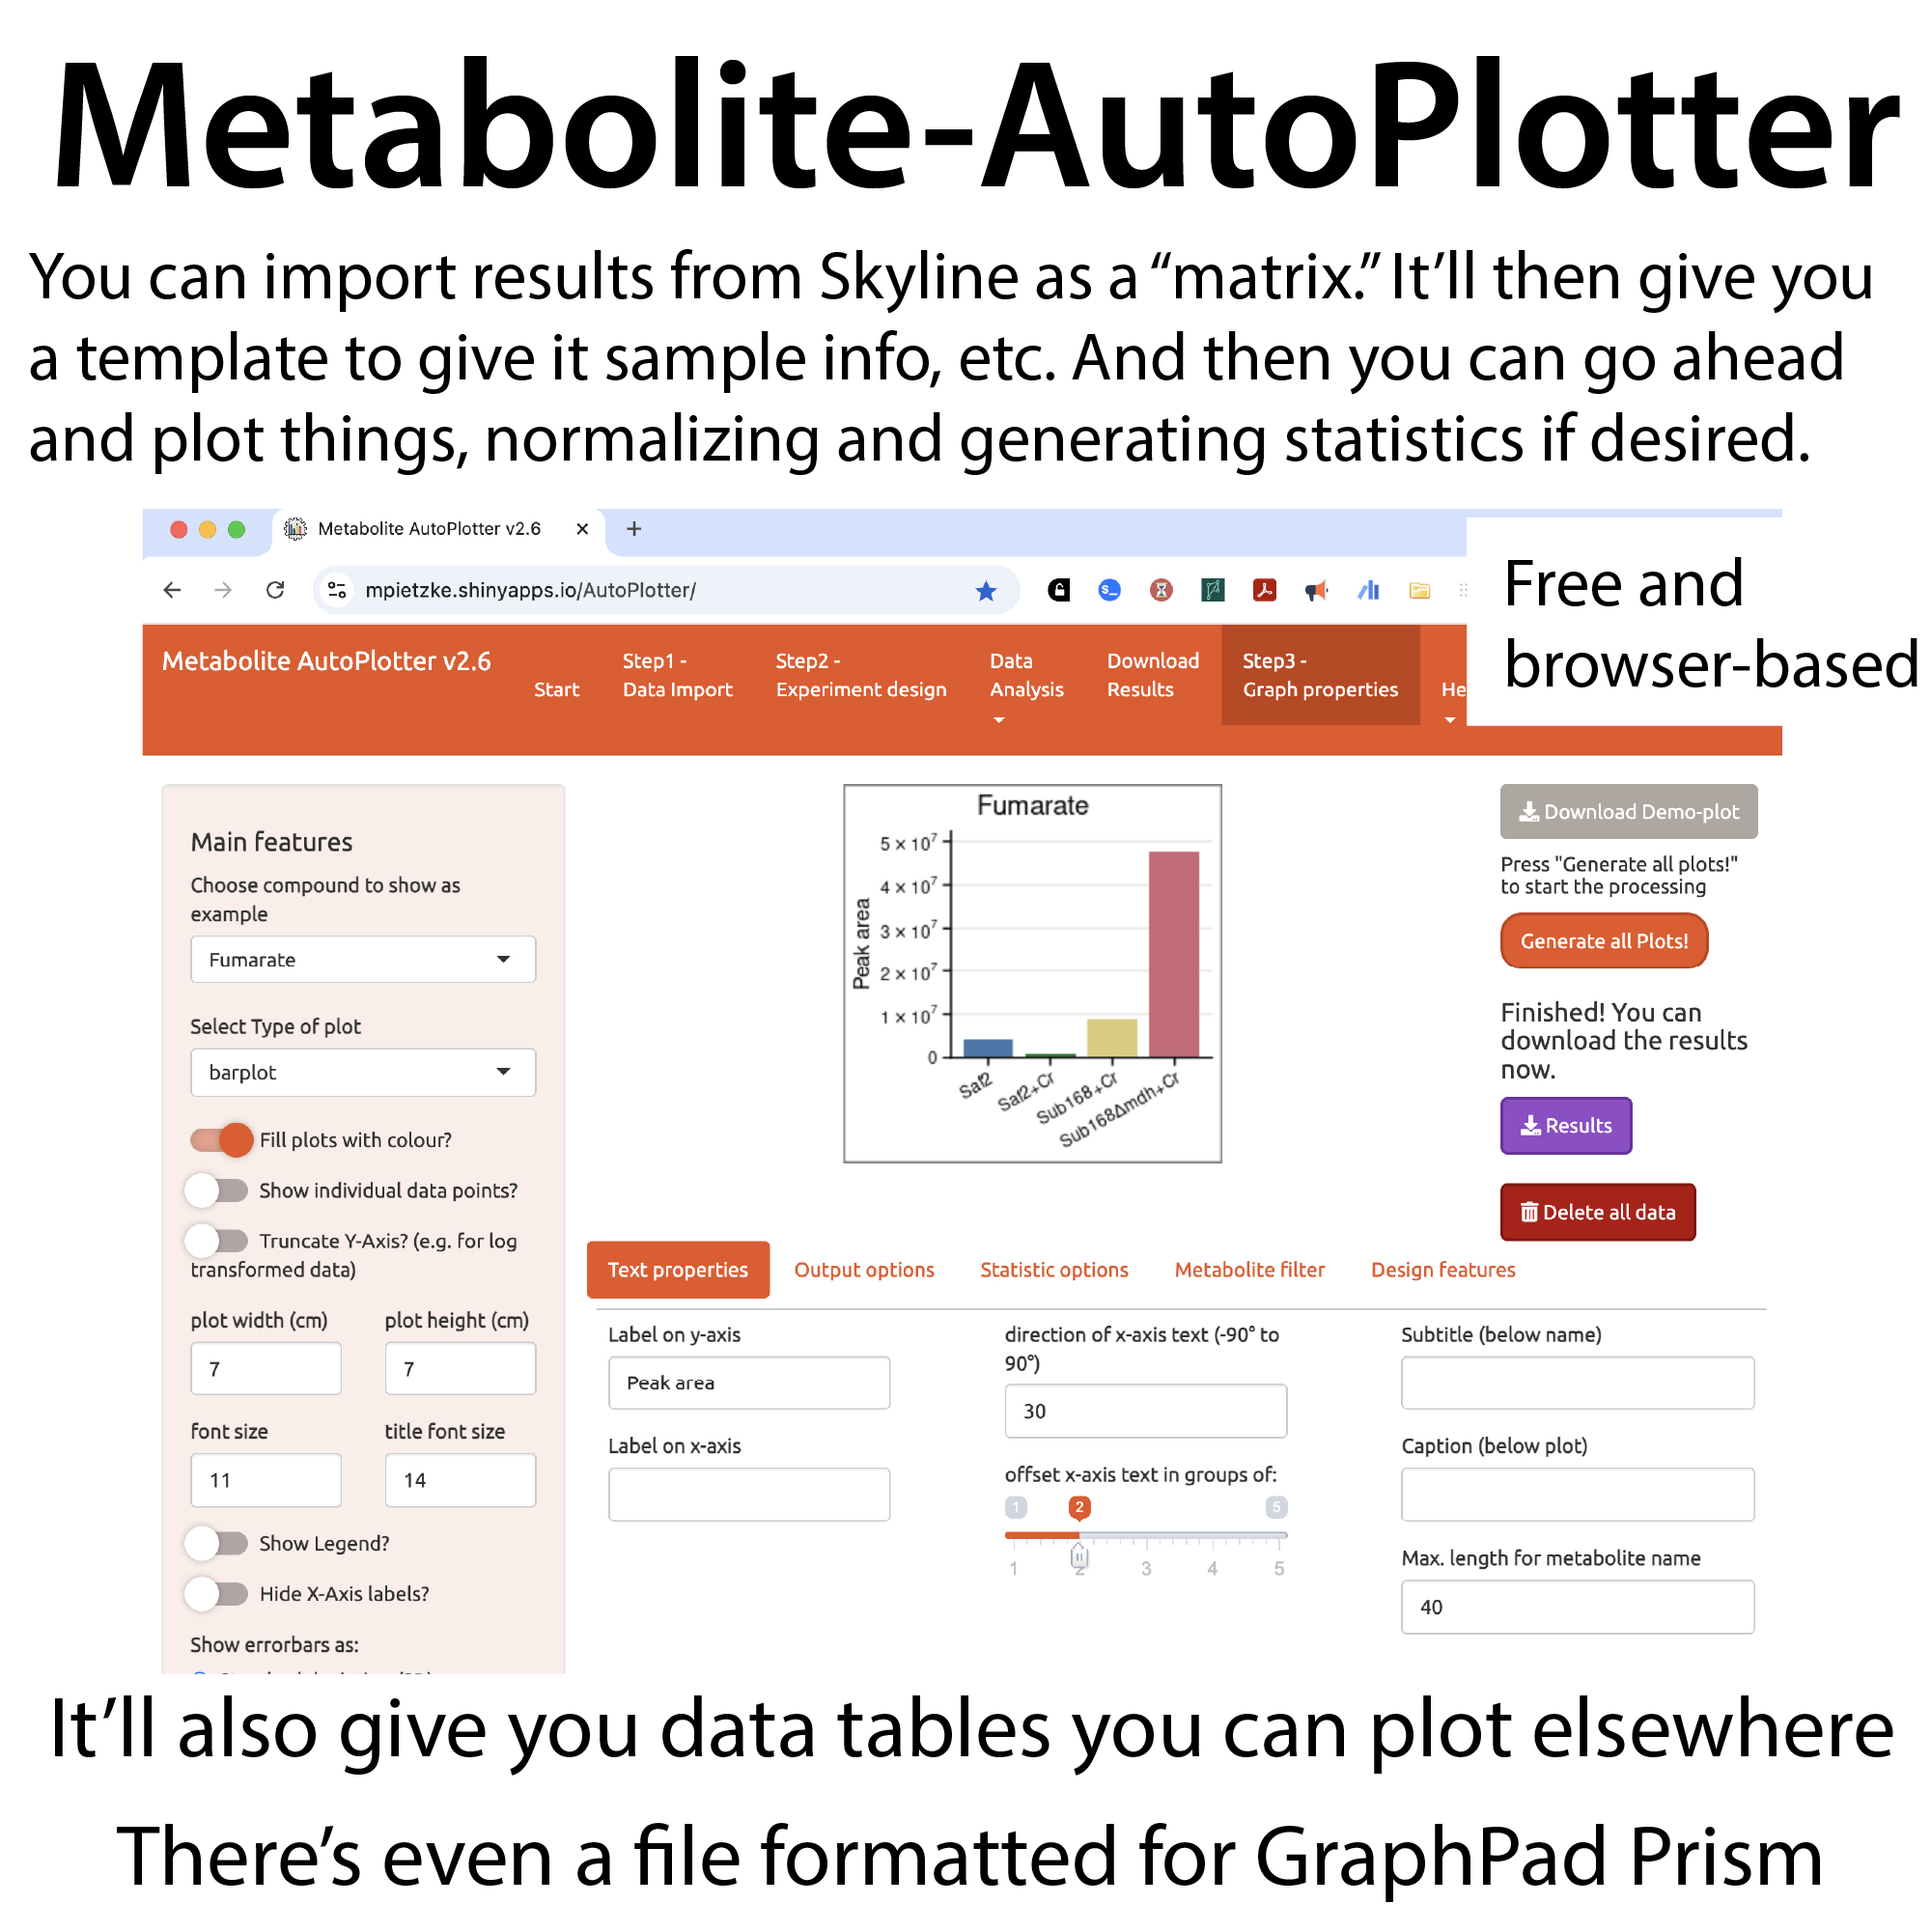
Metabolite AutoPlotter: https://mpietzke.shinyapps.io/AutoPlotter/ Pietzke, M., Vazquez, A. – Metabolite AutoPlotter – an application to process and visualise metabolite data in the web browser. – Cancer Metab 8, 15 (2020)
Volmer, D.; Leslie, A. Dealing With the Masses: A Tutorial on Accurate Masses, Mass 32 Uncertainties, and Mass Defects. 2007, 22. https://www.spectroscopyonline.com/view/dealing-masses-tutorial-accurate-masses-mass-32-uncertainties-and-mass-defects
Habler, K.; Rexhaj, A.; Adling-Ehrhardt, M.; Vogeser, M. Understanding Isotopes, Isomers, and Isobars in Mass Spectrometry. Journal of Mass Spectrometry and Advances in the Clinical Lab 2024, 33, 49–54. https://doi.org/10.1016/j.jmsacl.2024.08.002.




More about mass spec-related topics…
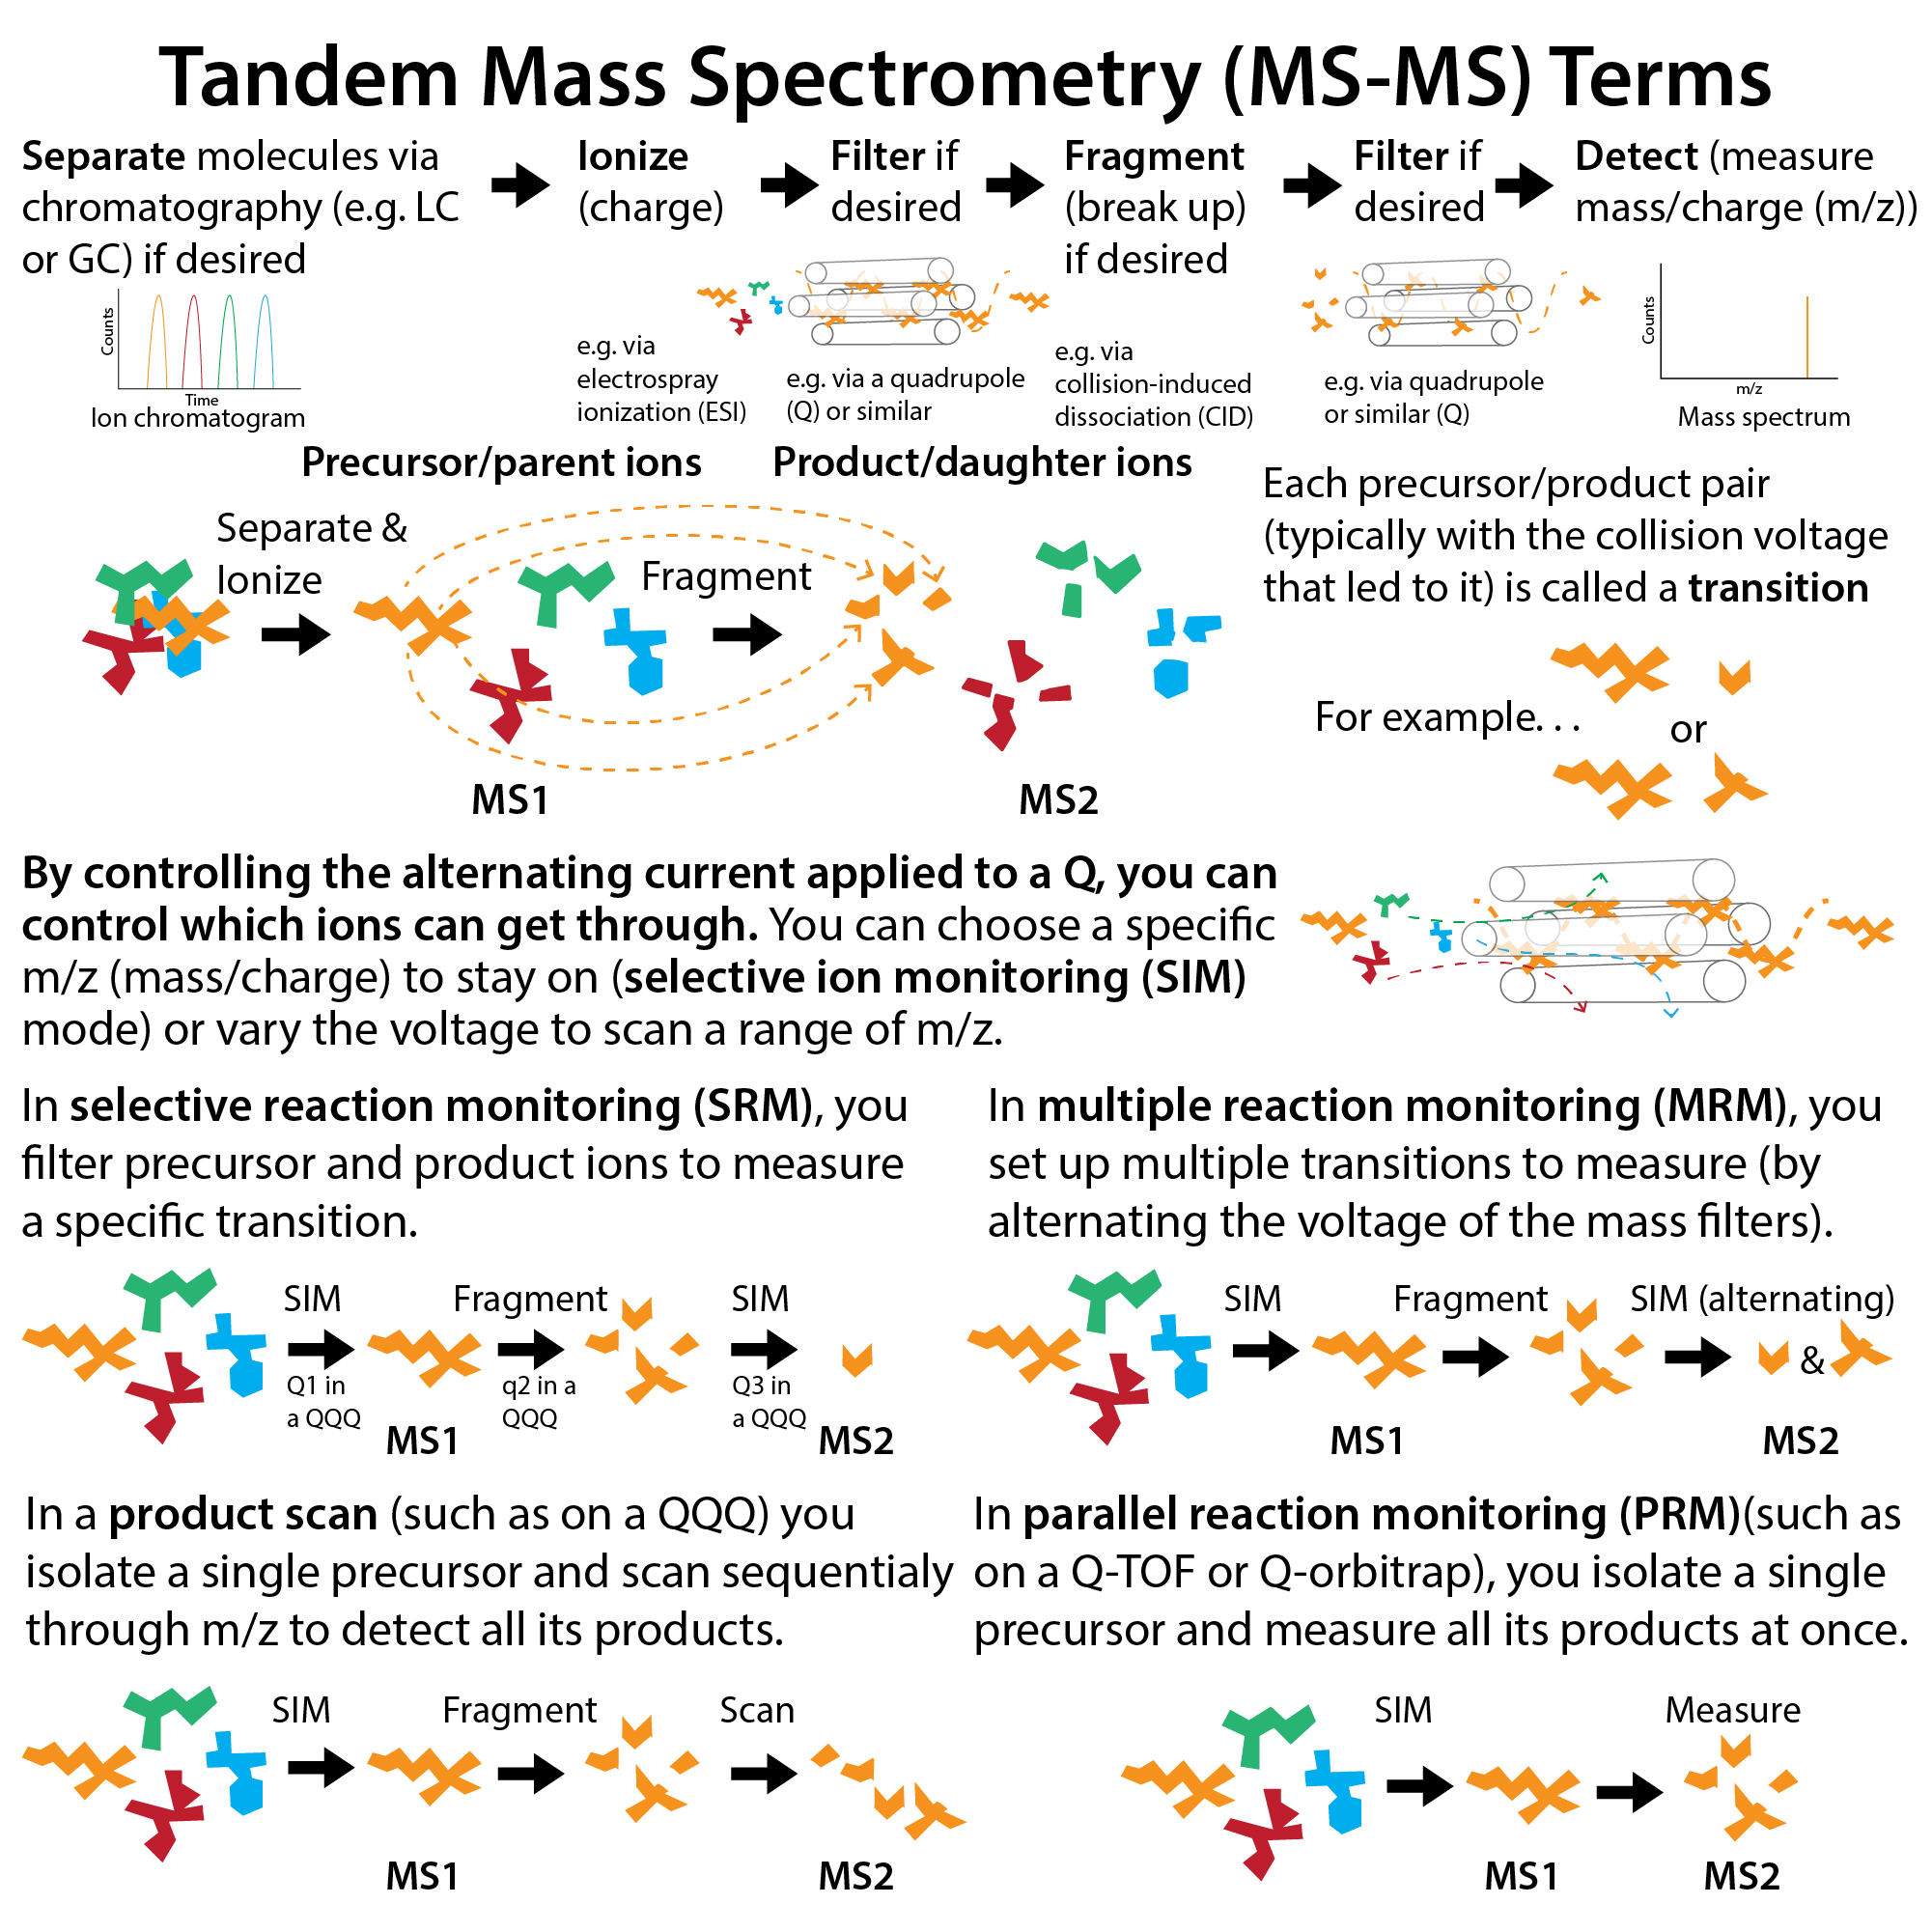
Tandem mass spectrometry (MS-MS), mass analyzers, etc.
MS/MS (Tandem MS) comes in many different flavors (e.g. the “triple quadrupole (QqQ), Q-orbit…
What is metabolomics?
What is metabolomics? My definition: Identifying, measuring and tracking the small biochemical inter…

Mass resolution and mass accuracy in mass spectrometry
When it comes to mass spectrometry, don’t confuse high resolution and accurate mass! Hi…
Retention Indexes
Pay attention to Retention (Time)! In GC-MS (gas chromatography-mass spectrometry) or LC-MS (liquid …
Chromatography-coupled mass spectrometry graph types, etc.
Chromatography-paired mass spectrometry typically uses mass spectrometry (MS), coupled to liquid chr…
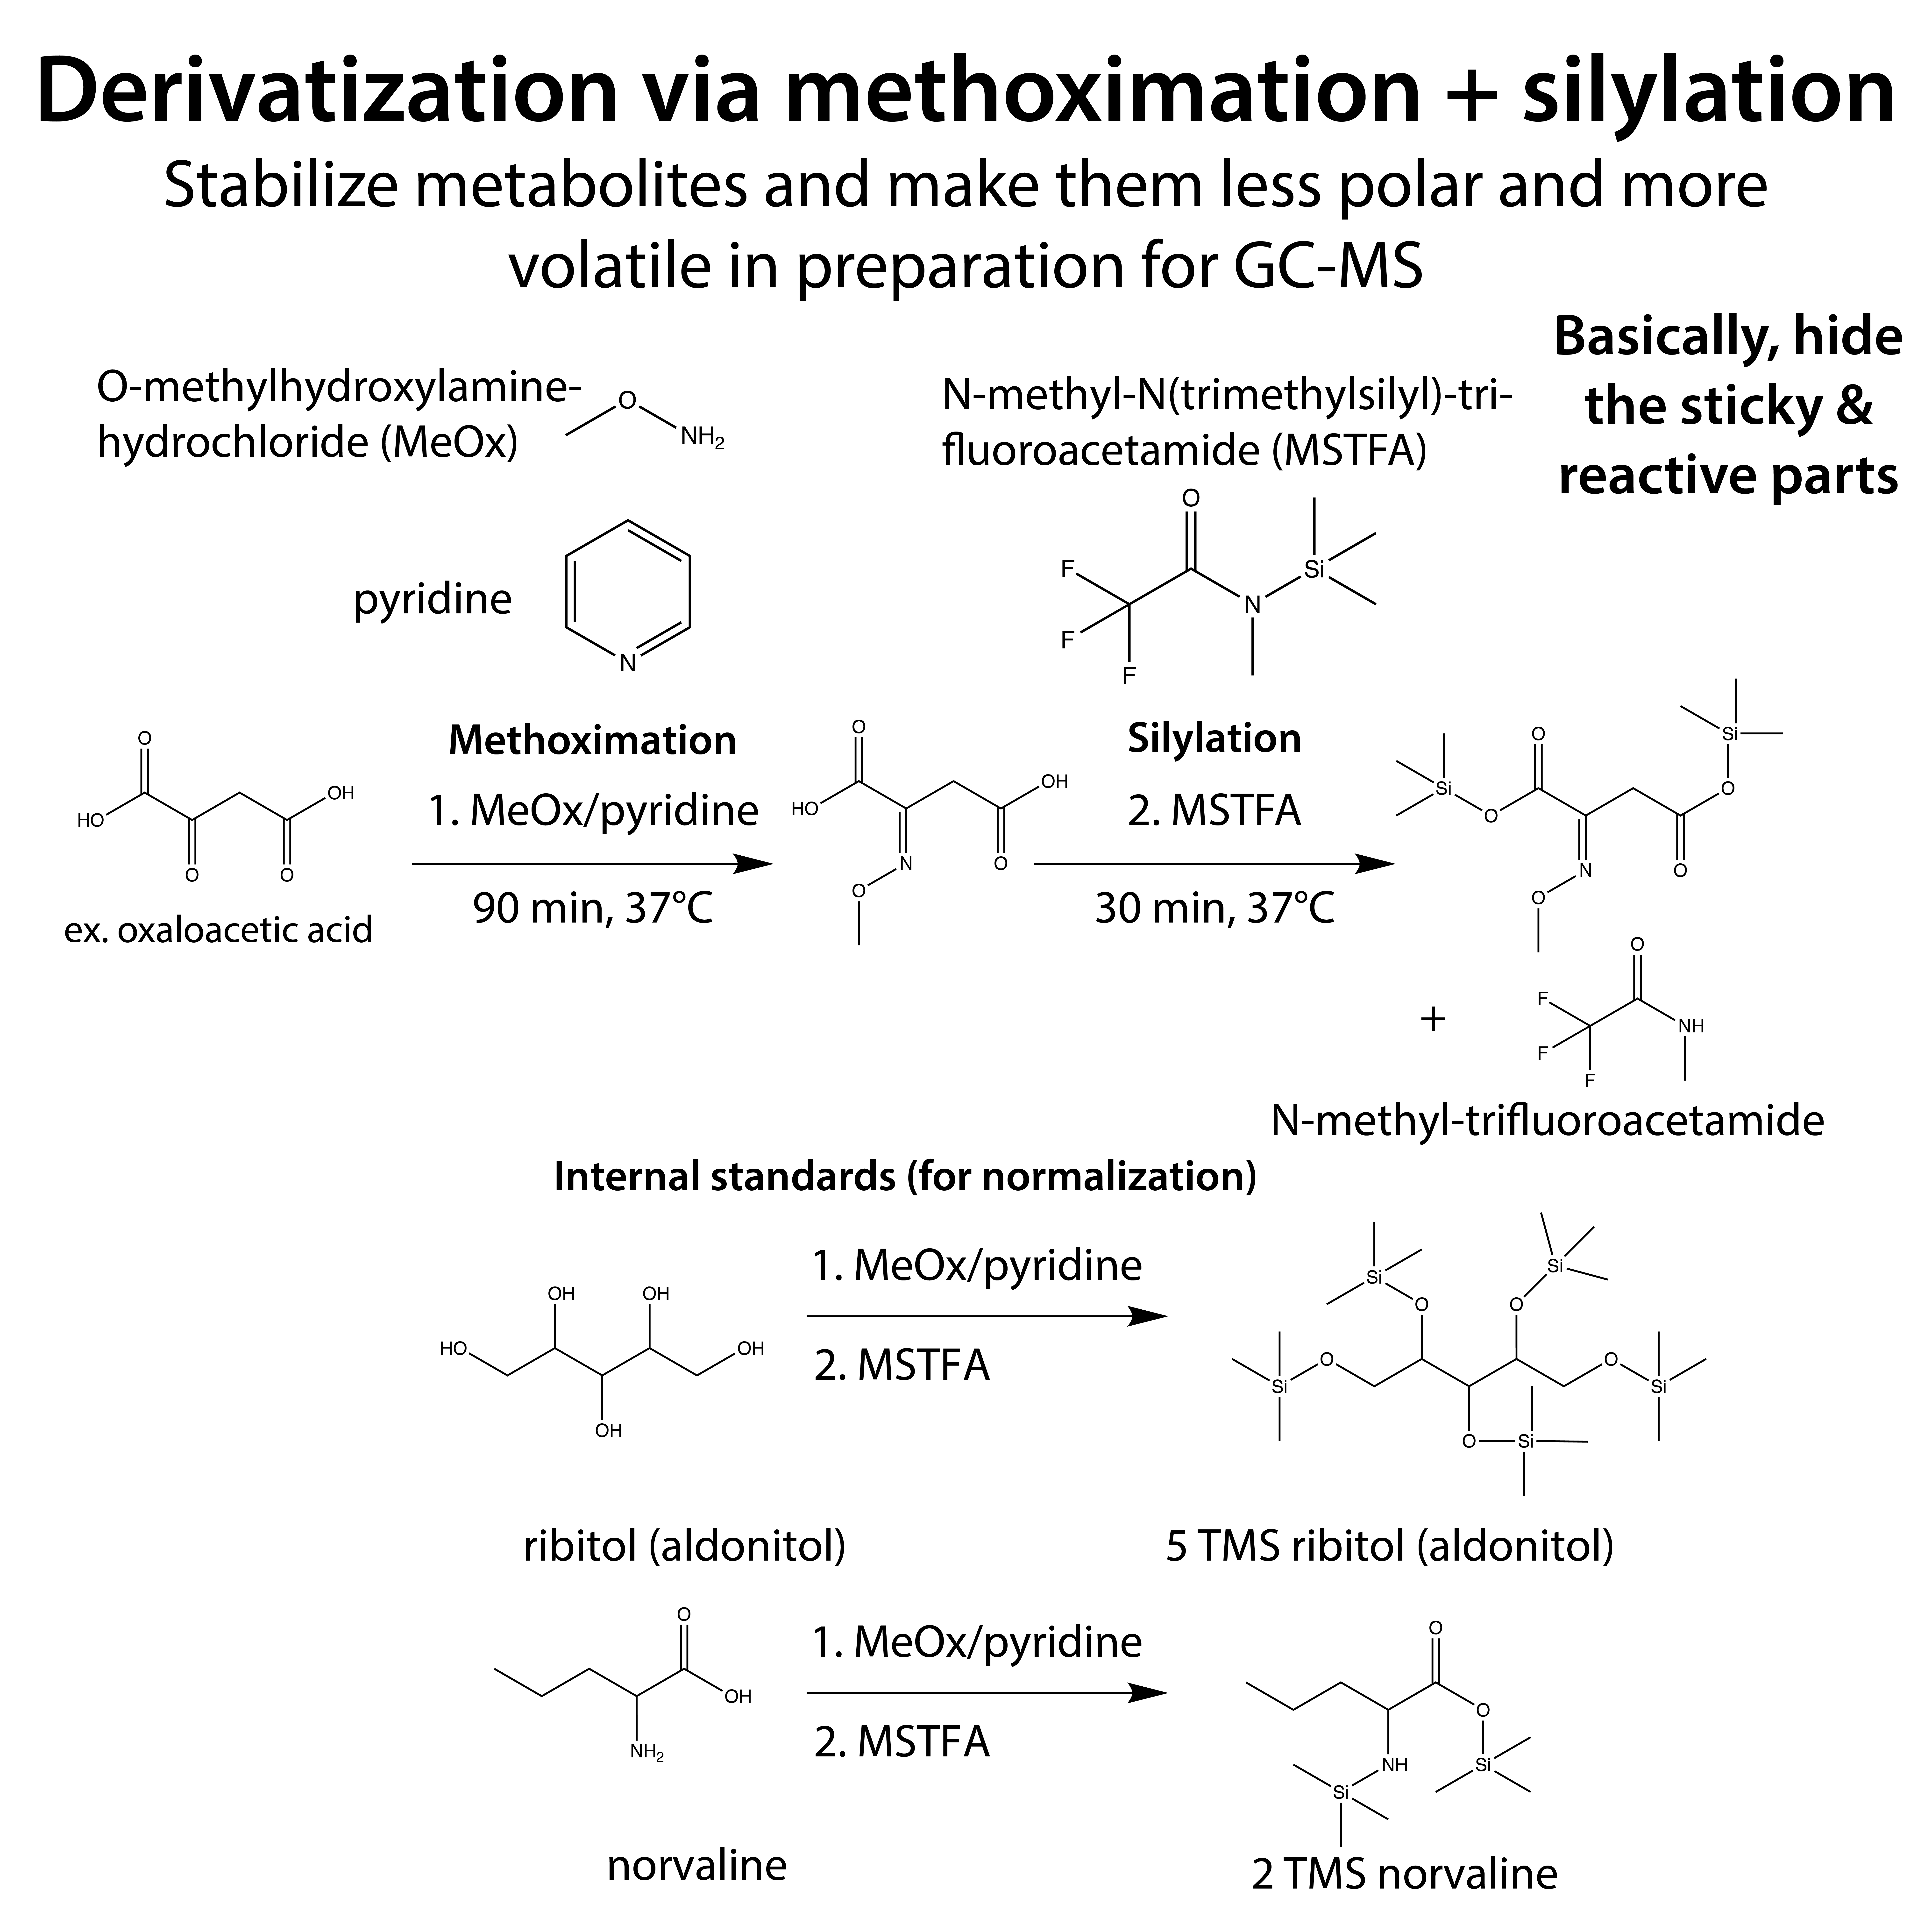
Derivatization of metabolites for GC-MS via methoximation+silylation
Silylation may sound silly to say, but if you want to make organic acids volatile for GC-MS, it give…