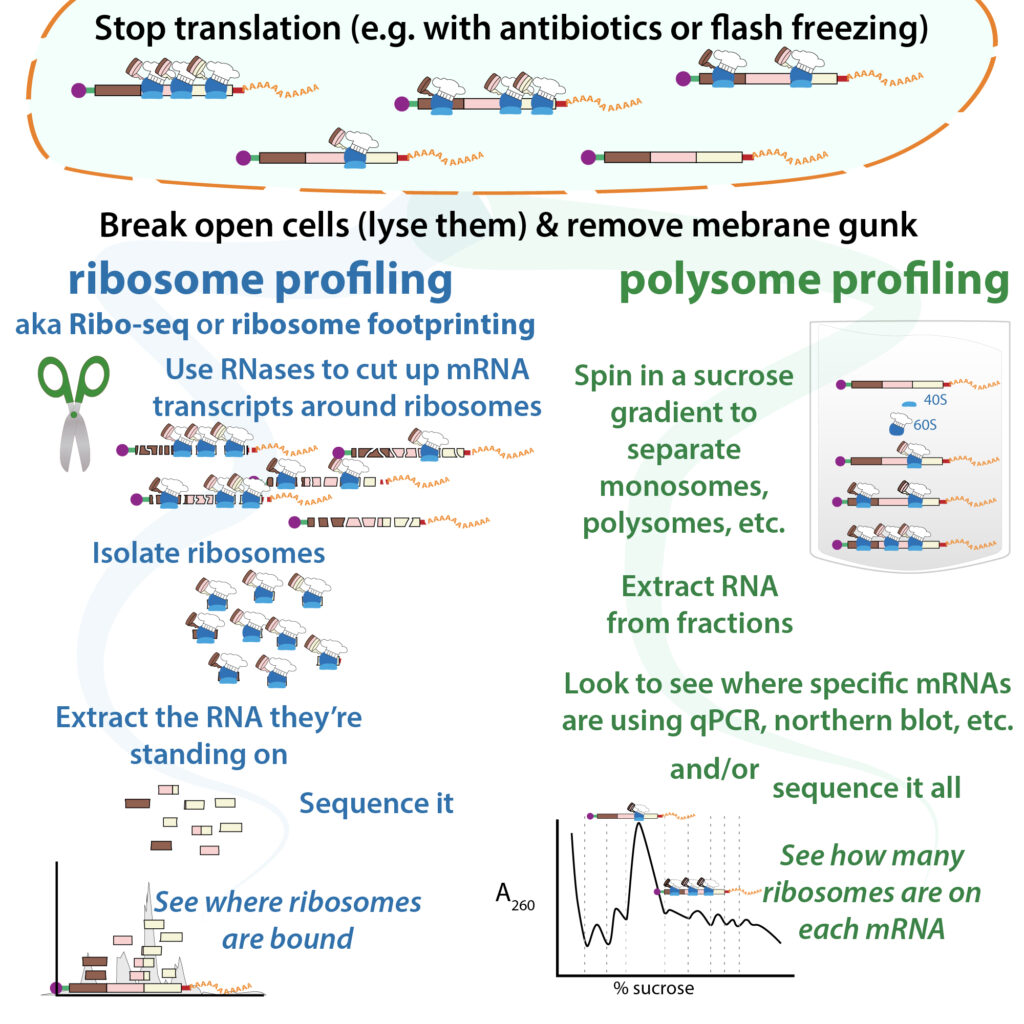
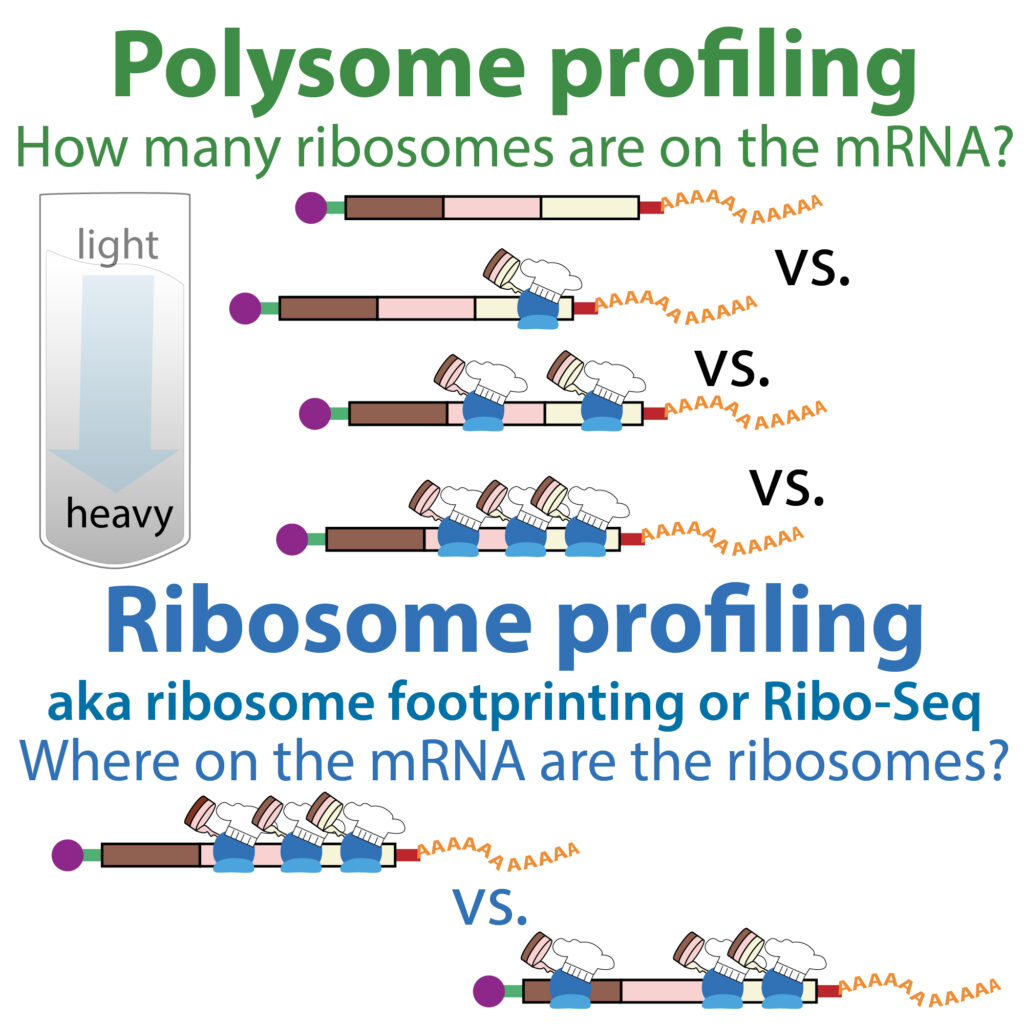
The biochemical equivalent of Disneyland trying to figure out how popular a ride is is scientists trying to figure out how popular an mRNA is in terms of being translated by ribosomes to make proteins – a couple of main ways they do this are ribosome profiling (aka ribosome footprinting or Ribo-Seq) and polysome profiling. Polysome profiling tells you how popular a ride is (how many ribosomes are on an mRNA) at different times/under different conditions and/or how popular it is compared to other rides. Ribosome footprinting, on the other hand, tells you *where* people are along the ride’s course (where on the mRNA the ribosome’s bound) & whether & where they’re getting stuck (eek!). Let’s take a closer look.
Let’s talk about POLYSOME PROFILING (a way to look at protein production) in terms of Disneyland trying to see how popular its different rides are. Instead of looking at how many people are on each ride, it looks at how many protein-making complexes called ribosomes are on each protein “recipe” copy (messenger RNA, mRNA).
blog form: https://bit.ly/polysomeprofiling & https://bit.ly/ribosomefootprinting ; YouTube: https://youtu.be/eclwa-gvWxw
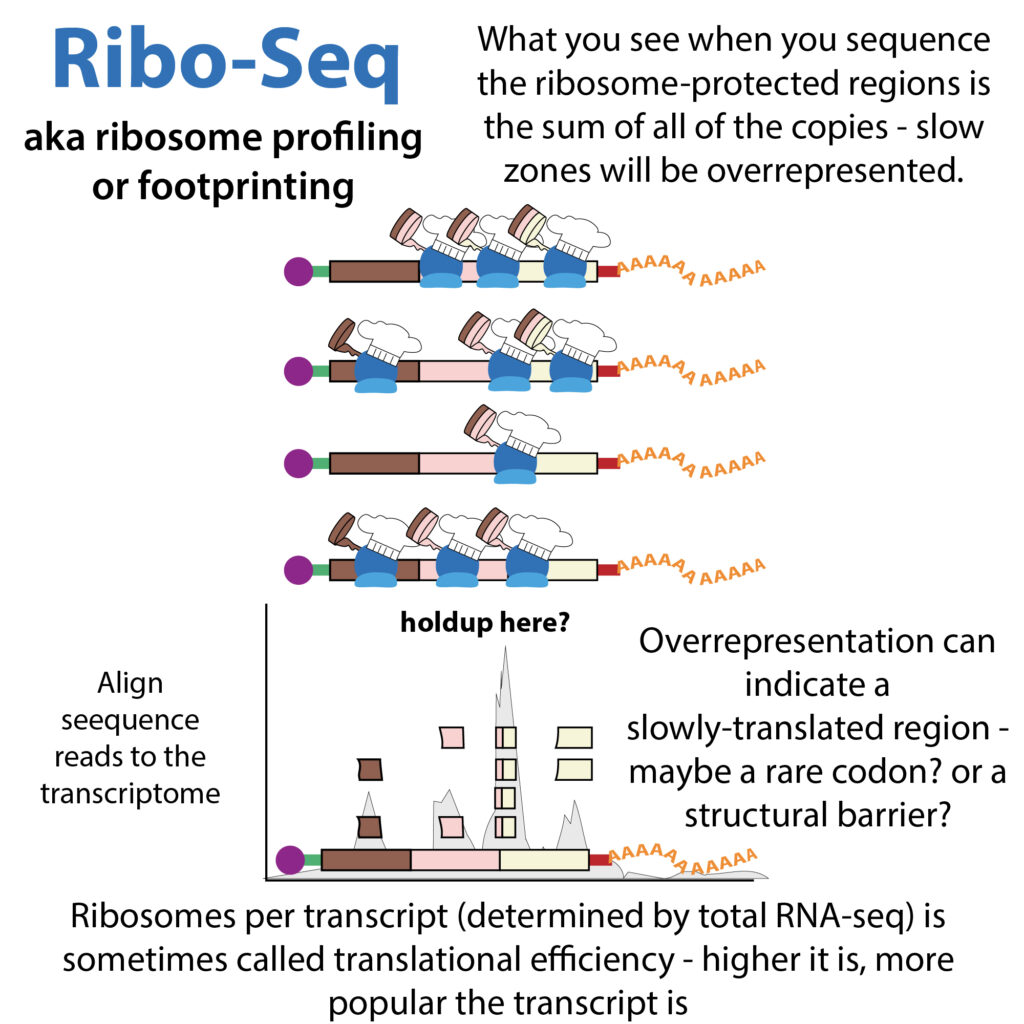
adapted from past posts – links to more provided … Imagine the “It’s a Small World” Disneyland ride. For those lucky ones who may not be familiar, it’s a ride where groups of people travel on boats on a river through a series of animatronic scenes depicting various places around the world with a super annoying song playing. You can think of the river as the mRNA and the boats are the ribosomes. And ribosome footprinting lets you see where along the river the boats are at a certain point in time. In this nightmare you don’t just have one of the rides. You have lots of copies of them. So, what this experiment shows you is the average of where the boats are in all those copy “rivers.” So you can’t tell if you have 3 boats on the same river or 2 on 1, and 1 on another, 1 each on 3 etc. And there are probably a lot more of these, because actively translating mRNA are usually associated with POLYSOMES, meaning that there are lots of individual ribosomes (MONOSOMES) on them.
Since you’re seeing the average, if there’s a slow region of the river, you’ll see a higher average occupancy, whereas if it’s smooth sailing all the way you’d see a more even spread.
How it works is you take cells (often cells in different conditions you want to see if are affecting things) then you add cyclohexamide – this shuts down the ride and then you look to see what RNA each ribosome hides! Cyclohexamide is a translation inhibitor, so the ribosomes get stuck and you can see where they get stuck. (though cyclohexamide can cause some artifacts so newer methods are avoiding it and instead using different chemicals or ditching the chemicals and just flash-freezing them).
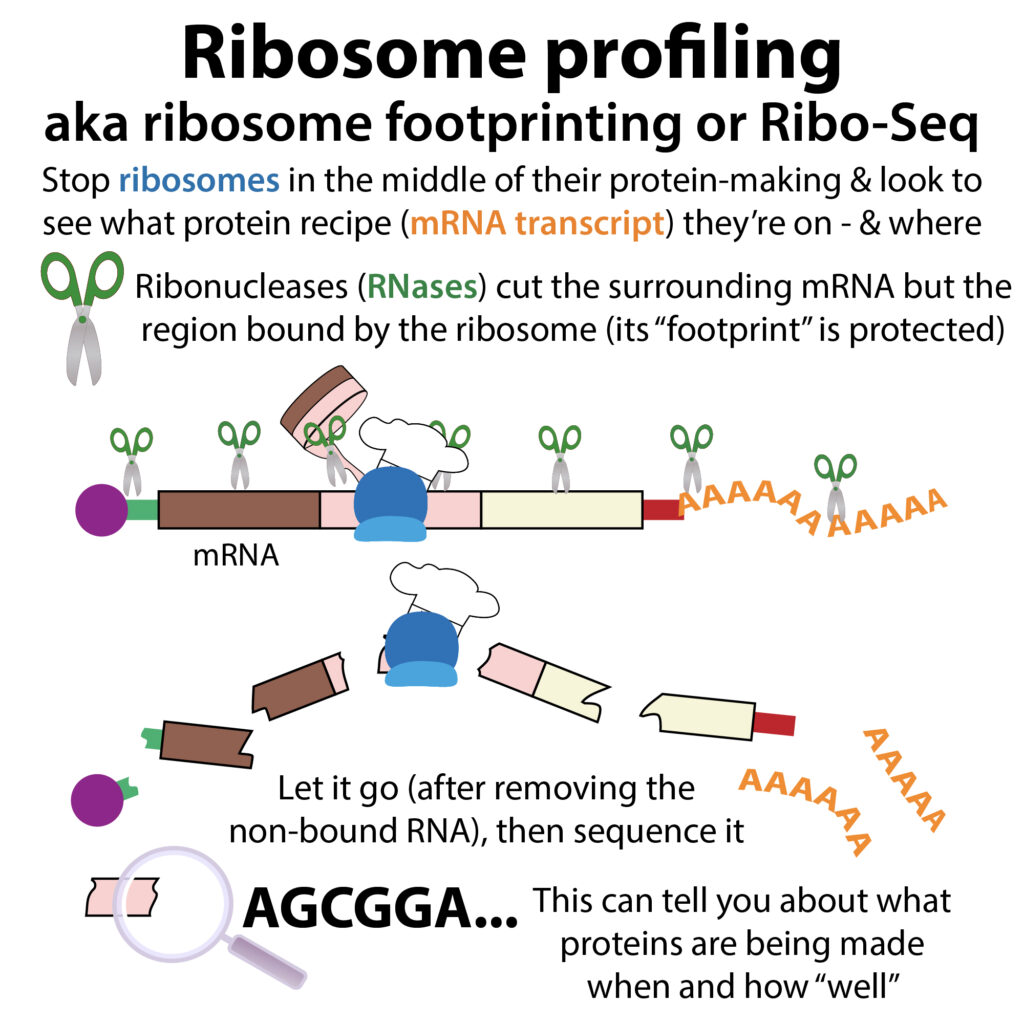
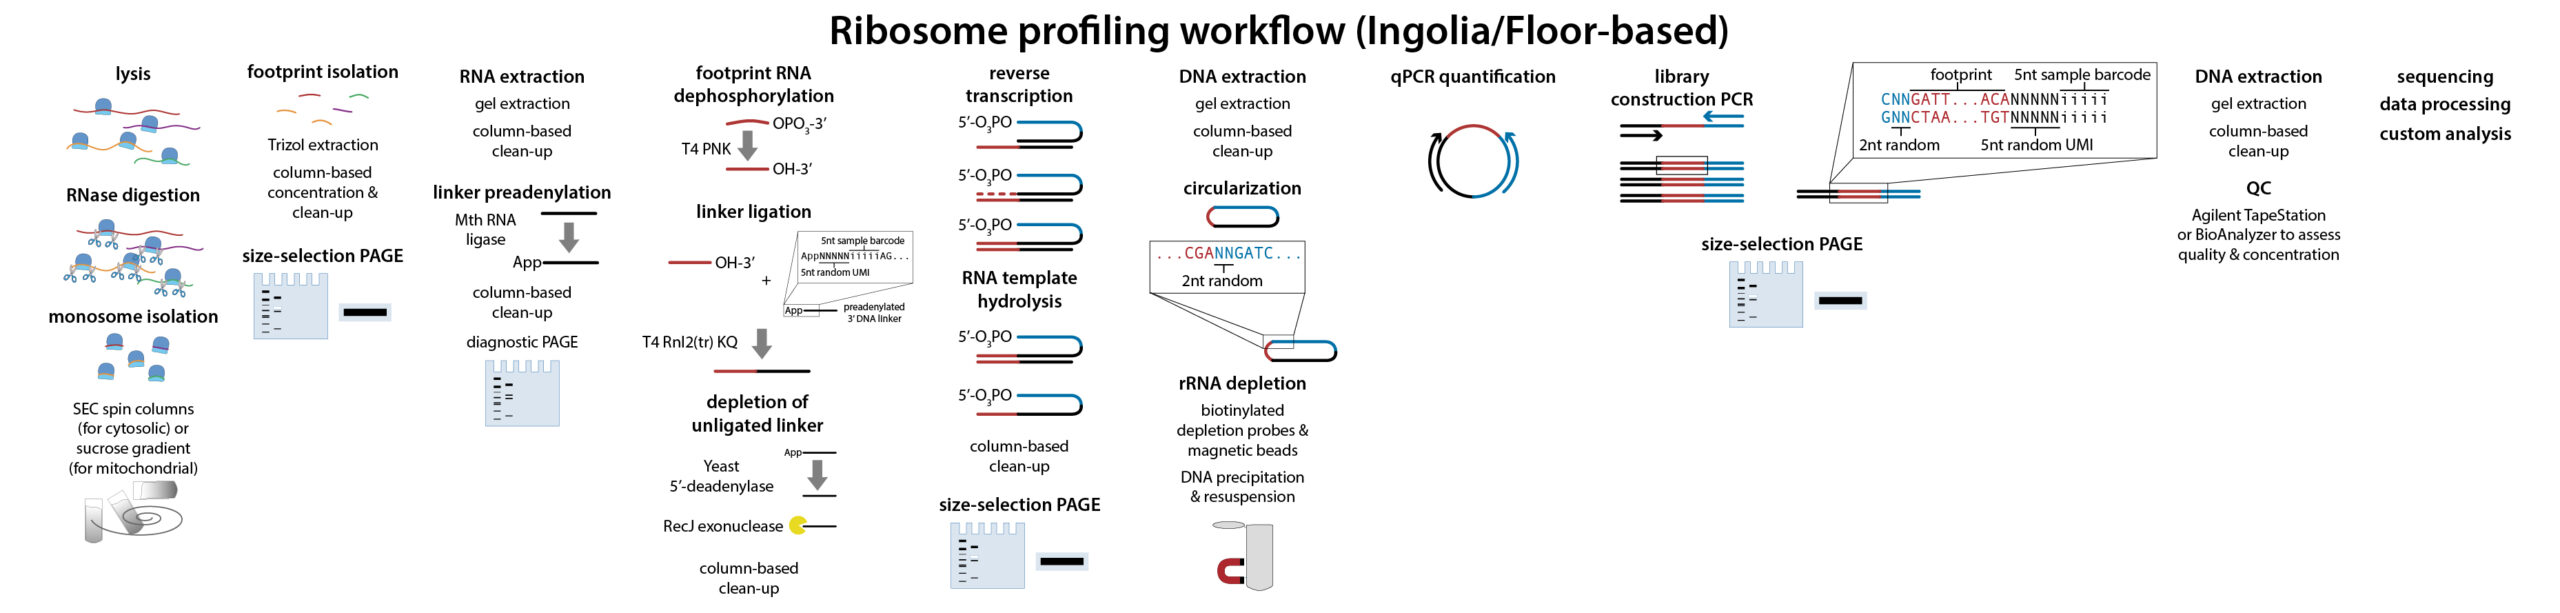
After stopping the ride, you want to separate all the ribosomes. And you want to just see exactly where they are, not just the “general vicinity” (you want GPS level, not “go till you see the tree and turn right then walk a few steps”) The ribosome protects the mRNA it’s bound to (~30nt), but not the surrounding mRNA. So you can introduce RNA “scissors” (nucleases) to cut up the mRNA. The mRNA not bound by ribosomes will get chewed up, but the mRNA the ribosome’s “sitting on” will stay safe. Then you can release these saved bound parts. And sequence them.
The cutting step is called an RNAse protection assay. RNAse Unlike the “restriction endonucleases” or “restriction enzymes” we often use to cut & past DNA together at precise sites, here we want promiscuous scissors so it will chew around all the ribosomes, not just ones that happen to be next to a “code word.” But not so promiscuous that they chew up the RNA part of the ribosome (proteins often get all the credit, but most of the grunt work of the ribosome actually comes from its ribosomal RNA (rRNA components).
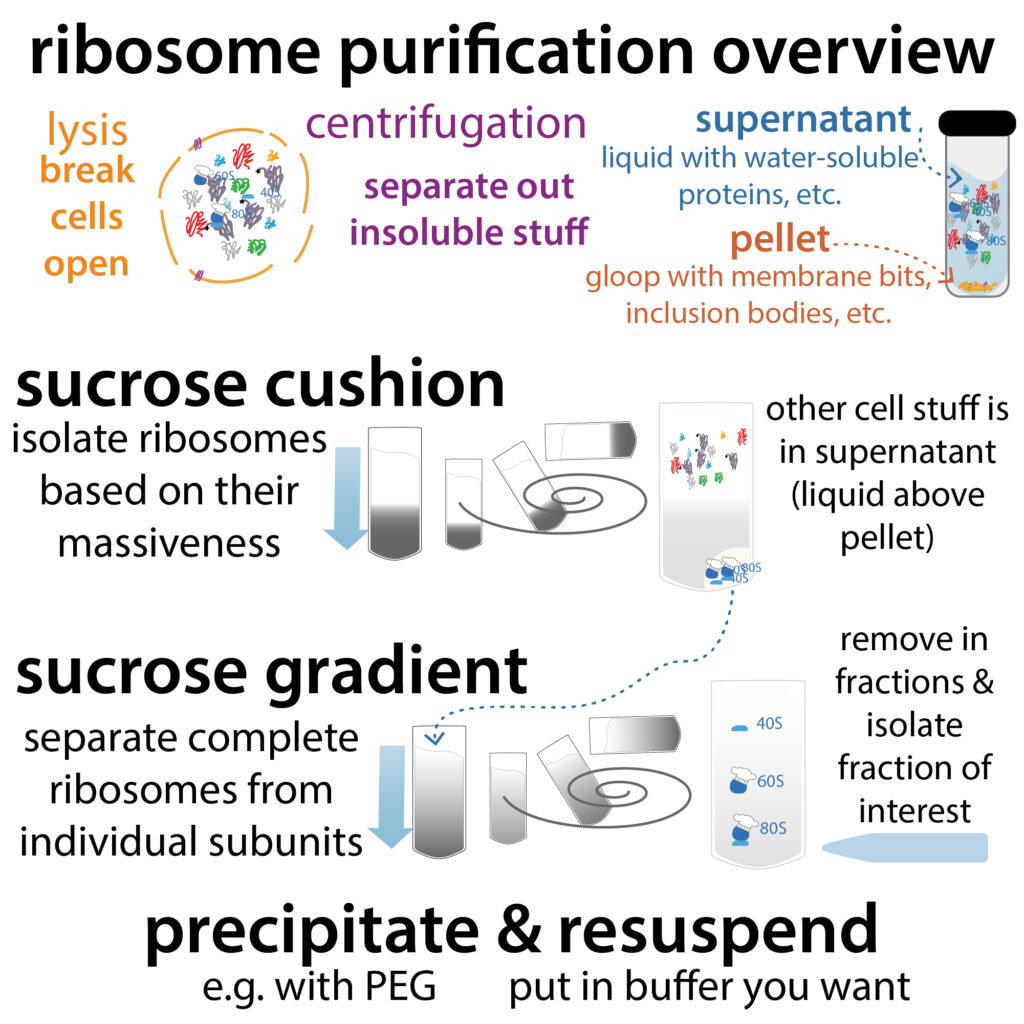
Before you do the sequencing, you need to isolate the ribosomes so that you’re only sequence the RNA that was actually being stood on, not the cut off pieces, nor pieces of RNA doing other things. This isolation can be done in several different ways including ultracentrifugation-based techniques where you basically spin the mixture in a dense sugar gradient to separate things by size or using purification columns that are coated with antibodies that bind to ribosomes but not other things.
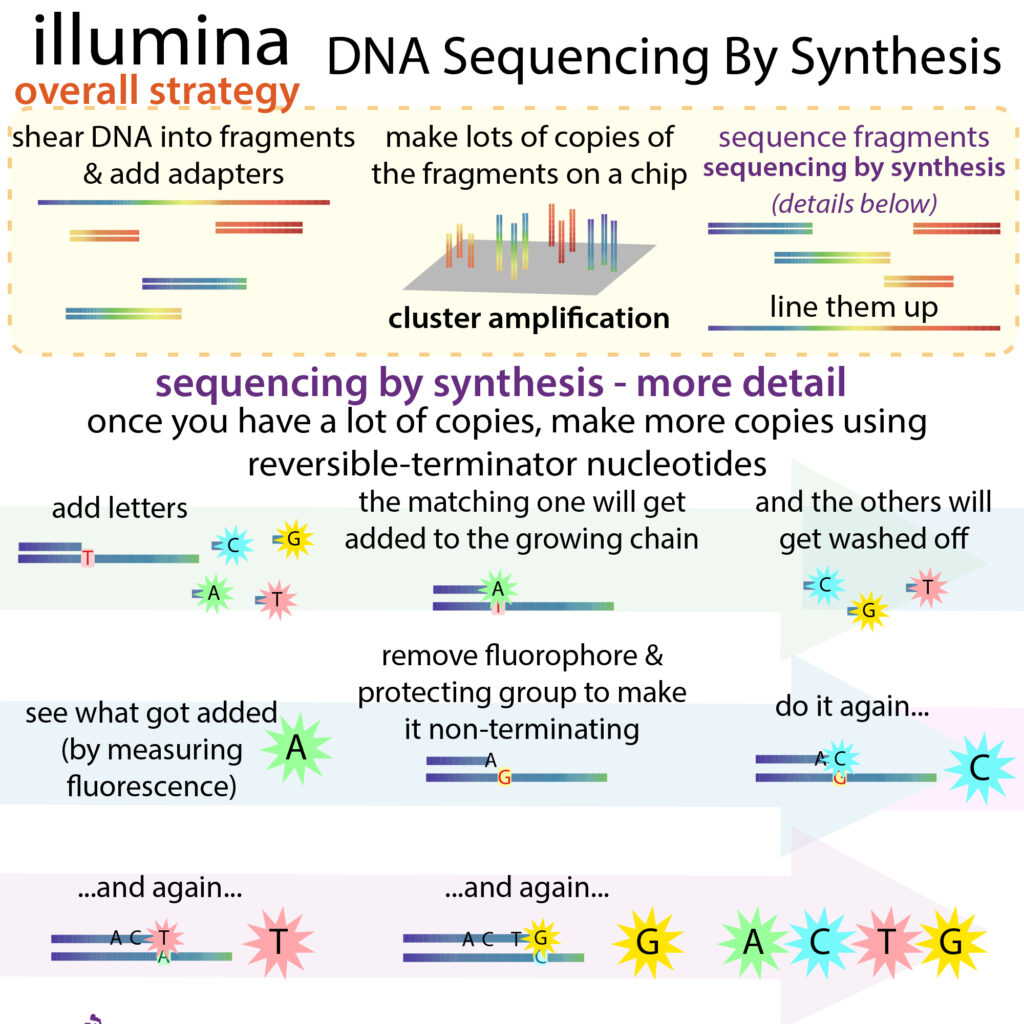
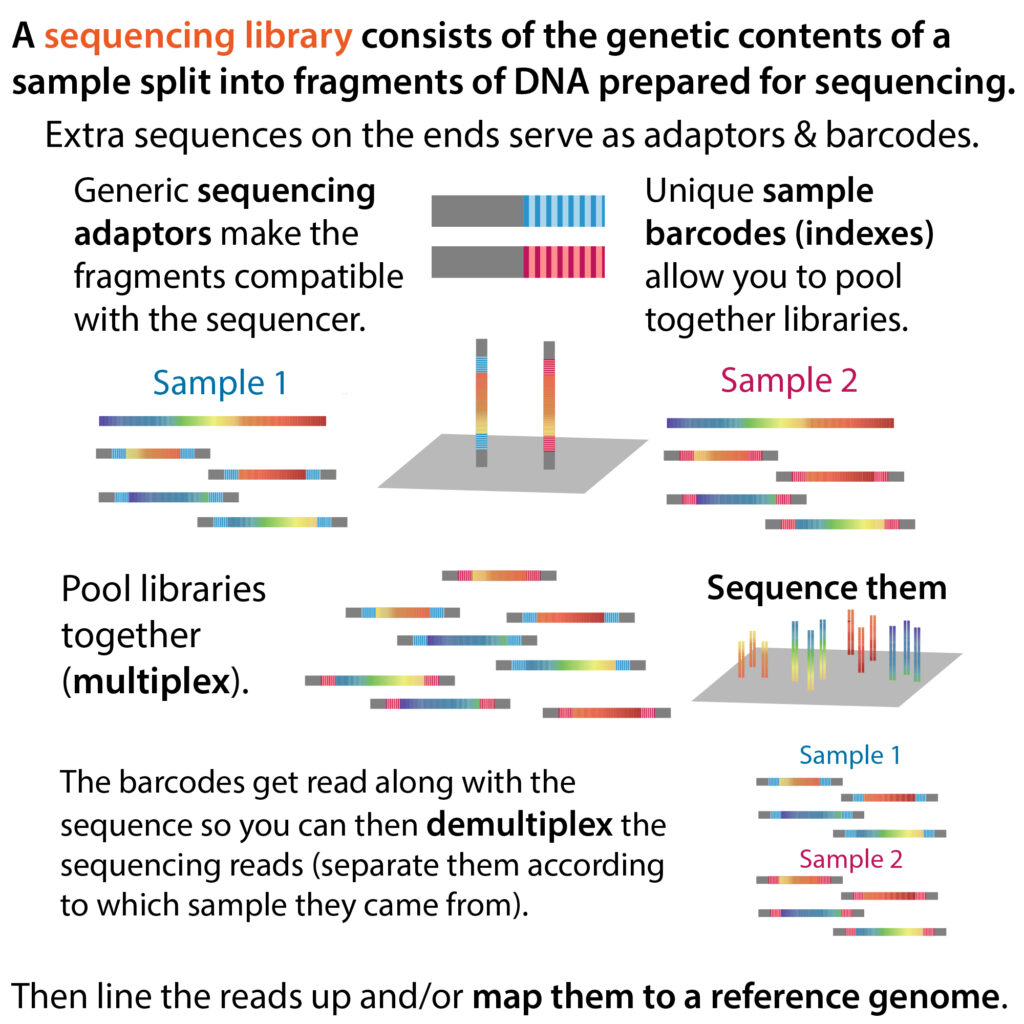
The sequencing part will tell you where the ribosome was standing – getting the sequences generally is done by first adding adapters to the little RNA pieces and reverse transcribing them into DNA, which is more stable and copy-able using PCR. These sequences are then fed into a computer program that aligns them to all the cell’s recipes to tell what specific protein recipes those sequences are part of. And not just which recipe, but WHERE on the recipe. If you see a bunch in the same part of a recipe, for example, it could indicate that translation is slow in that region (possibly due to something like a rare codon that there are fewer tRNAs for, so it takes longer for that tRNA to find its way there).
You can take “where” one step further with another “add-on” – initiation site profiling can be used to find the translation start sites (some mRNAs actually have several “alternative start sites”). This start-finding can be done using a drug called harringtonine, which only stops translation at the first step.
You can get even more information if, in addition to sequencing the footprints, you sequence ALL the mRNA – a process typically referred to as RNA-seq. This can tell you the relative abundance of each mRNA and you can then compare it to how many ribosomal footprints you got from that mRNA to get an idea of how “efficiently” that mRNA is being made. You need to know the total copies because if you find a bunch of bound ribosome-bound fragments from an mRNA that could represent a few, highly translated, mRNAs or lots of lowly translated mRNAs.
Going back to the It’s a Small World analogy, it’s kinda like the difference between having a ton of It’s a Small World rides but only a few boats are traveling each versus having a few of the rides but lots of boats on each. (This can also be distinguished using a technique called polysome profiling which looks at “boat abundance”)
When an mRNA becomes more popular, its RIBOSOME DENSITY (average # of ribosomes per mRNA for that gene) – (like average # of boats on each copy of the ride) increases. And so does the RIBOSOME OCCUPANCY – # of mRNAs of a gene bound by ribosomes (how many copies of the ride have boats on them). Note: Since different mRNAs are different lengths, and the longer the length, the more ribosomes can be bound at a time (but the longer it will take each to finish) you can take this into account – look at ribosomes per length unit when comparing
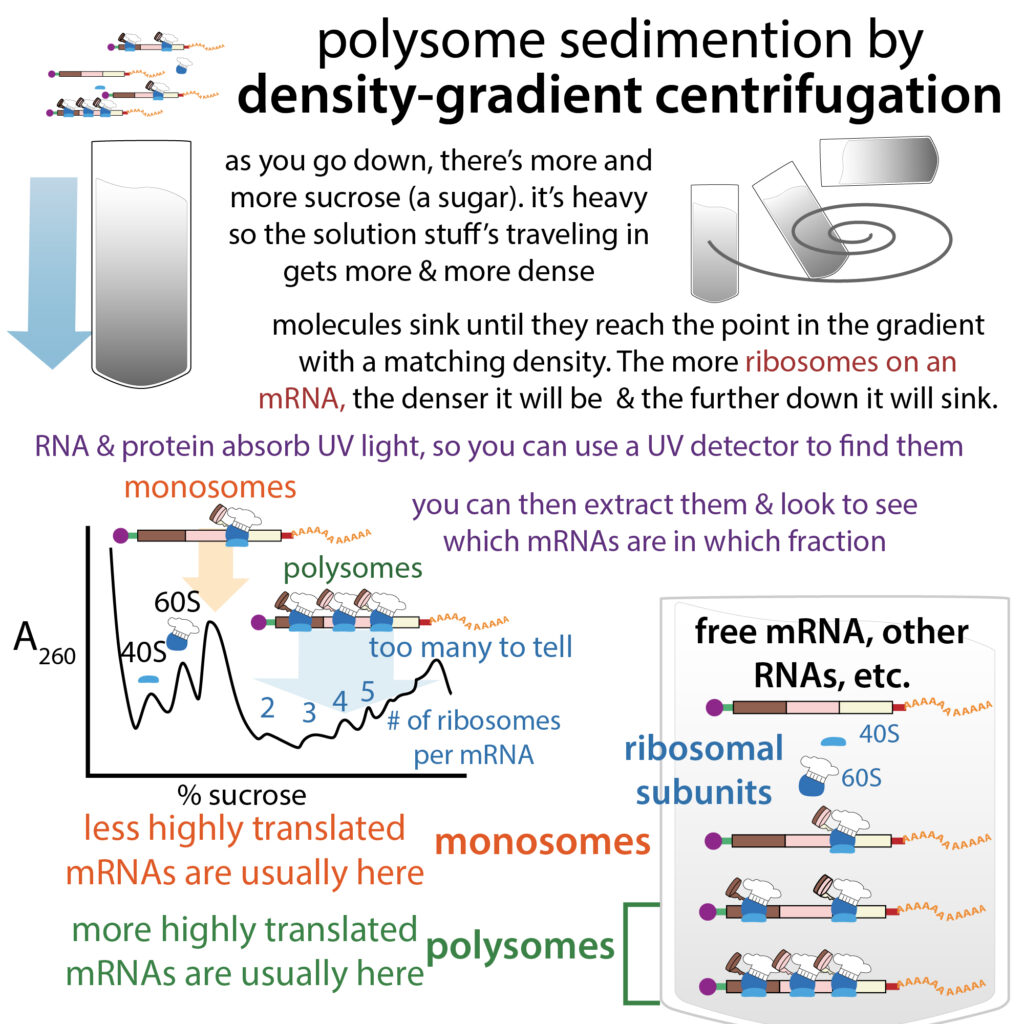
How can we tell? POLYSOME PROFILING. How does it work? POLYSOME PROFILING looks at whether mRNAs are associating with full ribosomes and how many. The ribosome has lots of parts, but it has 2 main “pre-fab” “halves” – a small subunit & a large subunit. It needs both to be functional. Because the halves aren’t really halves, we can tell them apart by their weight. We can’t just stick them on a scale – they’re super tiny and surrounded with other molecules. Instead, we can use centrifugal separation to separate them in a sugar gradient.
After freezing the ribosomes in place – often with a chemical called cycloheximide, which halts elongation, you break open the cells (lyse them), remove the insoluble membrane parts, and add the cellular insides (cytoplasmic fraction) to a tube filled with a sugar gradient. And then you spin it really fast. The bigger half is denser so it will “sink” further. Both together will sink even further, only stopping when they reach that point in the sugar gradient where the sugar is as dense as it is.
And a cool thing is that the halves are “glued together” by mRNA binding – they don’t normally associate. So an “intact” ribosome implies there’s a recipe poised to be baked. A single (mono) full ribosome on an mRNA is called a MONOSOME. But usually, active bakeries have lots of bakers – POLYSOMES are multiple (poly) ribosomes attached to a single mRNA. And they weigh even more than the monosomes. So they’ll sink further. (Yep, these are sinky boats….)
Proteins and RNA absorb UV light, so a UV detector can scan the gradient and absorption peaks tell you where “stuff” is – and there are characteristic places in the gradient you can expect to find monosomes, polysomes, etc. You can detect “global” differences if the ratios are skewed (for example, if “all” translation is inhibited, you’d expect to see an increase in monosomes and a decrease in polysomes).
But the UV can’t tell you what specific RNAs are are in those peaks, so you can take the “fractions” of the gradient (e.g. the monsoonal fraction & polynomial fractions) & look to see what’s where. First you have to get the gradient out – after centrifugation and separation of your monosomes, polysomes, etc., you use some way to push the gradient out from a hole in the top of the tube (old school style by injecting a higher concentration of sucrose through the side of the tube to build pressure from the bottom or with a fractionation with a piston that pushes down from the top to squeeze it up through a hole in the piston. And you can UV it on the way out as you direct it into fractions (kinda like with protein chromatography except you’re taking the column with you and doing it from the bottom).
To do that you have to extract the RNA out of the sugar (often by phenol-chloroform extraction). It’s often harder to extract the RNA out of the goopier stuff (higher density sucrose), so you’re likely to lose more. To control for this, you often add known quantities of a control mRNA, like luciferase mRNA, to each fraction before you start trying to extract the RNA. This way, you can measure how much luciferase was lost during the extraction in each fraction to normalize the fractions (adjust them so they can be directly compared to one another). This way, you don’t get fooled into thinking there’s more of an mRNA in the monosomal fraction just cuz you recovered that fraction’s RNA better.
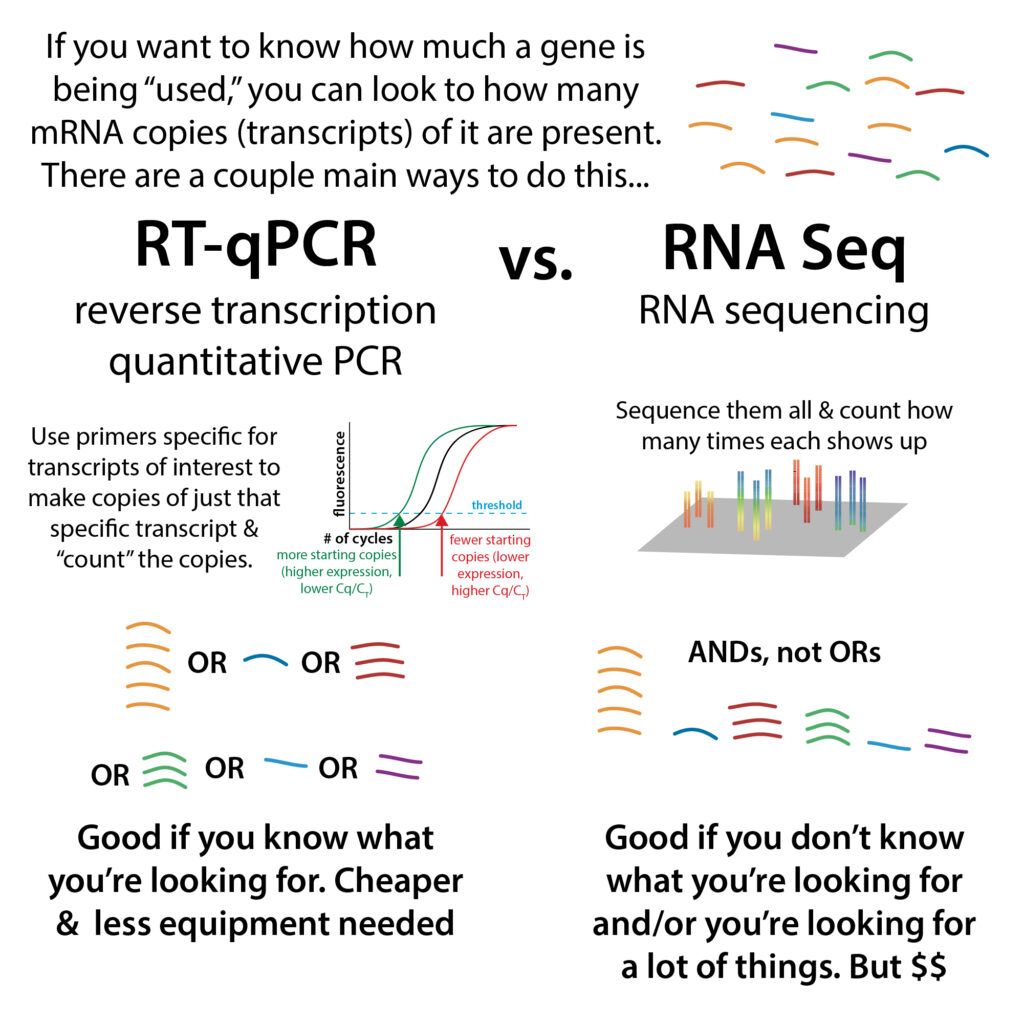
But how do you know what’s in what fraction? If you have one mRNA in particular you’re interested in, you can see where that recipe ended up in a couple ways. One is by doing a northern blot on the various fractions. A northern blot is where you use electrophoresis to run RNA through a gel mesh which separates the RNA pieces by size. And then you transfer those RNAs out of the gel and onto a membrane and use labeled probes complementary to RNA you’re looking for to see where that RNA is on the membrane. Alternatively, you can use RT-qPCR, which makes a bunch of copies of a region bookended by primers that you give it. So you can use primers specific to a gene of interest and see how many copies get made.
A northern blot or qPCR work well if you know what recipe you’re looking for, but they’re low-throughput and you have to know what to look for. With the rise of high-throughput RNA sequencing methods, it’s now become possible to sequence the RNA associated with the different fractions (e.g. monosomal fraction, polysomal fraction).
Most of the time, when people talk about mRNA-seq, they’re typically talking about sequencing “all” of the mRNAs without addressing whether the RNAs are actually being actively translated. The idea is that if you break open a cell and count the number of mRNA copies of a gene there are, if you see a lot of an mRNA, a lot of its protein is likely getting made – but that’s an assumption that’s not always true. It’s easier since you don’t have to go through all of this ribosome fractionation, and there’s less risk of losing some of the RNA in the process, but you don’t know if that mRNA is actually being used.
This is different from ribosome footprinting. Ribosome footprinting lets you see where along the river the boats are at a certain point in time. Instead of leaving the mRNAs intact, you use RNases (RNA chewers) to cut up the RNA around the bound ribosomes – the region the ribosome is standing on (~30 letters) is protecting from cutting, so then you can release this protected RNA and sequence it to see where the ribosomes were. Since ribosome footprinting chews around the ribosomes, it separates ribosomes that are on the same mRNA (but different locations on it) at the same time. So what you end up seeing is the average of where the boats are in all those copy “rivers.” So you can’t tell if you have 3 boats on the same river or 2 on 1, and 1 on another, 1 each on 3 etc.
But, in the case of polysome profiling, since you don’t mess with the mRNA neighboring ribosomes are on, you do separate “3 on 1” from “2 and 1” and “1 and 1 and 1.” (But once you pass 8 or so on one you can’t tell if there are more cuz they all come out in the same fraction). But you can’t see where on the strand they are – so you lose information about whether certain regions are translated more slowly than others (rare codons causing a holdup?) or whether alternative start sites are being used.
If you want to validate stall sequences, start sequences, etc. and/or determine what’s required for ribosomes to stall there, you can turn to ribosome toeprinting (aka primer extension inhibition).
blog form: https://bit.ly/toeprinting ; YouTube: https://youtu.be/CJhQNzHOhLY
Ribosome toe printing (aka primer extension inhibition) works by giving ribosomes in a cell-free translation system a template and using reverse transcription with a labeled primer that targets the 3’ end of that template. Let the reverse transcriptase do its thing and it will make a complementary DNA (cDNA) copy of the end of the template until it runs into the ribosome. Then purify those labeled cDNAs and run them alongside sequencing lanes that show you where A, C, T, & G are in the template (you can prepare these by reverse-transcribing the template and spiking in labeled dideoxynucleotide (dead end nucleotides) – 1 letter per reaction – this will cause there to be a range of cDNAs ending in the labeled letter, and you can compare them to your sample. You can do things like add ribosome inhibitors like cycloheximide (CHX) (at concentrations where they prevent elongation but not initiation) to get the ribosomes to build up at start sites so you can see them. And even without adding anything you can see if the ribosome is stalled places already.
Sometimes ribosomes stall because they’re translating awkward sequences like things with a bunch of prolines. And “programmed” stalling can actually be used by cells as a regulatory mechanism. Sometimes stalling is caused or relieved in the presence of various drugs or metabolites (small molecules that are part of metabolic pathways – so breakdown or build-up products). This stalling often occurs in upstream open reading frames (uORFs) and regulates expression of the main ORF (which has the protein making instructions). A cool example of this is some bacteria making an antibiotic resistance gene, ermC in response to the presence of the corresponding antibiotic, erythromycin. More on that here:
Vazquez-Laslop N, Thum C, Mankin AS. Molecular mechanism of drug-dependent ribosome stalling. Mol Cell. 2008 Apr 25;30(2):190-202. https://doi.org/10.1016/j.molcel.2008.02.026
Here’s a paper about a different technique, inverse toeprinting, which goes at things from the 5’ end with sequencing so you can vary the template randomly to see what sequences might cause a stall, and then see what caused that stall.
High-throughput inverse toeprinting. Britta Seip, Guénaël Sacheau, Denis Dupuy, C Axel Innis. Life Science Alliance Oct 2018, 1 (5) e201800148; DOI: 10.26508/lsa.201800148 https://www.life-science-alliance.org/content/1/5/e201800148
more on ribosomes: https://bit.ly/rad_ribosomes
more on my postdoc work with mitochondrial ribosome profiling: https://bit.ly/postdocprerprint
Context-specific inhibition of mitochondrial ribosomes by phenicol and oxazolidinone antibiotics, Brianna Bibel, Tushar Raskar, Mary Couvillion, Muhoon Lee, Jordan I Kleinman, Nono Takeuchi-Tomita, L. Stirling Churchman, James S Fraser, Danica Galonic Fujimori, bioRxiv 2024.08.21.609012; doi: https://doi.org/10.1101/2024.08.21.609012