When it comes to mass spectrometry, don’t confuse high resolution and accurate mass! High resolution is basically having sharp spectral peaks, allowing you to see isotopic distributions (helpful for both IDing and tracking molecules) and accurate mass is when those peaks are super close to their true masses (helpful for determining empirical formulas and IDing molecules). Also, be careful discussing “accurate mass” as it’s often used synonymously with “exact mass,” but they’re not the same. Accurate mass refers to a mass that is accurately measured and therefore matches the exact mass (the “true” value, out to lots of decimal places). Accurate mass is typically measured with a high resolution mass spec (HRMS) (e.g. orbitrap, TOF, FT-ICR), but it can (theoretically at least) be gotten from a low res (LRMS) instrument (e.g. single or triple quadrupole (Q or QqQ)(typically just for protein stuff though). Conversely, a high res instrument that’s not calibrated correctly, etc. could give you an inaccurate mass. Oy vey… Let’s dive in!
Mass resolution is basically how sharp your spectral peaks are. Unlike in structural biology, higher numbers correspond to higher resolution (sharper peaks).
Mass resolution is often calculated using the formula: (m/z)/FWHM == (m/z)/(w1/2) == (m/z)/half-height
FWHM, aka w1/2, or is “half-height” is Full Width-Half Maximum height. It’s 1/2 the width at the base of a peak. The sharper the peak, the smaller the FWMH, and thus the higher the resolution.
For reference, common mass resolutions are in the following ballparks:
- FT-ICR-MS: ~1,000,000
- Orbitrap: ~100,000
- TOF: ~10,000-60,000
- Quadrupole: ~1,000
https://fiehnlab.ucdavis.edu/projects/seven-golden-rules/mass-resolution

When peaks are sharp enough, you can tell apart isotopic peaks that would otherwise be merged into a single peak on a lower-res instrument. These isotopic peaks come from the ion having different numbers of the naturally-abundant (or labelly-introduced) isotopes for the atoms it contains.
For example, most (~98.90% of naturally-occurring carbon atoms are 12C (they have 6 protons and 6 neutrons). But ~1.1% of C’s have an “extra” neutron and are thus 13C. So, if an ion contains one of those, or an 2H instead of a 1H, or a 15N instead of a 14N, it’ll have an increase of ~1 in its m/z (assuming a +1 or -1 charged ion). If it has 2, it’ll have an m/z increase of 2, etc). Typically, these are labeled as M+1, M+2, etc. where M represents the “monoisotopic ion” (one made up of the most abundant isotope of each ion and thus the most probabilistically likely). On graphs, the peak for the monoisotopic ion is typically set to 100% relative abundance, and other ions are compared to it.
But it’s not *exactly* 1 that’s added. And, if instead it had an H2 (deuterium) instead of the usual 1H (protium), it would have about (but not exactly) 1 added. And the amount added would be different than the amount added for a “heavy” carbon. Same with 15N (as opposed to 14N). (This is something called the mass defect I will return to later). At high enough res, you’ll see that the M+1 “peak” is actually multiple peaks, coming from the contributions of different isotopes. (This is referred to as fine isotopic structure, or IFS.)
Why does this matter? For one thing, it can help with ID-ing an unknown (because it can allow you to tell apart isobaric compounds that have the same nominal mass, but different exact masses. It can’t however distinguish structural isomers, which have the same exact masses–chromatographic separation (if possible) is needed there!) Additionally, it allows you to track multiple isotopic labels at once. For example, you could label glucose with 13C (i.e. feed cells or an animal glucose with all its carbons being “heavy”) and glutamine with 15N, track them both, and tease apart contributions of carbohydrate and amino acid metabolism.
For reference, here are natural isotopic distributions of common elements in biomolecules:
- 12C: 98.90%
- 13C: 1.10%
- 1H (protium): 99.9885%
- 2H (deuterium): 0.0115%
- 14N: 99.60%
- 15N: 0.40%
- 16O: 99.757%
- 18O: 0.205%
These can be used to predict the spectral pattern for different ions and compare the measured signal to that predicted. One way this is reported is pattern coverage (%), which summed intensity of matching isotope peaks in measured MS1 spectrum vs summed intensity of theoretical isotope pattern for a given empirical formula.
You might sometimes see the acronym HRAM (high resolution accurate mass). That’s what you really want. Because High Resolution is only one part of the picture. Imagine you beautifully map out the relative positions of each item in a house only to realize that the GPS coordinates of the house itself are wrong. Or you weigh out a bunch of items only to realize you forgot to tare your scale (zero it out to account for the weight of your weigh boat, etc.). Your numbers wouldn’t be accurate.
In mass spec, mass accuracy is measured in ppm and defined as:
(true mass – measured mass)/true mass x 10^6 ppm
So, small number is good.
Accuracy on HRMS is usually <3 ppm (often <1 ppm!). For low res, it’s more in the 5-10 ppm range.
https://www.spectroscopyonline.com/view/role-spectral-accuracy-mass-spectrometry
To understand the value of accurate mass measurement, we need to go back to the mass defect . . . The monoisotopic mass comes from adding up the exact masses of each atom of a molecule, assuming that all the atoms are made up of the most abundant isotope (so, this is the most probabilistically likely makeup). Something called the nominal mass is similar, but it uses masses rounded to whole integers (e.g. 1 instead of 1.007825 for 1H and 14 instead of 14.003074 for 14N). The differences between these exact and nominal masses is the mass defect.
The mass itself comes from the makeup of its atoms’ subatomic particles: protons and neutrons (which each on their own have a mass ~1 amu) and electrons (which are really light but still have a mass (~0.00055 amu). We often simplify things by thinking of the mass of electrons being negligible and a proton or a neutron always being exactly 1. Therefore, if we sum up a molecule’s # of protons and neutrons (assuming the most common isotope of each element) we get the nominal mass.
We have to be less lazy to calculate exact mass. . . Now, not only do we have to take into account the fact that the contributions of each subatomic particle are not whole numbers, but we also have to take into account the fact that their masses are different for different atoms! The mass defect comes from differences in nuclear binding energy (which comes from the combination of the strong “nuclear force” attracting protons (+) and electrons (-) and the weaker coulombic repulsion from the protons repulsing one another). Thinking back to Einstein’s E = mc^2, when subatomic particles form a stable nucleus, they release energy, and thus a bit of mass. How much, depends on how much energy is released, which depends on the makeup of the atom.
For example:
- 12C: 12.00000 amu
- 13C:13.00335 amu
- 1H: 1.00782 amu
- 2H: 2.01410 amu
- 14N: 14.00307 amu
- 15N: 15.00011 amu
- 16O: 5.99491 amu
- 17O: 116.99913 amu
Molecules with different empirical formulas (# of each element) will always have different exact masses (though not necessarily different nominal masses). If a mass is measured accurately, therefore you can determine an empirical formula. If not, you may not be able to.
But that’s a big if! In addition to having a high-res instrument (typically), you need to make sure it’s calibrated correctly. Mass specs typically have calibration mixes containing “standards” of known m/z that are run weekly or so. Additionally, some use “lock masses” to adjust on-the-fly based on expected masses of things like polysiloxanes from laboratory air.
Things get a lot more technical and complicated, so here are some resources if you want to go deeper:
Beginner’s Guide to Mass Spectrometry | Waters. https://www.waters.com/nextgen/us/en/education/primers/the-mass-spectrometry-primer.html.
Kuehl, D.; Wang, Y. The Role of Spectral Accuracy in Mass Spectrometry. 2007, 0.
Workman, J. Advancements and Emerging Techniques in Mass Spectrometry: A Comprehensive Review. 2024, 22–27.
*Going back to isobaric compounds, here’s a bit more: isobars are non-identical molecules with the same nominal (basically ”rounded”) masses– differences can be in connectivity (structural/constitutional isomers) or 3D arrangement (stereoisomers), or differences in atomic composition.
Isobaric compounds to watch out for (credit CSHL metabolomics course):
- Alanine, beta-alanine, & sarcosine
- Dihydroxyacetone phosphate & glyceraldehyde 3-phosphate (note: DHAP is more stable)
- Glucose, fructose, galactose, mannose, myo-lnositol and a few more hexoses
- Many pentoses
- Many di- and tri-saccharides
- Citrate & isocitrate
- Leucine & isoleucine
- Valine & isovaline
- Hydroxybutyric acid (alpha, beta, gamma)
If isobars have the same empirical formula (atomic composition), you typically rely on chromatography (e.g. LC or GC) to distinguish (if even possible!). If different empirical formulas (e.g. CO and N₂ ions) or differences in isotopic composition (e.g. a 13C vs a 15N), you can tell apart with high resolution mass spec which can measure accurate exact mass (out do decimal places), and thus take advantage of “mass defect” – the difference between the mass of protons of different elements due to nuclear binding energy (more below).
Don’t confuse “isobars” with “isotopologues” or “isotopomers/” Isotopologues are molecules that differ only in number of neutrons (e.g. singly-labeled vs. doubly-13C-labeled glucose). Mass spec can easily tell them apart. Isotopomers, in contrast, are molecules with the same “everything” (thus including mass) except the location of an isotope (e.g. a labeled atom) (e.g. 13C-1-glucose vs. 13C-2-glucose). Mass Spec (even HRMS) can’t tell apart without fragmentation (and even then, relies on the “break” being in an informative location, separating the isotopically labeled piece from the rest.)
More here:
Volmer, D.; Leslie, A. Dealing With the Masses: A Tutorial on Accurate Masses, Mass 32 Uncertainties, and Mass Defects. 2007, 22. https://www.spectroscopyonline.com/view/dealing-masses-tutorial-accurate-masses-mass-32-uncertainties-and-mass-defects
Habler, K.; Rexhaj, A.; Adling-Ehrhardt, M.; Vogeser, M. Understanding Isotopes, Isomers, and Isobars in Mass Spectrometry. Journal of Mass Spectrometry and Advances in the Clinical Lab 2024, 33, 49–54. https://doi.org/10.1016/j.jmsacl.2024.08.002.
All this being said, although you basically really need high-res if you’re dealing with untargeted metabolomics (trying to ID everything you can, even things that aren’t in the library you have), low-res is fine for many targeted applications, when taken in conjunction with chromatographic data (e.g. retention time), which adds a different type of resolution and fragmentation, which aids in IDing based on the different pieces that come from different molecules getting broken up.
So, although the single-quad GCMS machines I use and love are definitely low-res, they’re high value for me and allow me to identify the central metabolites I’m interested in. For a lot less $ and maintenance!
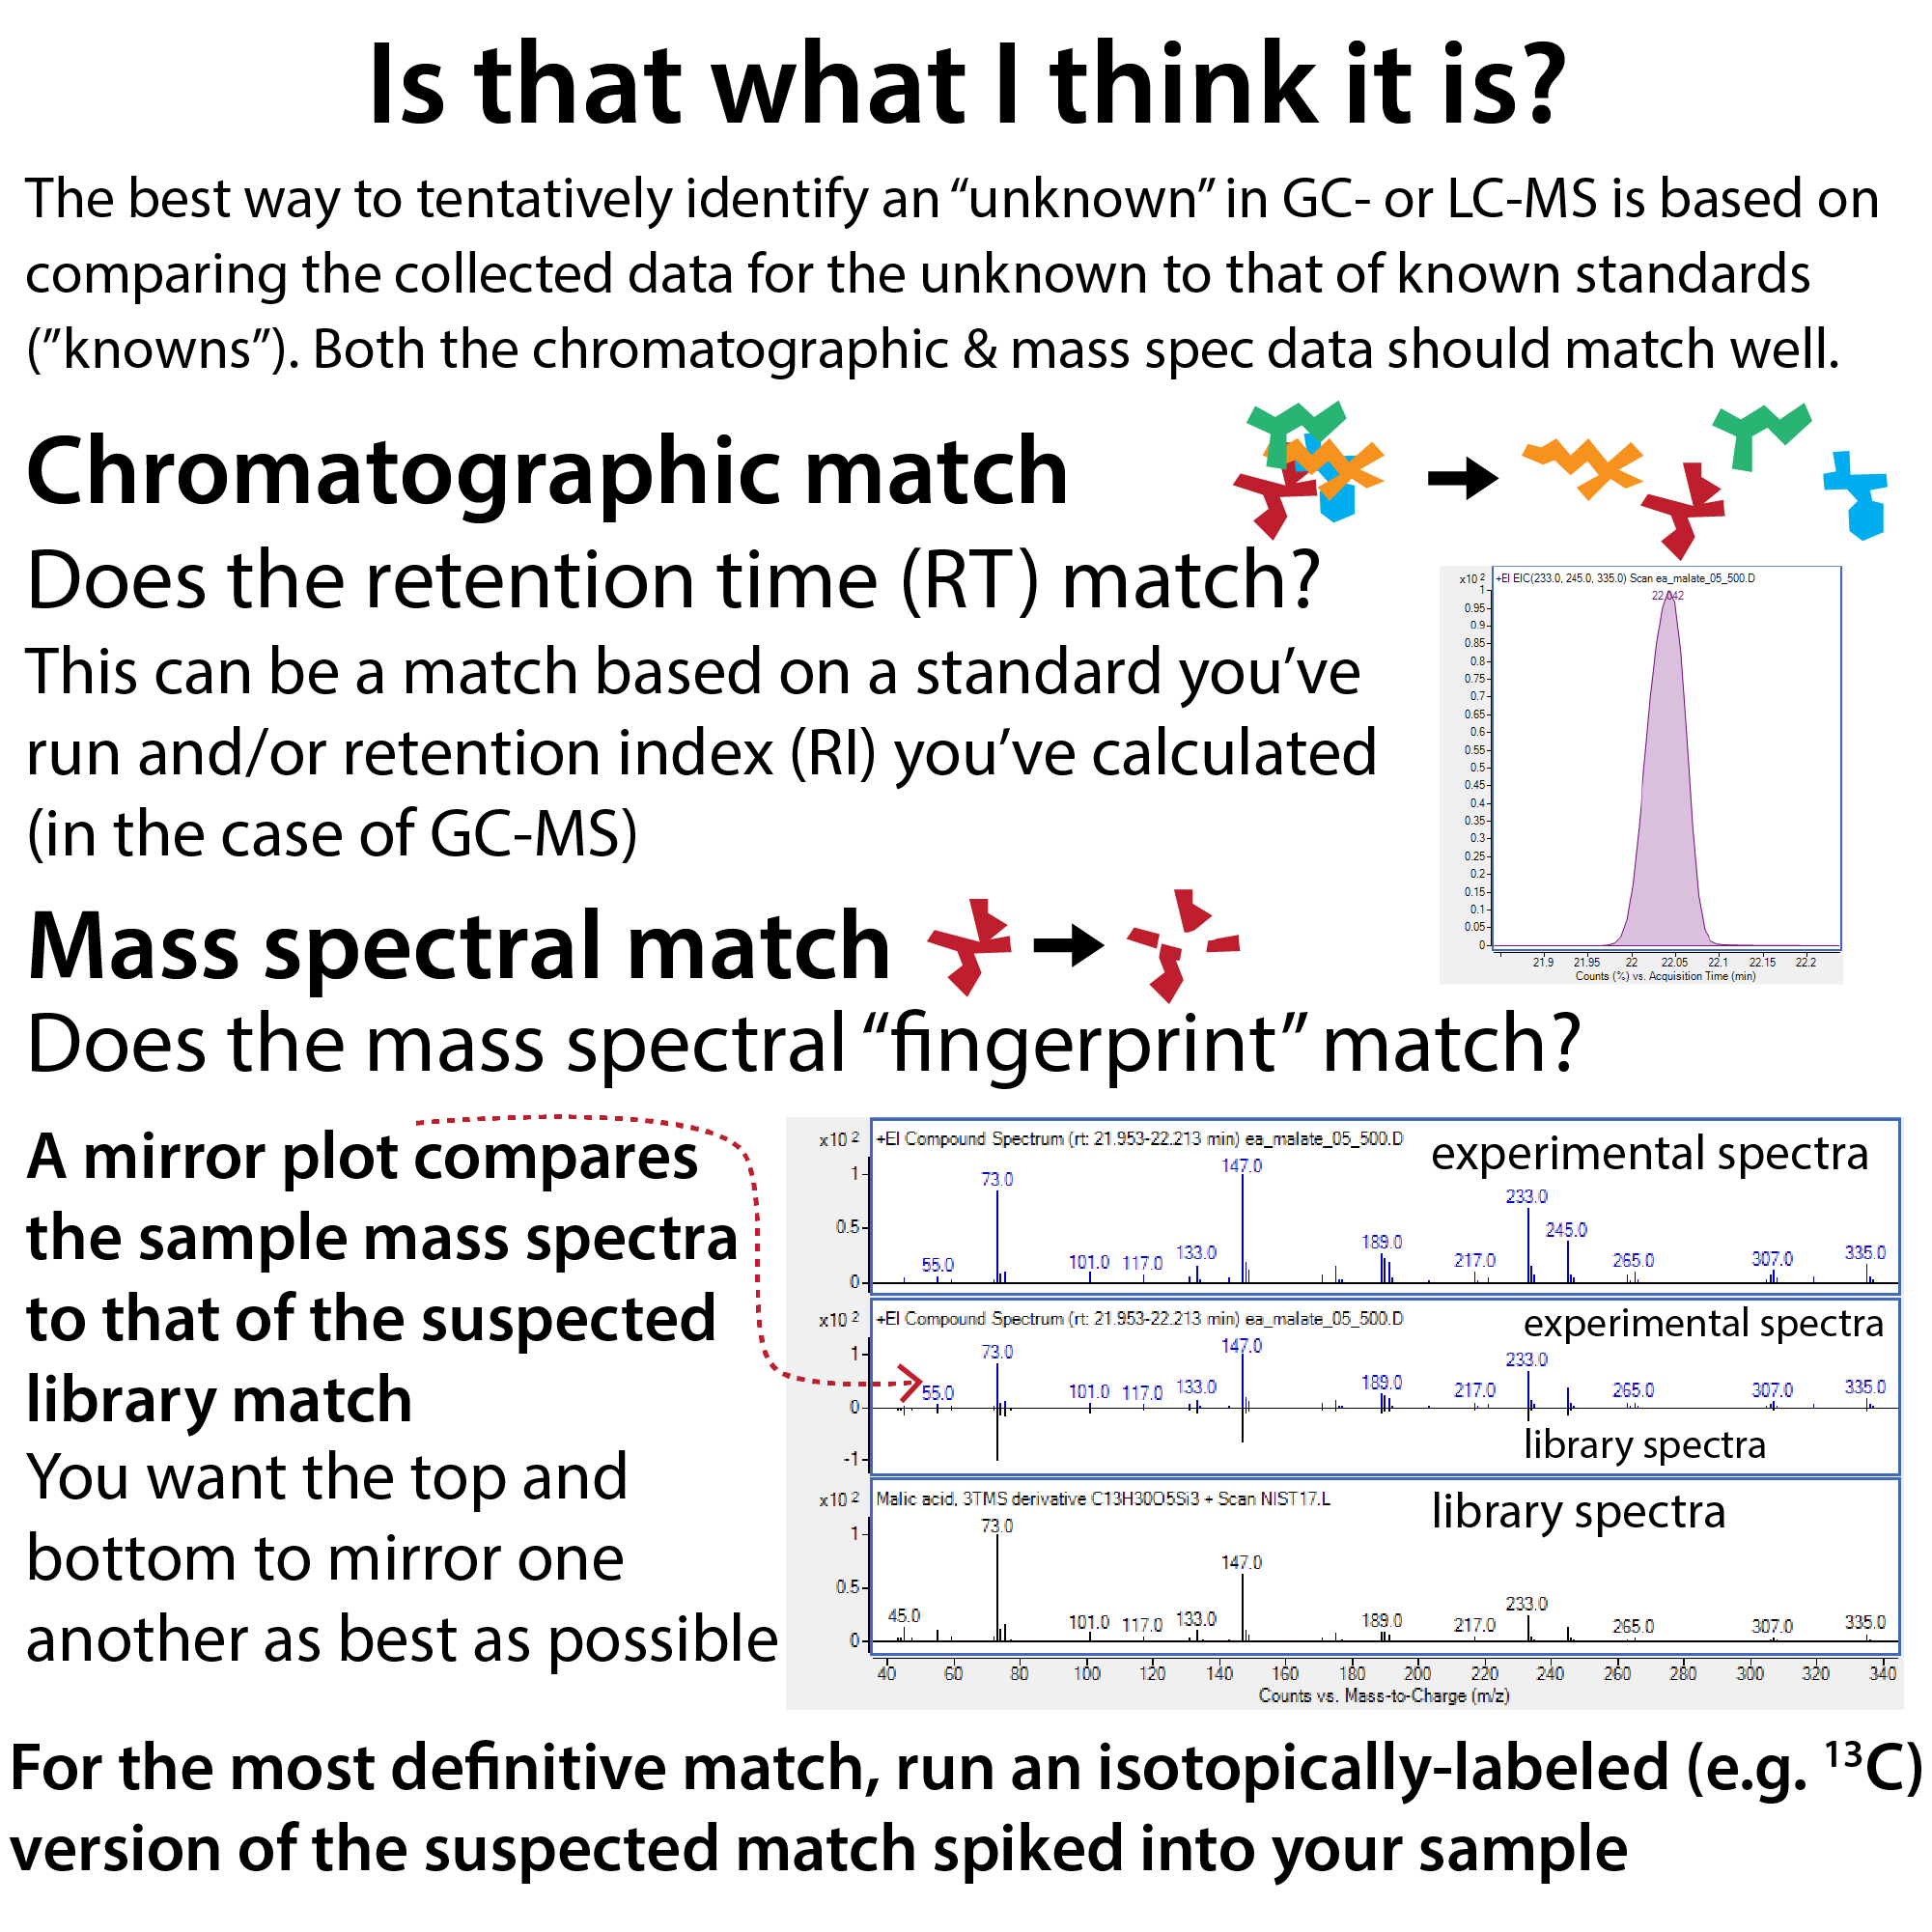
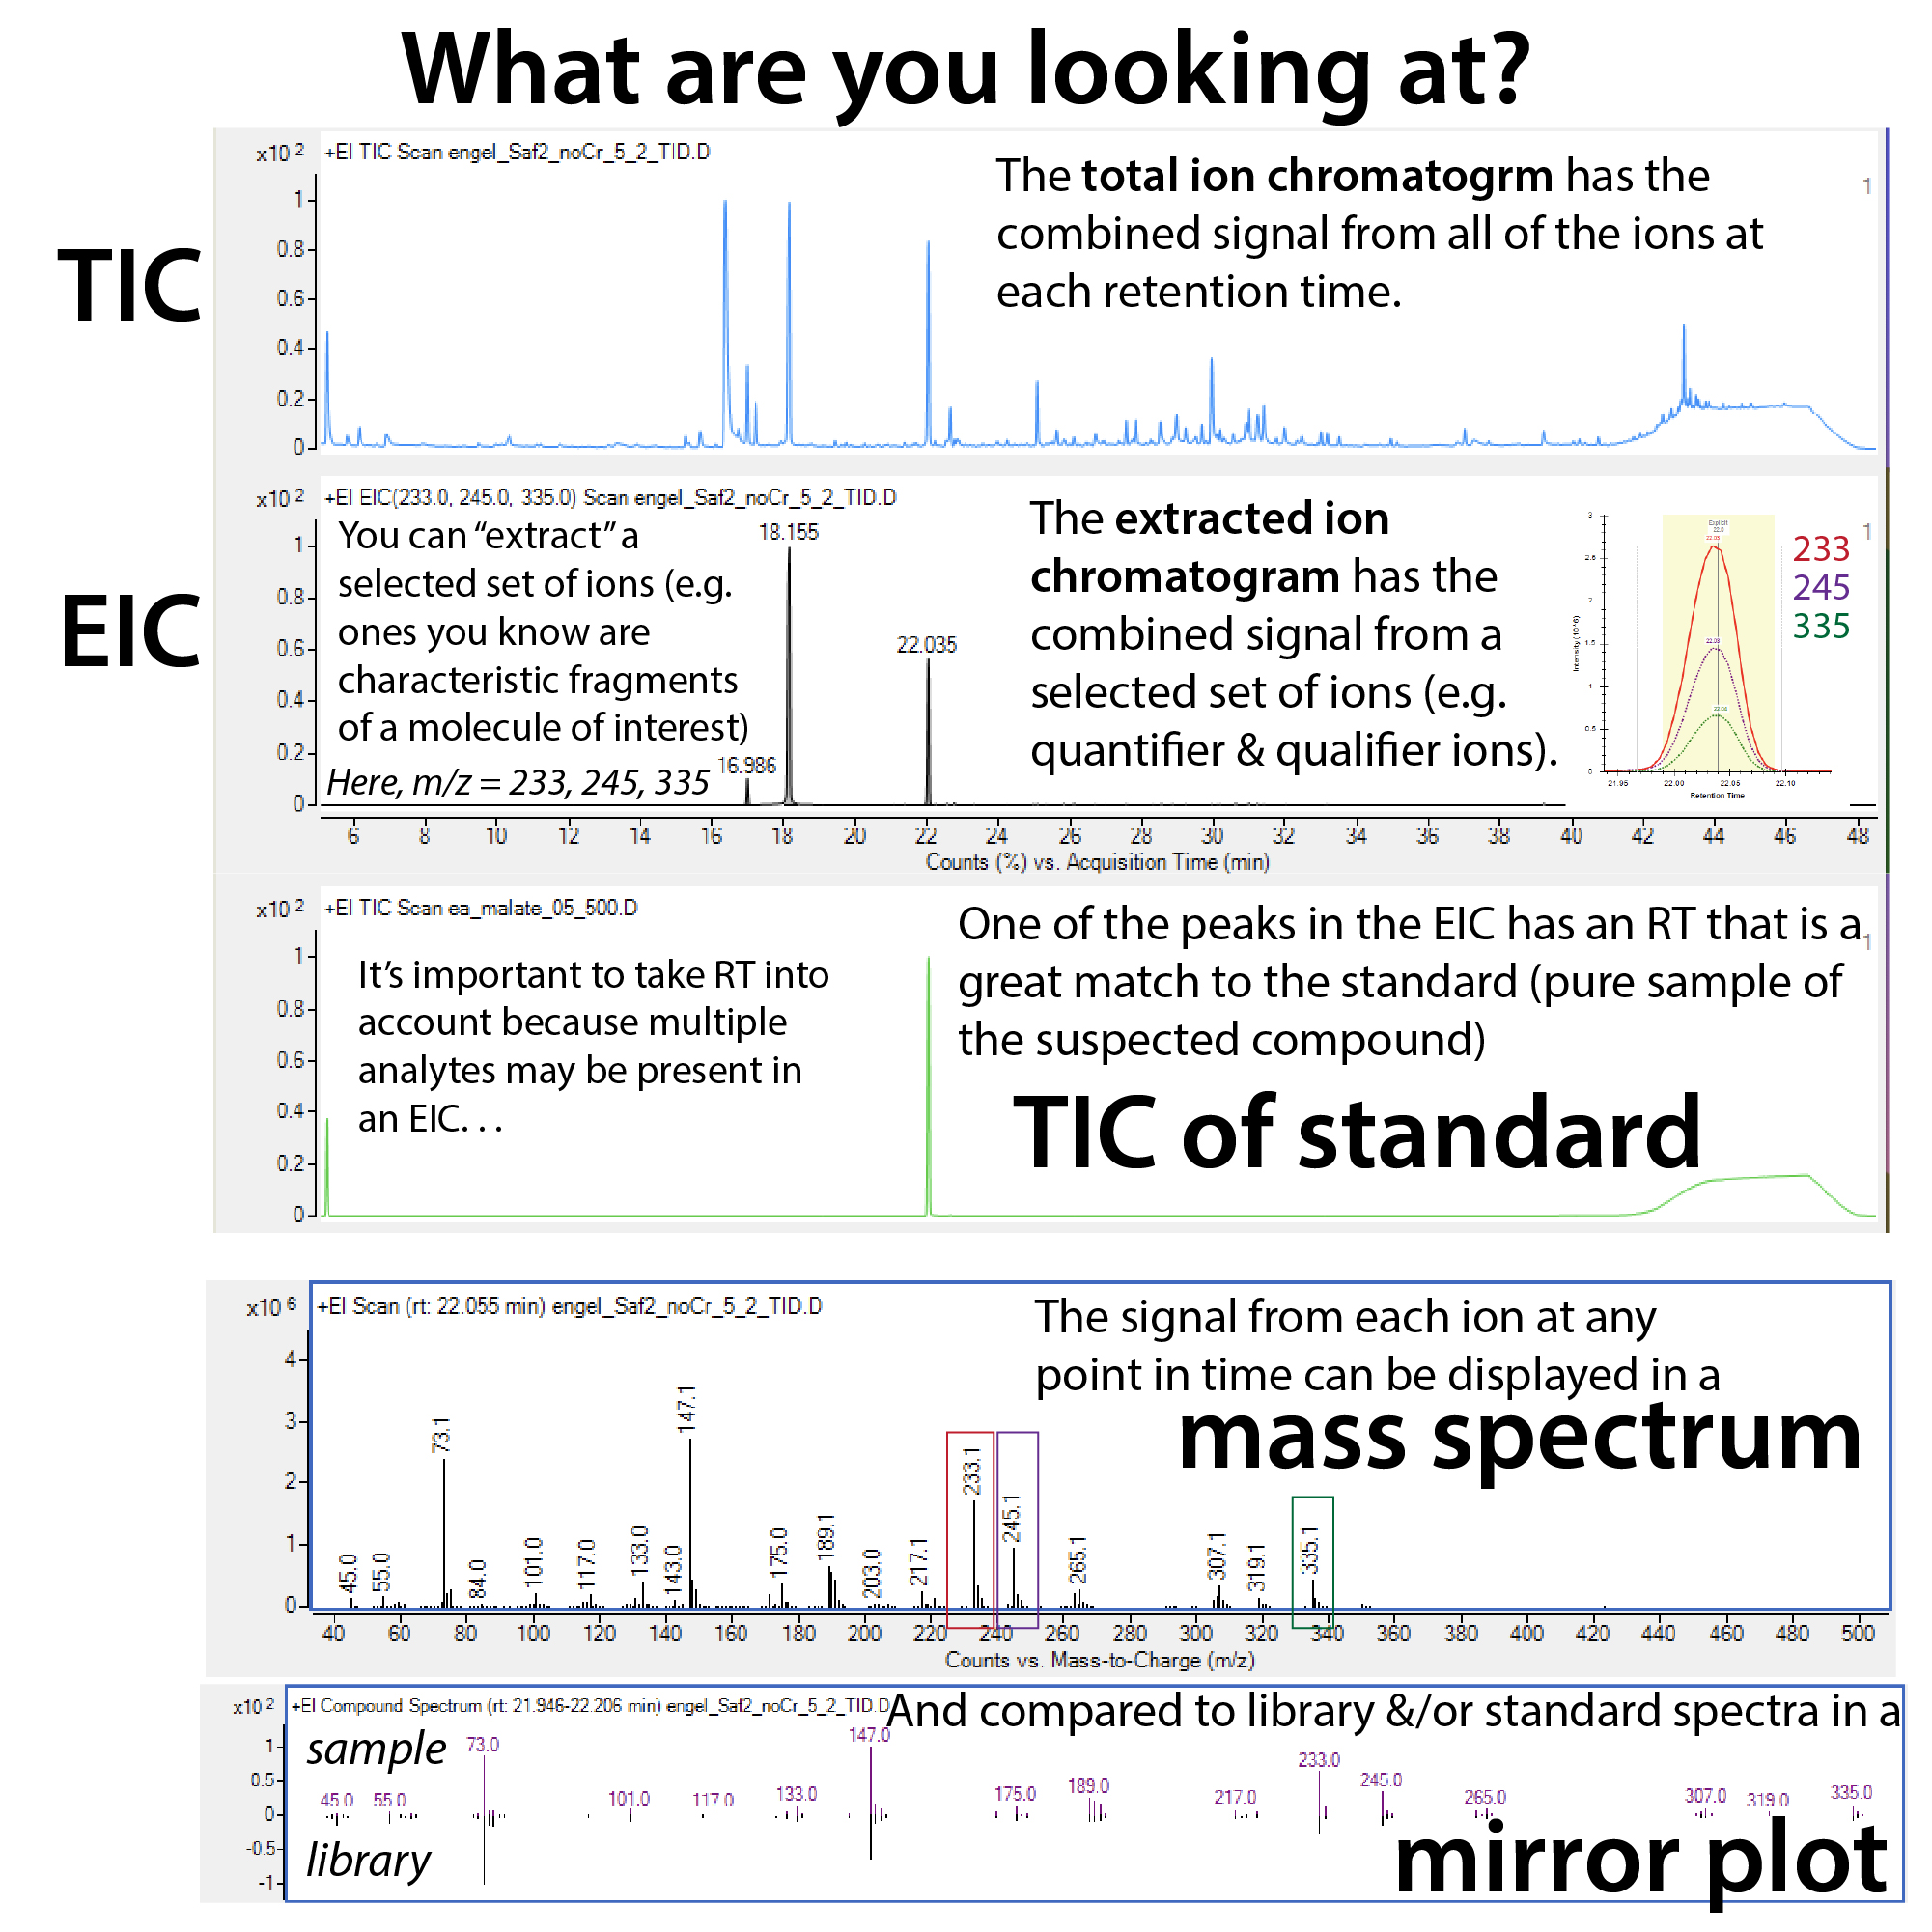
For more about chromatography-paired mass spectrometry, see: https://bit.ly/massspecgraphs and https://bit.ly/gcmstest


More about mass spec-related topics…
Tandem mass spectrometry (MS-MS), mass analyzers, etc.
MS/MS (Tandem MS) comes in many different flavors (e.g. the “triple quadrupole (QqQ), Q-orbitrap (e.g. Q-Exactive), Q-Time of Flight (Q-TOF)), […]
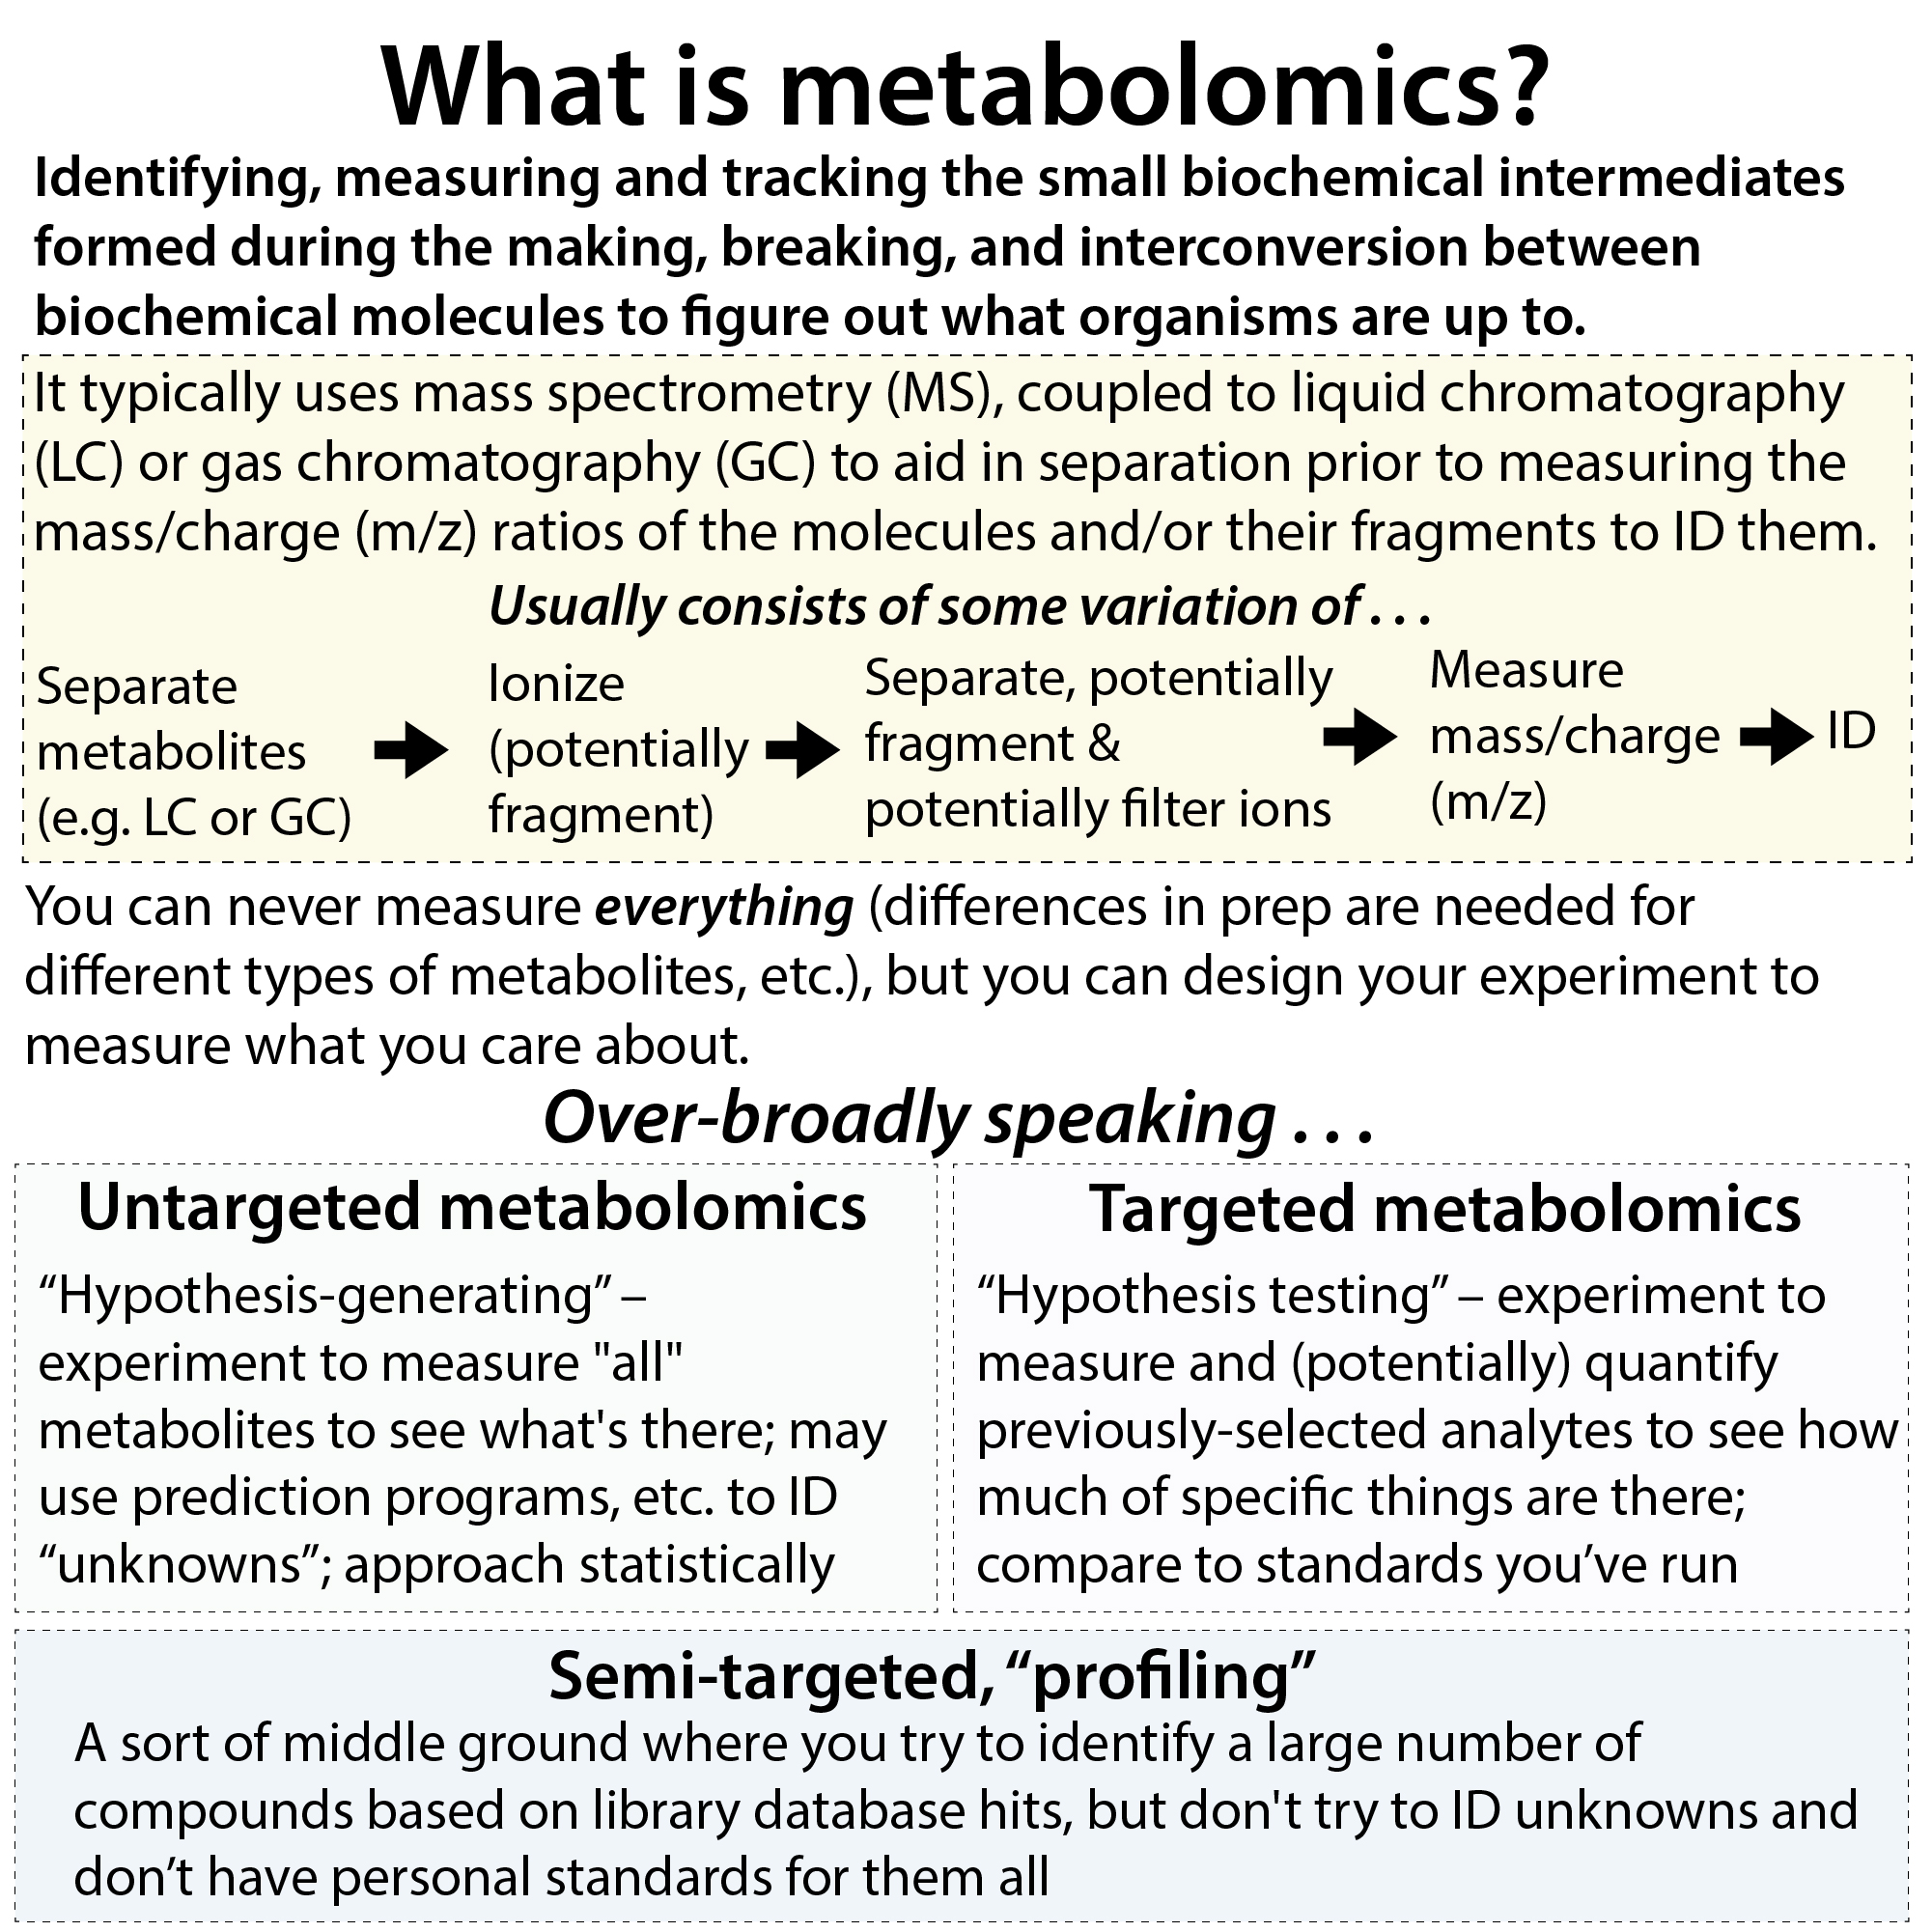
What is metabolomics?
What is metabolomics? My definition: Identifying, measuring and tracking the small biochemical intermediates formed during the making, breaking, and interconversion between biochemical molecules to figure out what organisms are up to.
Mass resolution and mass accuracy in mass spectrometry
When it comes to mass spectrometry, don’t confuse high resolution and accurate mass! High resolution is basically having sharp spectral […]
Retention Indexes
Pay attention to Retention (Time)! In GC-MS (gas chromatography-mass spectrometry) or LC-MS (liquid chromatography-mass spectrometry), chromatography has two main benefits […]
Chromatography-coupled mass spectrometry graph types, etc.
Chromatography-paired mass spectrometry typically uses mass spectrometry (MS), coupled to liquid chromatography (LC) or gas chromatography (GC) to aid in […]
Derivatization of metabolites for GC-MS via methoximation+silylation
Silylation may sound silly to say, but if you want to make organic acids volatile for GC-MS, it gives you […]