Can you tell how many Cheerios are in your cereal bowl just by tasting a spoonful? Could a standard curve of a serial cereal dilution be the solution to the Cheerio concentration challenge?
Standard curves (aka calibration curves) are where you measure some signal from something of known concentration and compare it to the signal of something of unknown. Some places we use it in the lab are with protein concentration assays (Bradford, BCA, etc.) and qPCR, which I talk much more about elsewhere.
Before I lose people in background, here’s and overview & the key takeaways and then I will back up and explain it all in depth.
link to video in case embed isn’t working: https://youtu.be/9ZAWm5xm6gc
Overview:
- prepare a serial dilution of sample of known concentration spanning a range that should encompass your sample and fall within the limits of detection
- (Have your computer) perform a linear regression to fit a line to the linear range if the data
- Measure your unknown
- Use the equation to solve for the concentration of the unknown
Key points:
- only use the linear range of the standard curve to calculate the equation
- Don’t extrapolate beyond the limits of the part of the line that the equation fits/covers
- Dilute your sample if necessary so it falls in the covered region
- Remember to account for this dilution when calculating the stock concentration (concentration of the original, undiluted, sample)
- Dilute your sample if necessary so it falls in the covered region
- Look at the graph so you aren’t tricked by the R² or outliers
Now let’s start with the basics. And what’s more basic than Cheerios? So we’re back to that cereal concentration conundrum…
note: adapted from 2019 post
Firstly, let’s get on the same spoonful about what I mean by “concentration.” ”Concentration – in addition to being something I had to do a lot today when running some exciting experiments – and preparing some standard curves – is how much of one thing there is compared to all the things (e.g. if you take a spoonful of your bowl of Cheerios, how much of that spoonful is Cheerios?).
Say it’s easier to measure Cheerio flavor → the more Cheerios per spoonful, the more it will taste like Cheerios. If there’s a direct, linear relationship between Cheerio concentration & Cheerio taste we can taste different concentrations of Cheerios spanning the range we think our bowl falls somewhere within. (Since we don’t know the concentration of our bowl we may have to try a few & even dilute our sample if needed for reasons we’ll see).
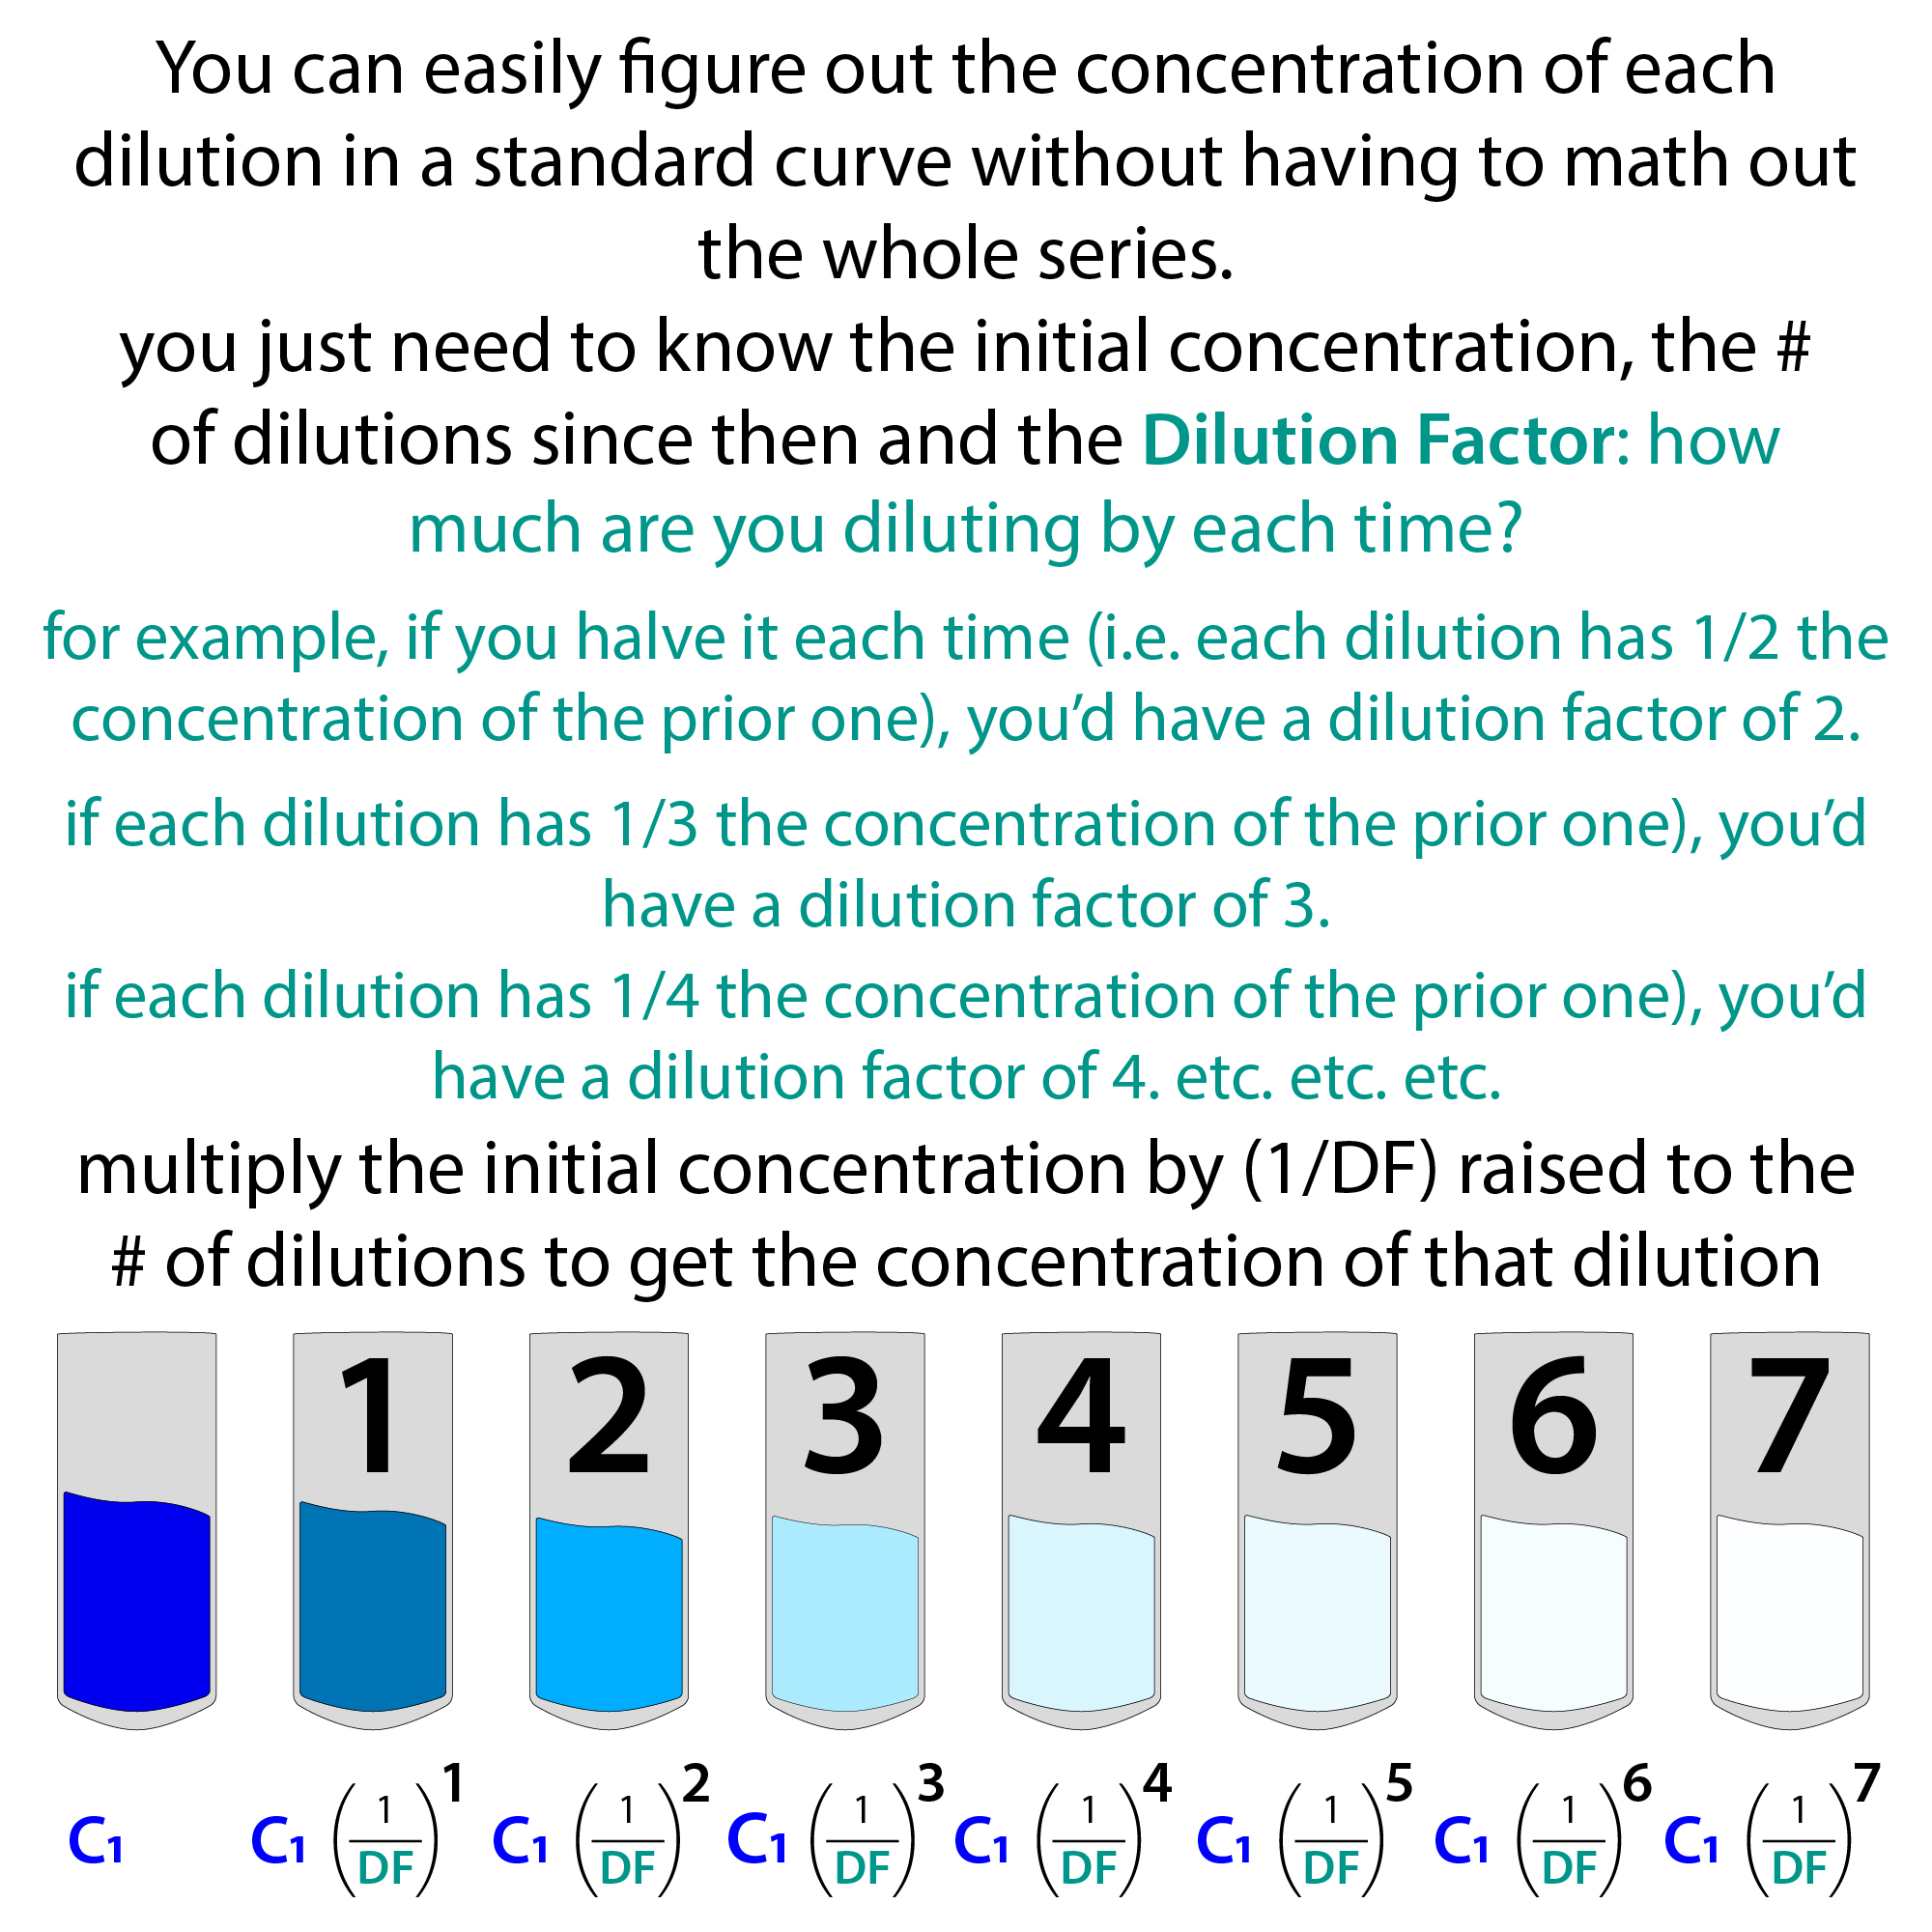
We can easily get a range of concentrations – the serial dilution. Much more on this here: http://bit.ly/serialdilution
But, it’s like you take a spoonful of Cheerios and add it to a spoonful of milk, stir it up well, take a spoonful of this new mix and add it to a spoonful of fresh milk, stir that up & add a spoonful of it to another spoonful of new milk and… You’ve got yourself a serial cereal dilution!
And if you want a broader range you can use a bigger dilution factor. If you add 1 to 1 like above you have a dilution factor of 2, but you can do things like 1 spoonful of Cheerios + 9 spoonfuls of milk to get a dilution factor of (1+9)/1 = 10.
Since you do this stepwise, each dilution is a dilution-factor-fold less concentrated than the one before it.
So you make a serial dilution (or several identical ones (replicates)) and then you measure the proxy signal – so in this case you’d taste them all (though hopefully you’d have a more quantitative (number-giving) and less subjective measuring tool – a Cheerio-taste-testing-machine?)
Anyways… At some point the solution will be so dilute that you can’t taste the Cheerios anymore. This is the limit of detection. Below this limit you just taste milk even if there are still Cheerios there. So taste is useless below that.
But once you get above that threshold, say there’s a range at which your taste buds are good at discriminating between different amounts of Cheerios – it can tell 24 cheerios are twice as Cheerio-tasting as 12, which are 2X Cheerio-tastier than 6. If you were to graph the values on a proper scale you’d see a straight line.
But maybe it has trouble once you get down to 3 – it can tell it’s less but not really how much less – you lose the direct, linear relationship between Cheerio concentration and taste and your straight line starts getting curvy – you’re nearing that limit of detection.
Curviness also happens at the other extreme – maybe once you’re above 24 Cheerios your tastebuds are overwhelmed so they can’t pick up that direct relationship either. You want to stay in the range where the relationship is linear, even if this requires diluting your sample first (and since you don’t know the concentration of the sample you might have to test out a few).
Even if you’re within the linear range, standard curves of different things can still have differences in sensitivity – how well can you distinguish 5 cheerios per spoonful from 6 cheerios per spoonful? This is going to be represented by the slope (steepness) of the curve.
If you were to add a Cheerio to a bowl of milk 1 by 1 at a constant rate when you were in the linear range, you’d have a direct linear relationship between Cheerios and taste but in a sea of Cheerios can your taste buds really tell if you’ve added 1 more? The more tasty each Cheerio is, the stronger the “signal” you get from it and the steeper your slope will be.
How steep? You can ask your calculator or computer to generate a linear regression which basically finds the equation of a line that best fits the data. And then you plug in your measured value and solve for the concentration.
The equation is reported to you in the form of
y= mx + b
Most of the time,
y is the thing you’re measuring directly (e.g. flavor)
x is the thing that measurement represents (e.g. cheerio concentration)
m is the slope (steepness) of the line
b is the y-intercept (offset from the origin (how far above 0 is your 0? (what’s pure milk taste like)
(Note: sometimes concentration will be plotted as y and you’ll have to rearrange to solve for x, such as in the qPCR standard curve example I go over in the video)
When you ask your calculator or computer to compute an equation, IT WILL even if it shouldn’t. You could have a totally random set of points or a wavy line or a hill and it would “fit” a straight line to it.
You should always look at the graph to make sure the equation makes sense and the points are linear. You want to see where linearity starts and ends and remove those non-linear ends – but don’t just go removing points from the middle (we call this “cherry-picking” data and it’s a big no-no unless you know a point is actually wrong (like you dribbled half of that spoonful down your shirt (in which case you hopefully took a note of that in your notes being the good scientist you are!)
One (imperfect) way to check how appropriate the line is is the R-squared value (aka coefficient of determination), which is an indicator of how well your data fits the line. R² = explained variation/total variation, so you want it to be close to 1 (all the differences in tastiness can be accounted for by differences in Cheerio concentration according to the equation you’ve calculated). You want your R² to be close to 1, but that’s not enough. It’s NOT “1 and done.” It can get “tricked” into a high R² for reasons like points being bad but symmetrically bad.
This webpage shows some examples https://online.stat.psu.edu/stat462/node/98/
So you gotta look at the graph!
You can also look at a plot of the residuals – how far is each measured point from where it’s predicted to be. if you look at a plot of the residuals it should be randomly distributed. If there’s a trend in the residuals your equation is probably missing something (a simple linear regression isn’t appropriate).
And speaking of not being appropriate, it is definitely not appropriate to go around tasting your samples! Normally, instead of taste we use things like coloredness (e.g. in Bradford protein concentration assay) or fluorescence. More on these here: http://bit.ly/proteinmeasuring
more on qPCR: http://bit.ly/rtrtqpcrprimer & https://youtu.be/kp4ZX2lOr6w