
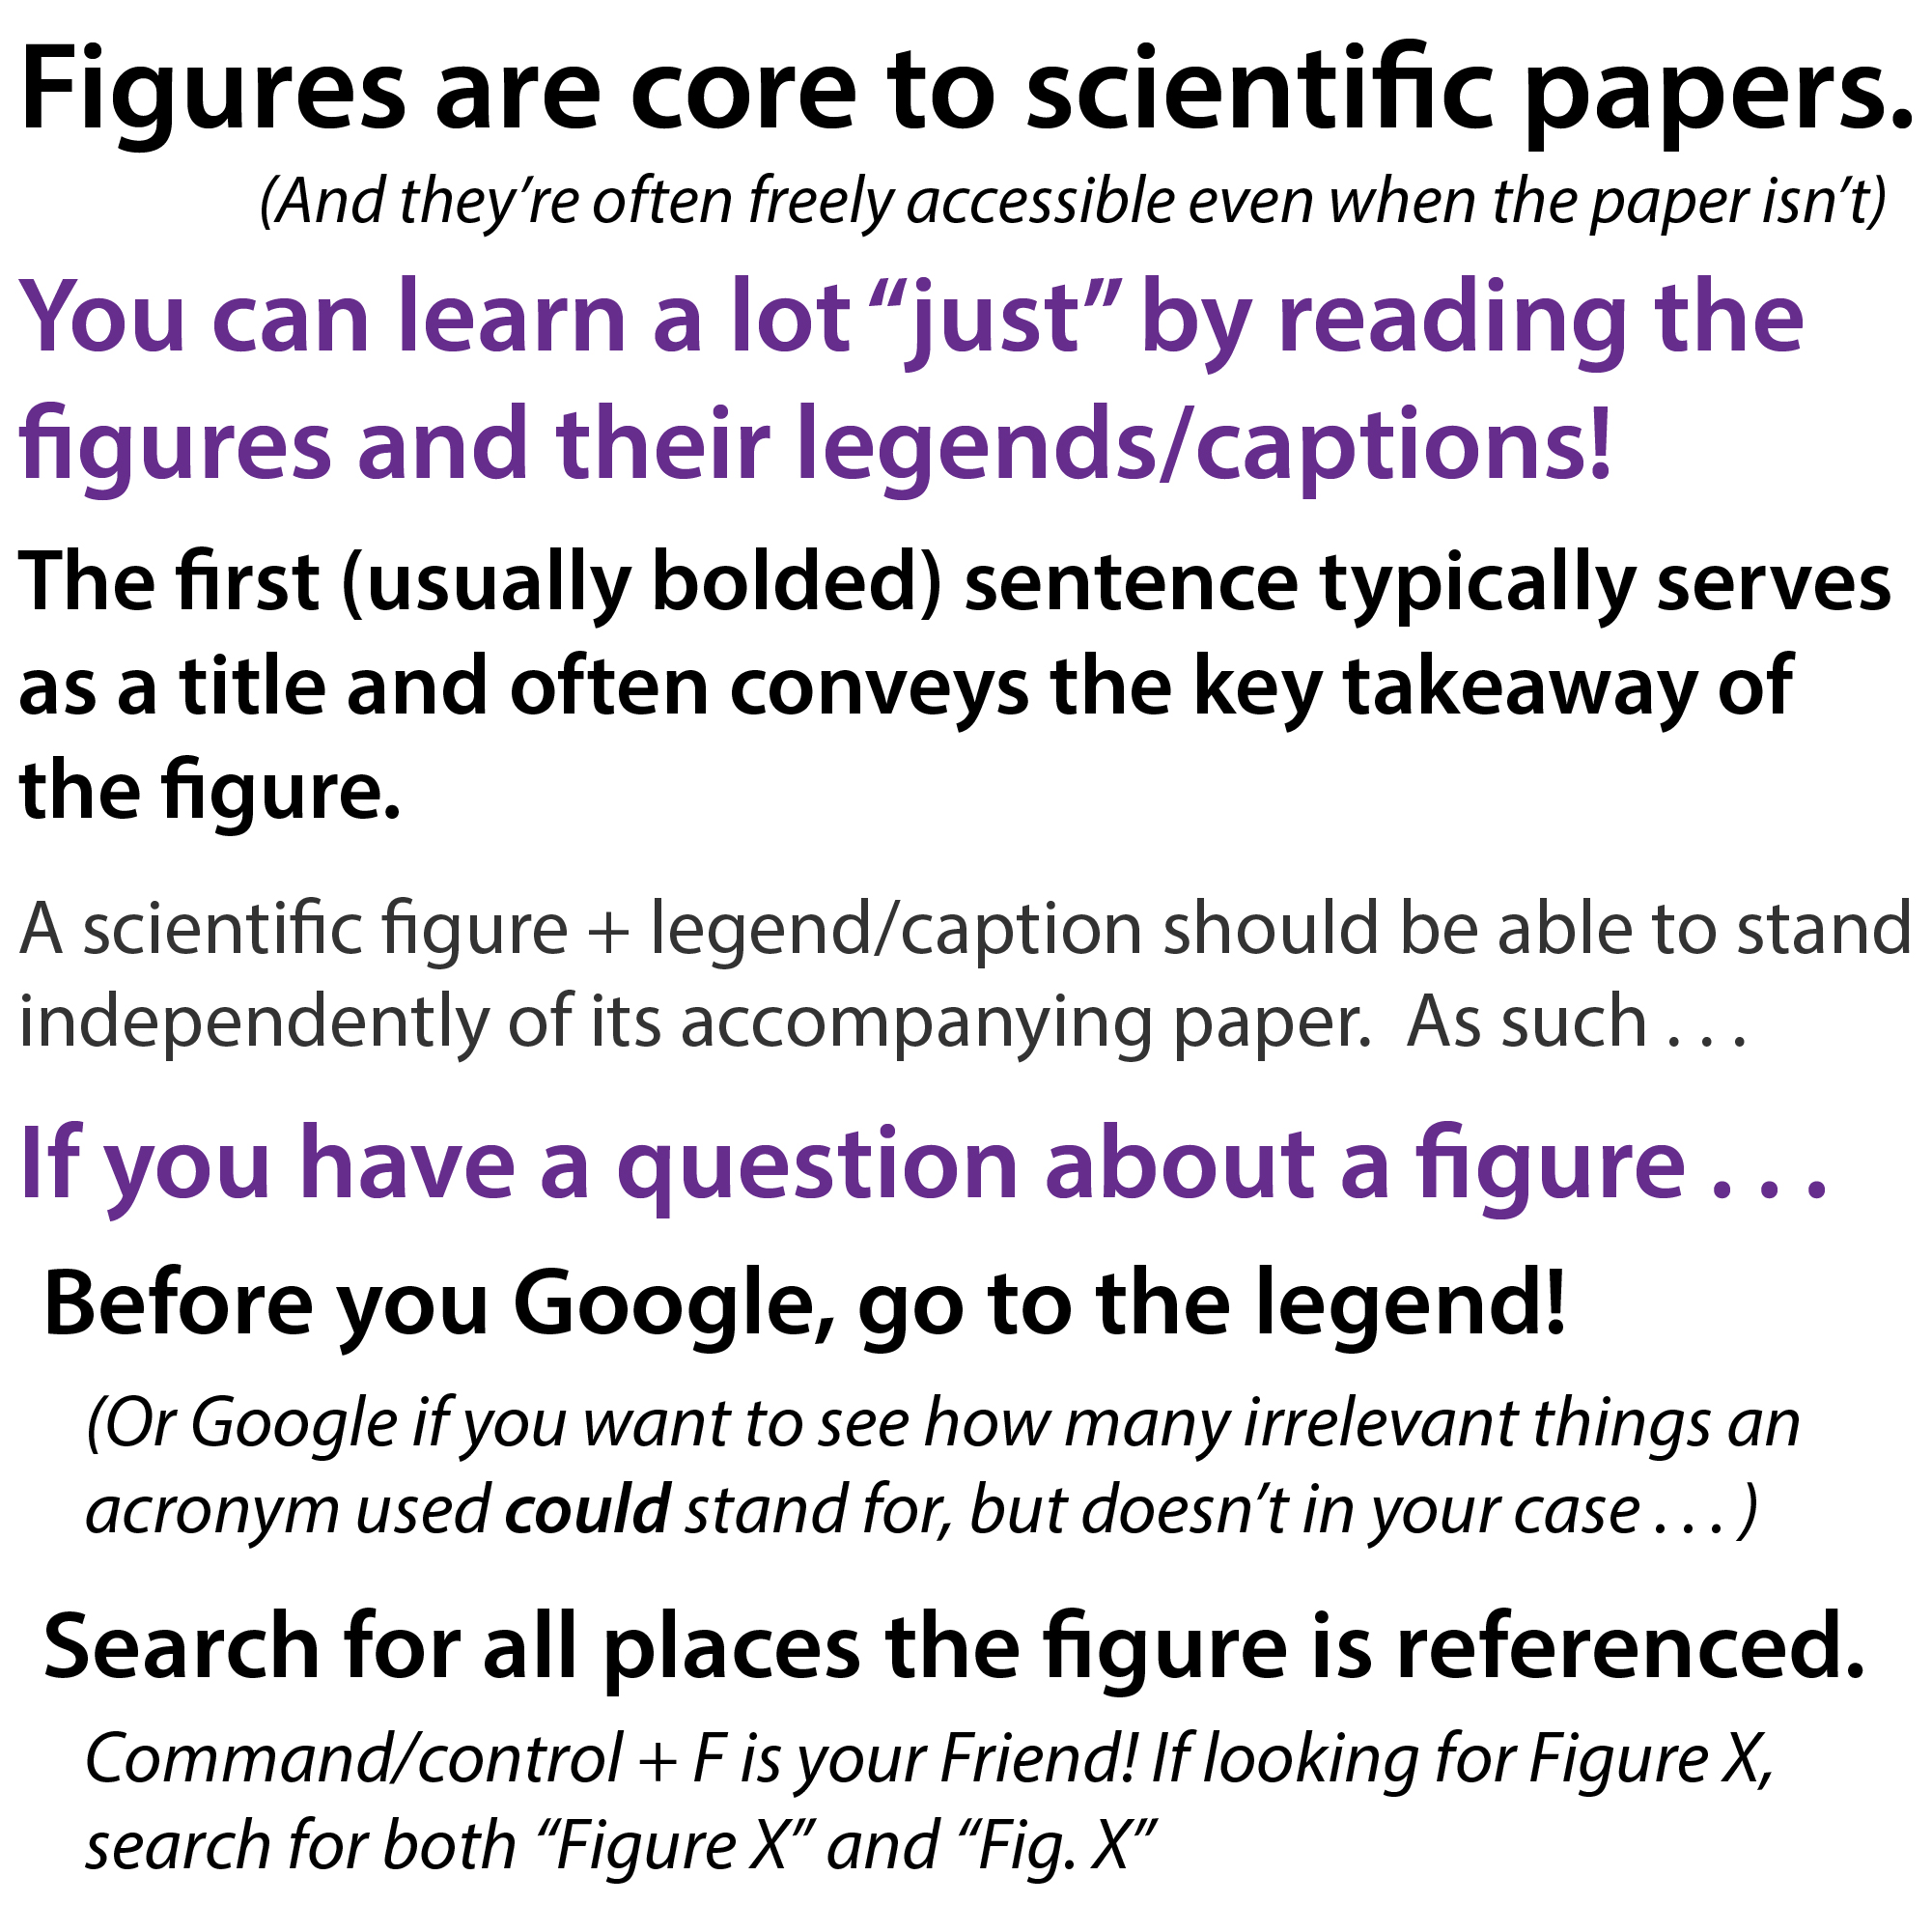
Figures are core to scientific papers. (And they’re often freely accessible even when the paper isn’t). You can learn a lot “just” by reading the figures + legends!
A scientific figure + legend/caption should be able to stand independently of its accompanying paper. As such …
- If you have a question about a figure…
- Before you Google, go to the legend!
- (Or Google if you want to see how many irrelevant things an acronym used could stand for, but doesn’t in your case…)
- Search for all places the figure is referenced.
- Command/control + F is your Friend! If looking for Figure X, search for both “Figure X” and “Fig. X”
- Before you Google, go to the legend!
- All acronyms and abbreviations must be defined anew.
- Unless generally recognized as established convention (e.g., DNA)
- Line &/or symbol styles, coloration, etc. must be described.
- And, ideally, they’re colorblind- & black/white printing friendly.
- Meaning of error bars, asterisks indicating statistical significance levels, etc. must be explained.
- Sufficient methodological information must be included for the reader to interpret the figure.
The first (usually bolded) sentence typically serves as a title and often conveys the key takeaway of the figure.
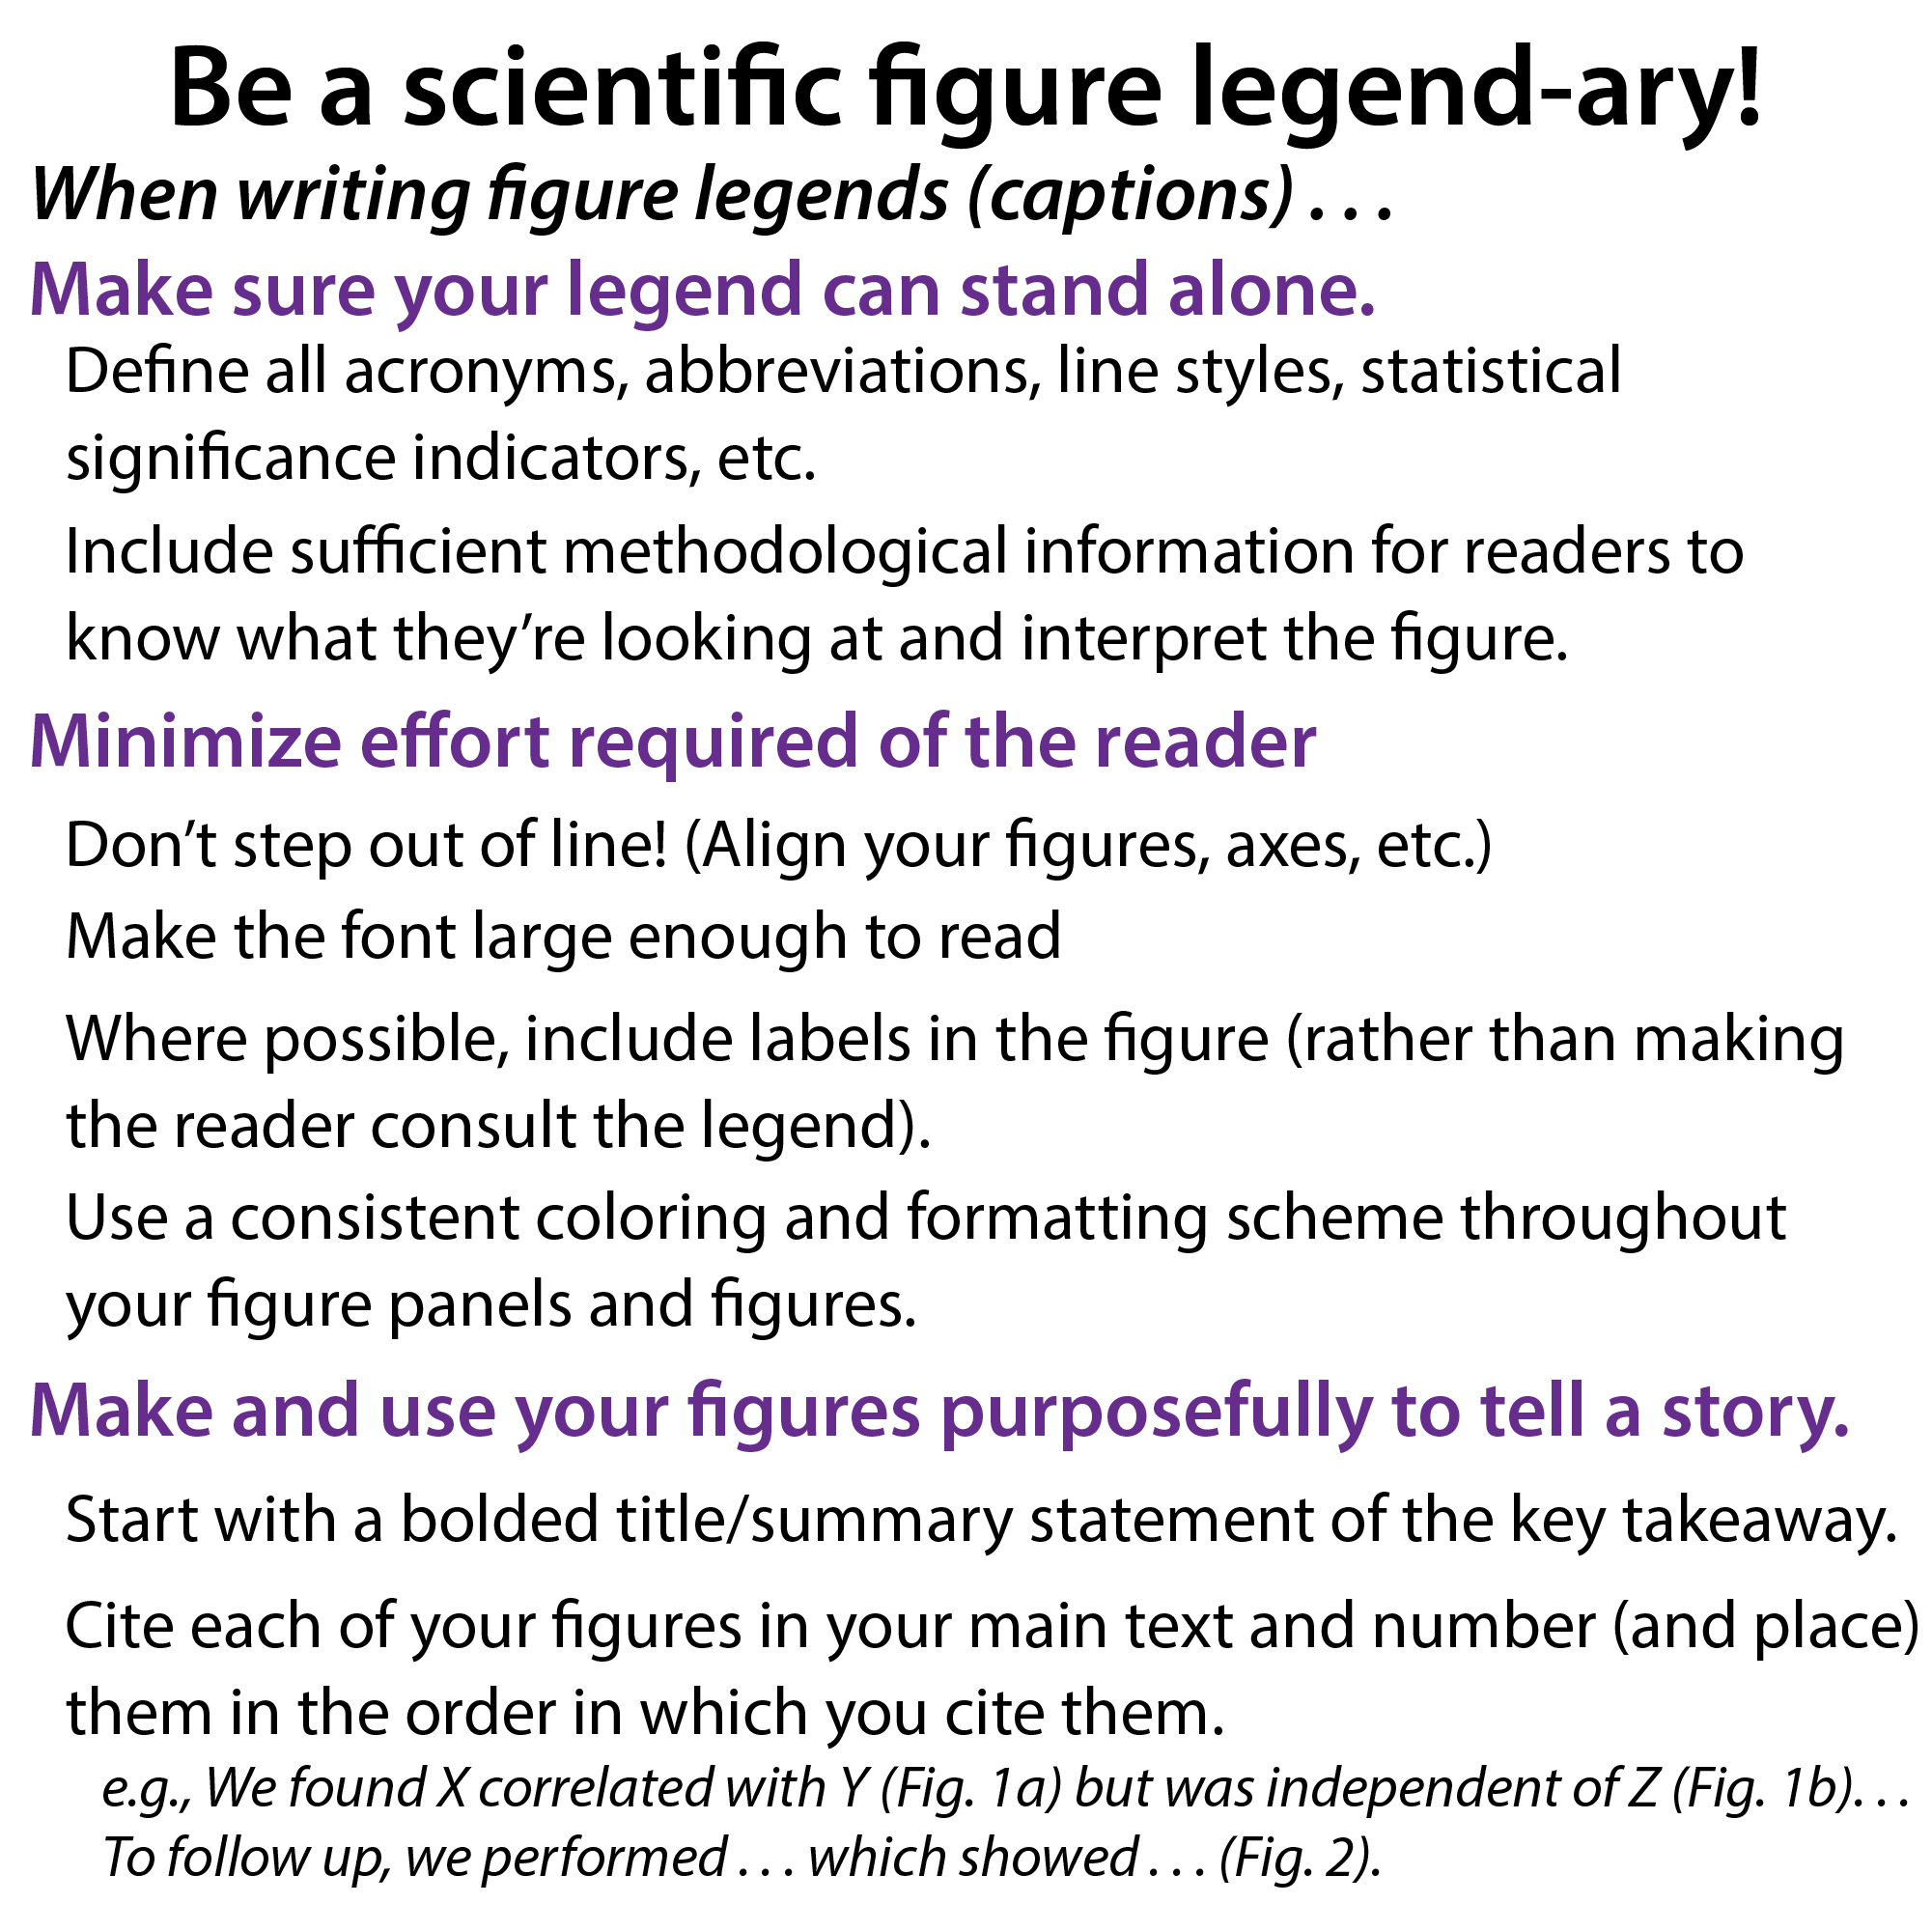
When writing figure legends (captions) …
- Make sure your legend can stand alone.
- Define all acronyms, abbreviations, line styles, statistical significance indicators, etc.
- Include sufficient methodological information for readers to know what they’re looking at and interpret the figure.
- Minimize effort required of the reader
- Don’t step out of line! (Align your figures, axes, etc.). See https://bit.ly/adobe_illustrator_fundamentals
- Make the font large enough to readWhere possible, include labels in the figure (rather than making the reader consult the legend).
- Use a consistent coloring and formatting scheme throughout your figure panels and figures.
- Make and use your figures purposefully to tell a story.
- Start with a bolded title/summary statement of the key takeaway.
- Cite each of your figures in your main text and number (and place) them in the order in which you cite them.
- e.g., We found X correlated with Y (Fig. 1a) but was independent of Z (Fig. 1b)… To follow up, we performed… which showed… (Fig. 2).

Resources:
Klionsky D. J. (2015). A few key points about figure presentation. Autophagy, 11(1), 1–8. https://doi.org/10.1080/15548627.2014.996046
The devil in the details (a short guide to writing figure legends). August 11, 2021 ~ Brooke Morriswood, Total Internal Reflection https://totalinternalreflectionblog.com/2021/08/11/the-devil-in-the-details-a-short-guide-to-writing-figure-legends/
How to craft a figure legend for scientific papers, BioTuring May 10, 2018 https://bioturing.medium.com/how-to-craft-a-figure-legend-for-scientific-papers-b26a77fa890
How To Write A Figure Legend + Published Examples, The Savvy Scientist, 13th May 2021 https://www.thesavvyscientist.com/how-to-write-a-figure-legend
more posts on topics pertaining to scientists-in-training: https://bit.ly/gradpostdocetc
