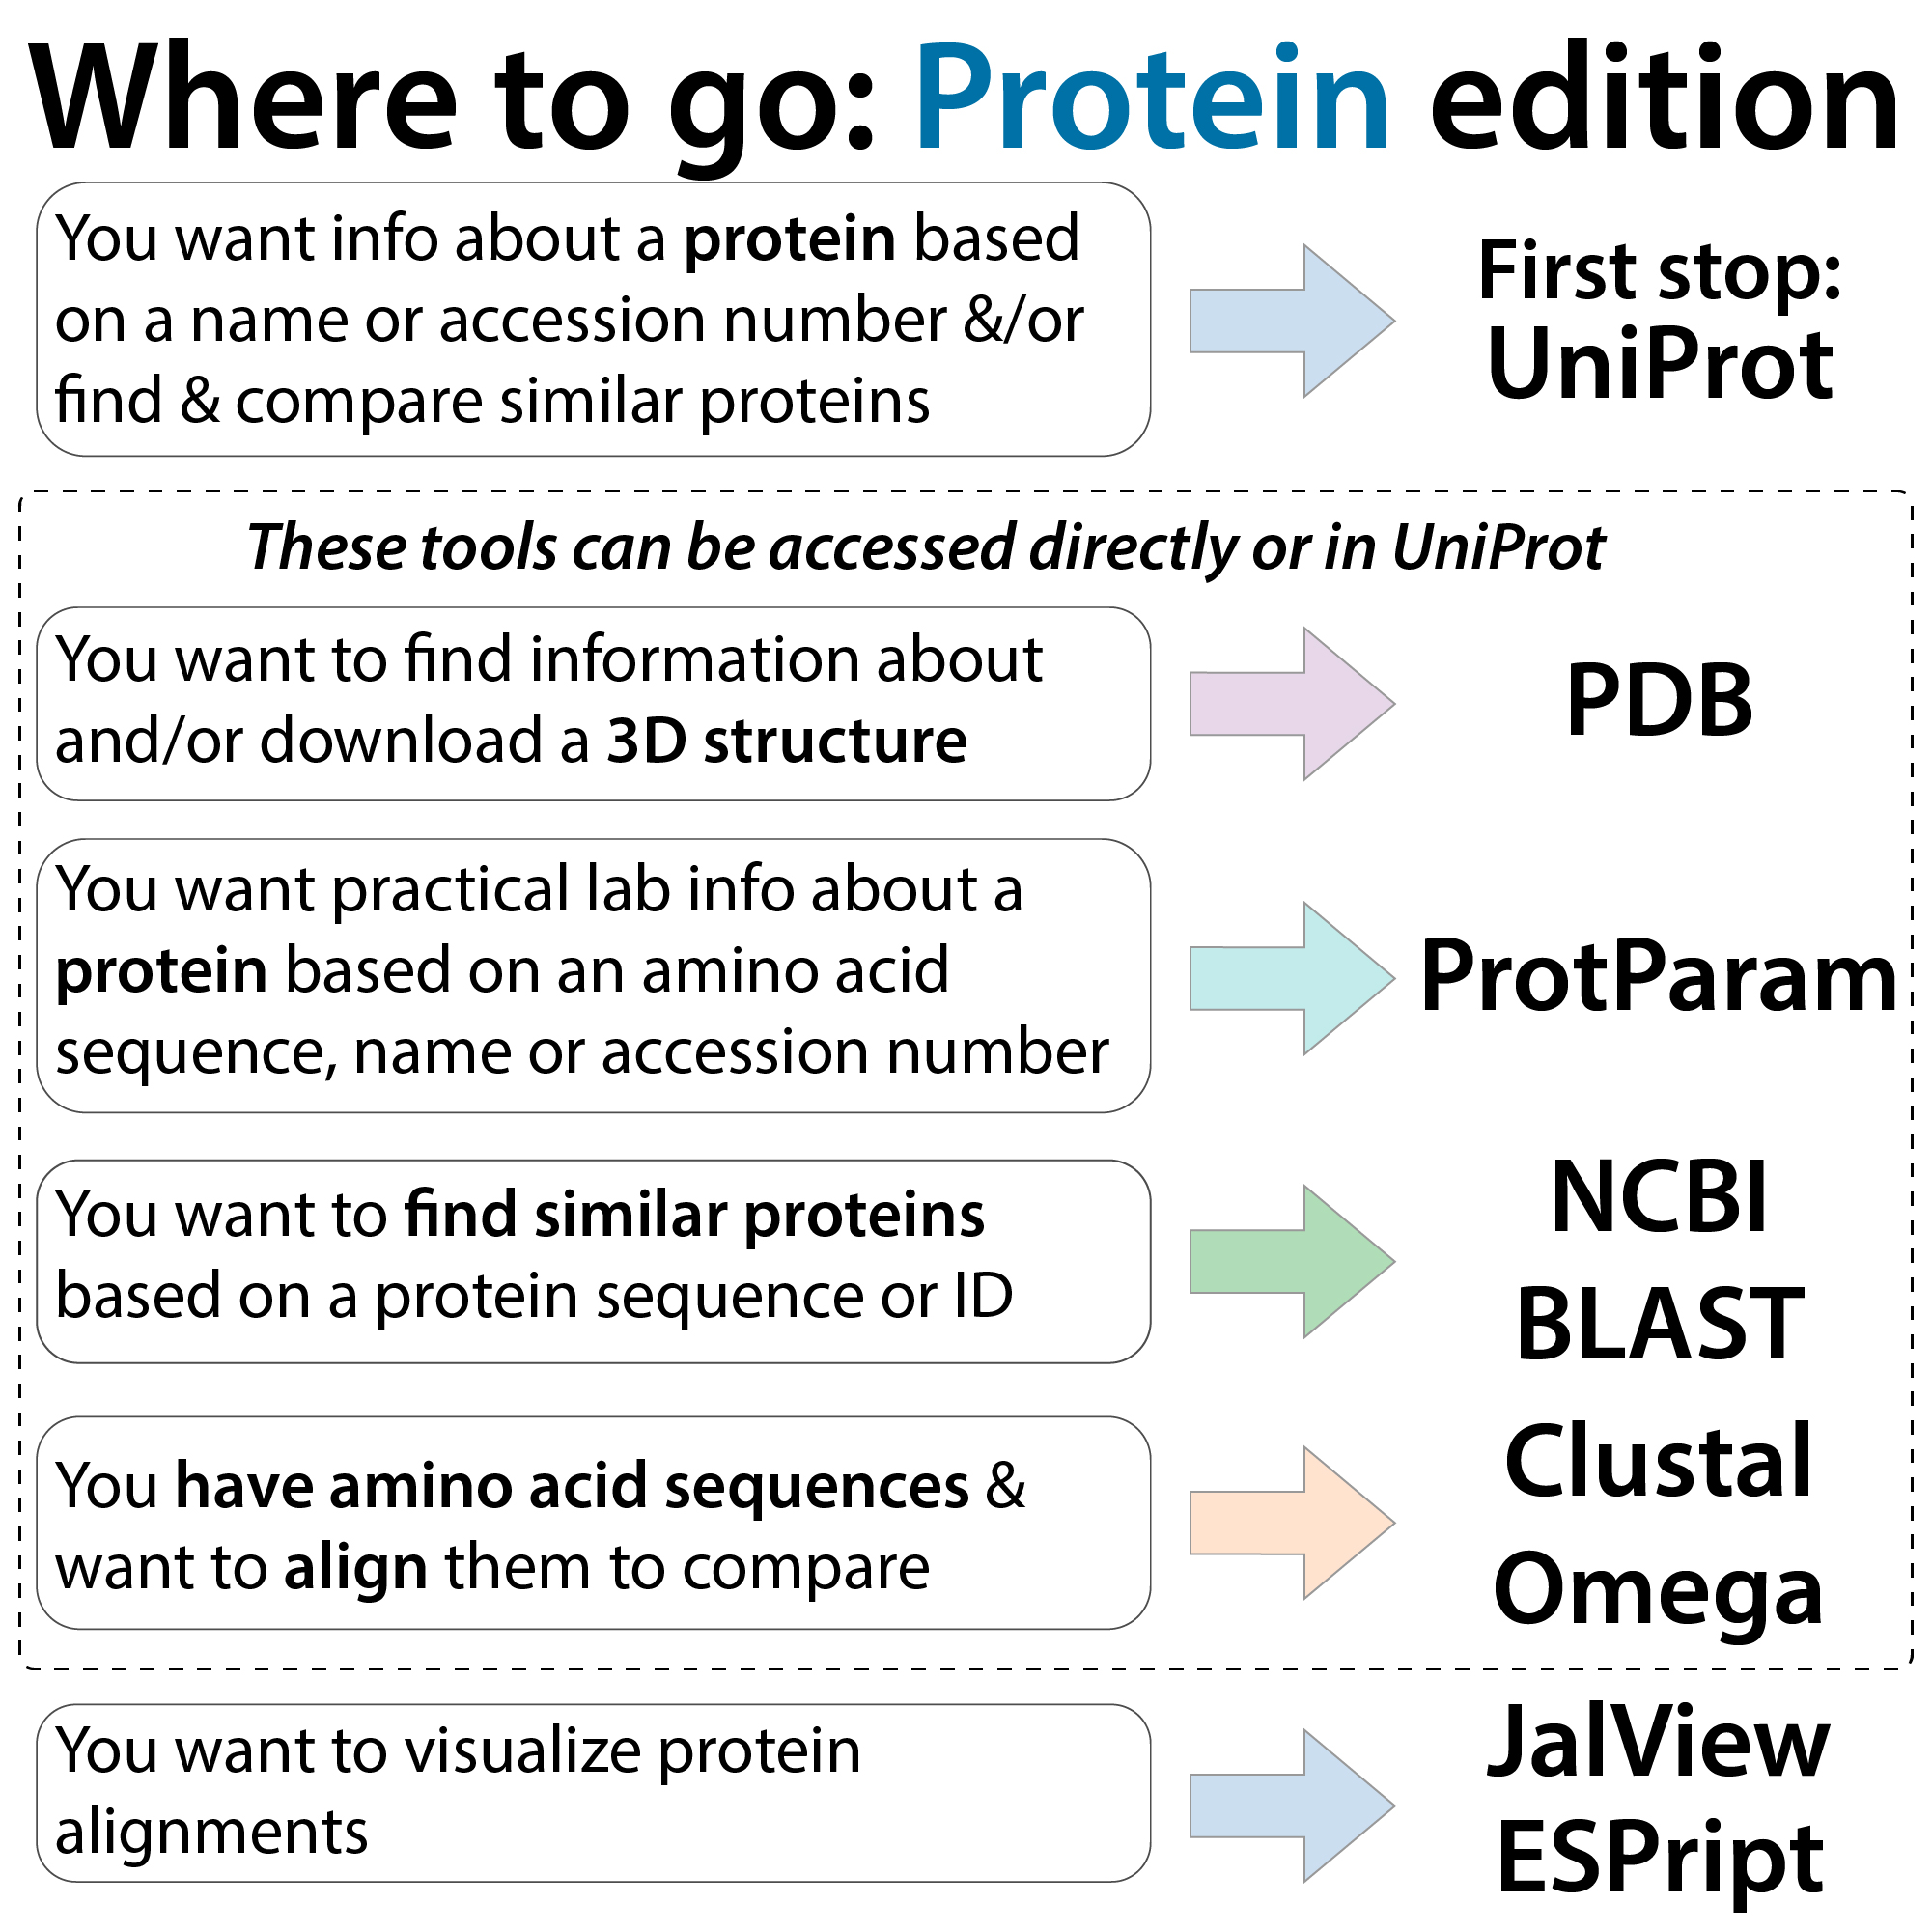
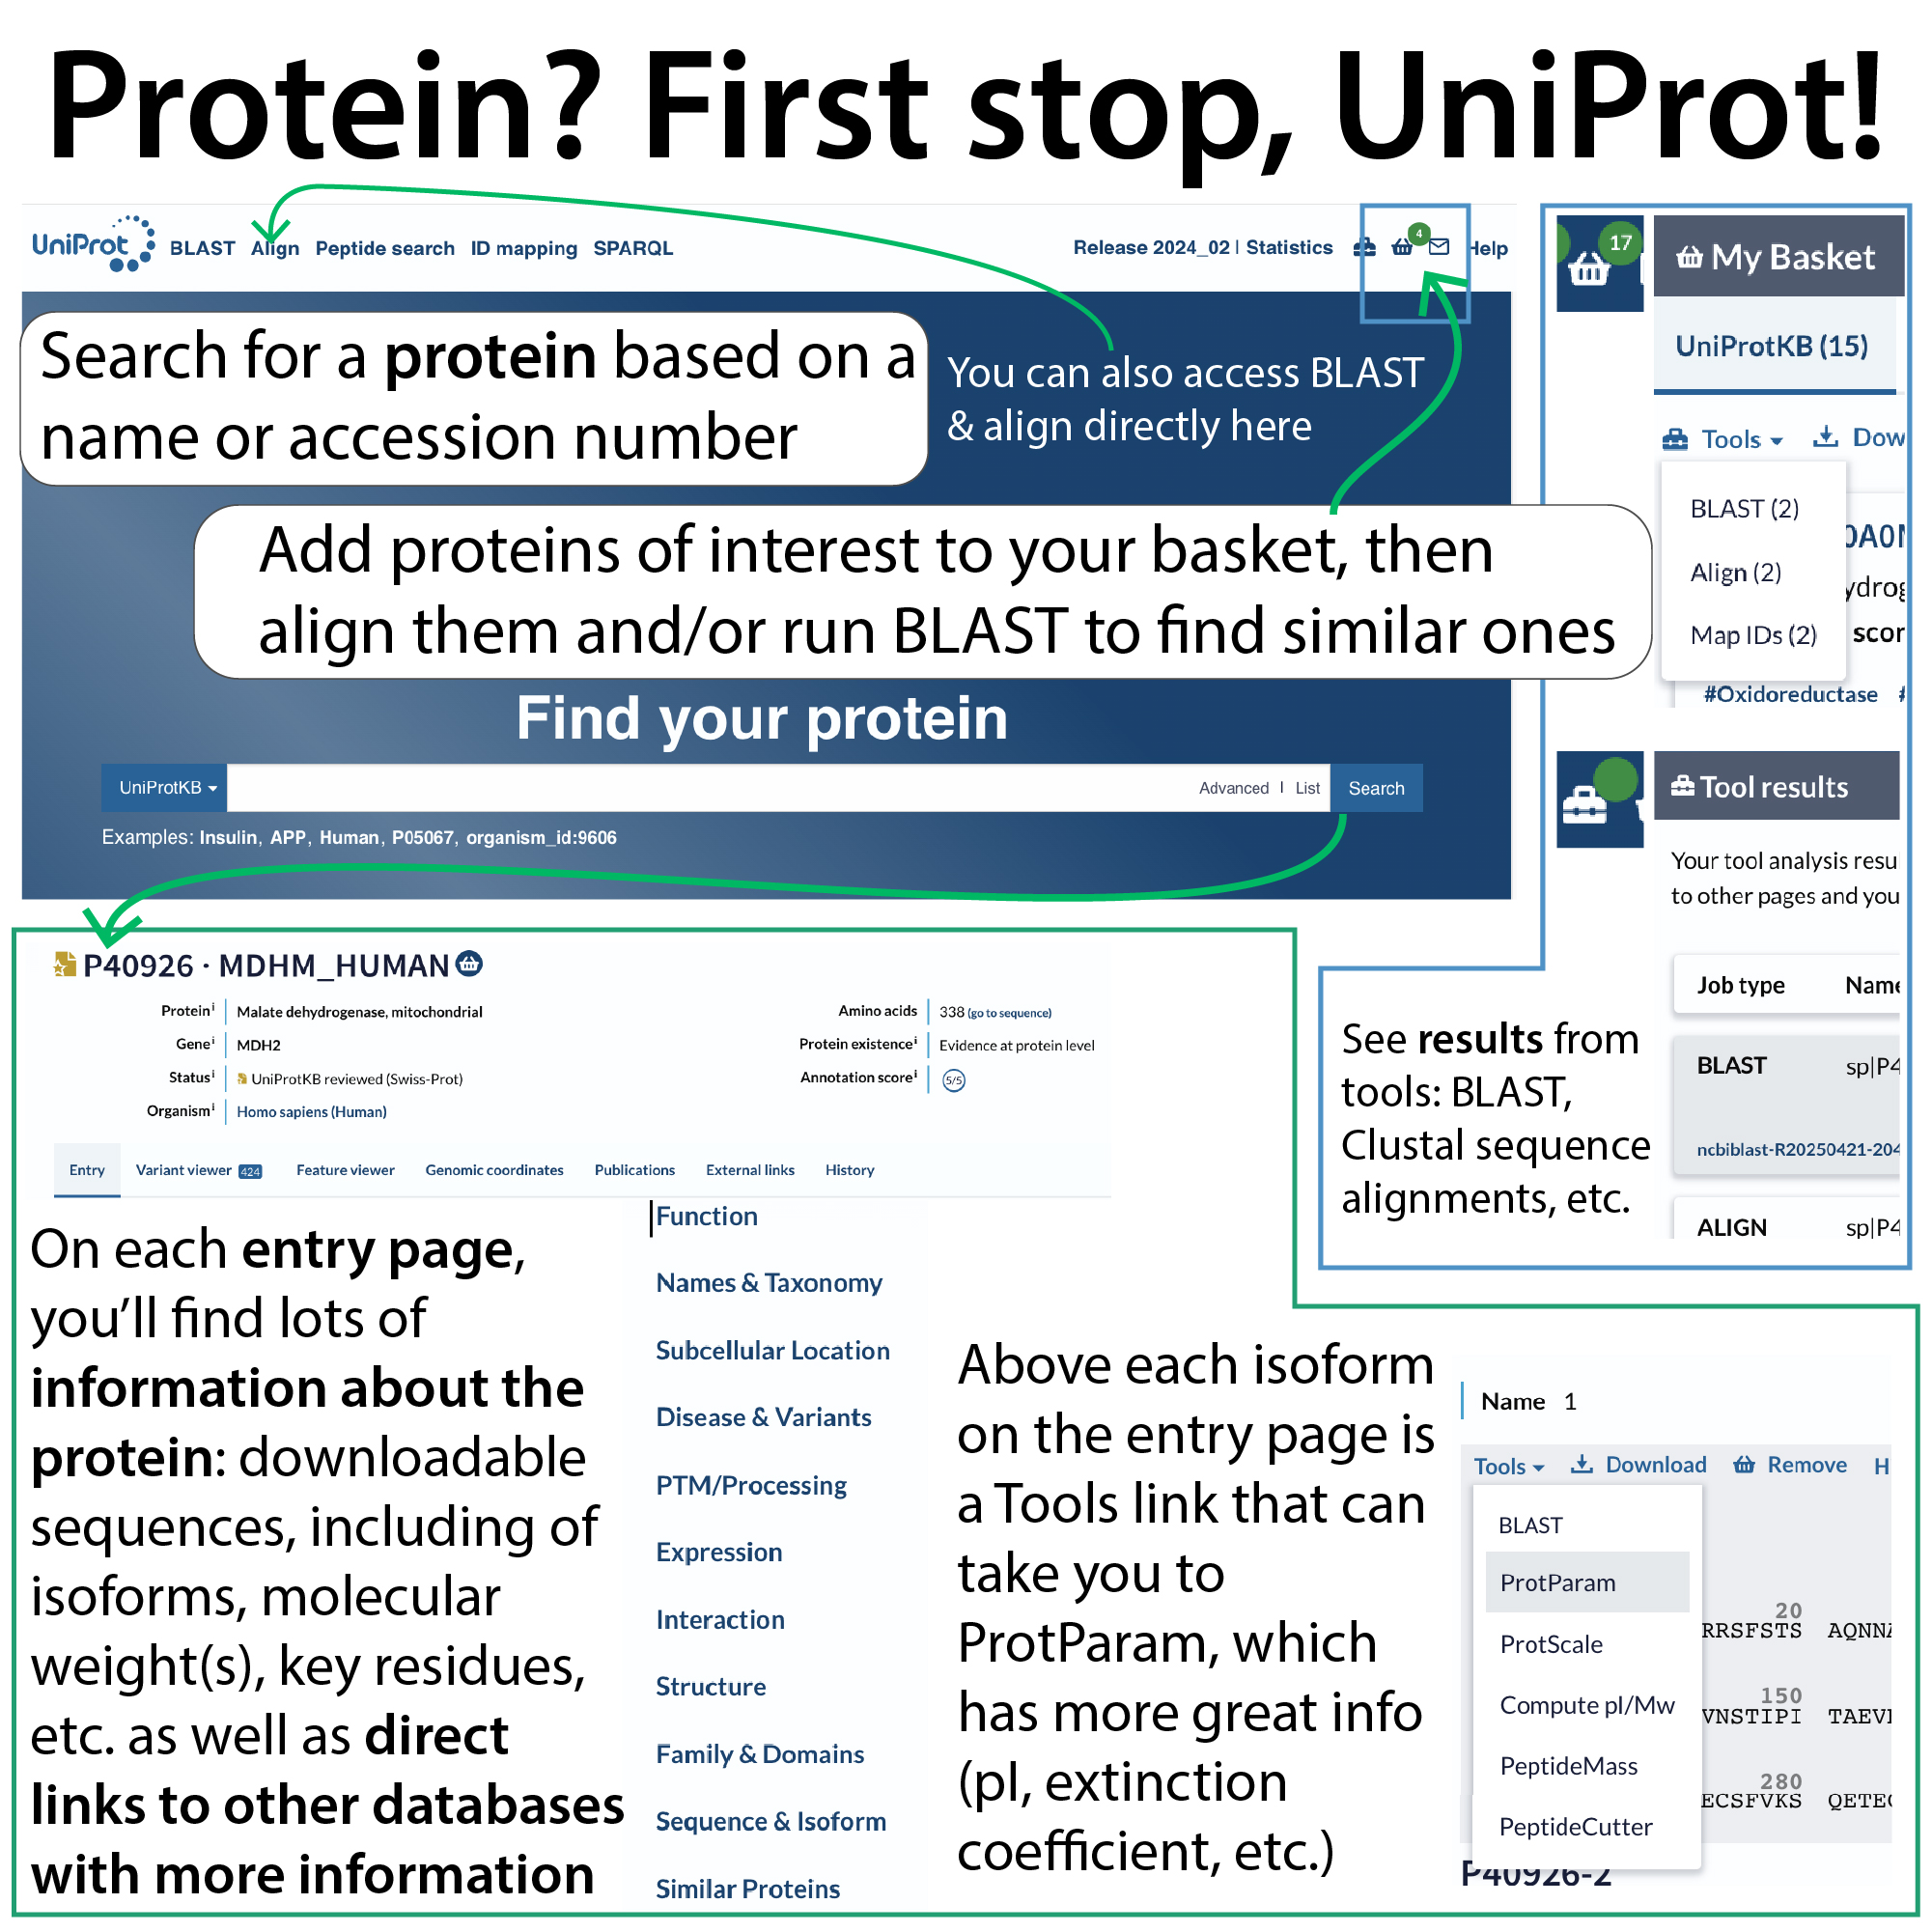
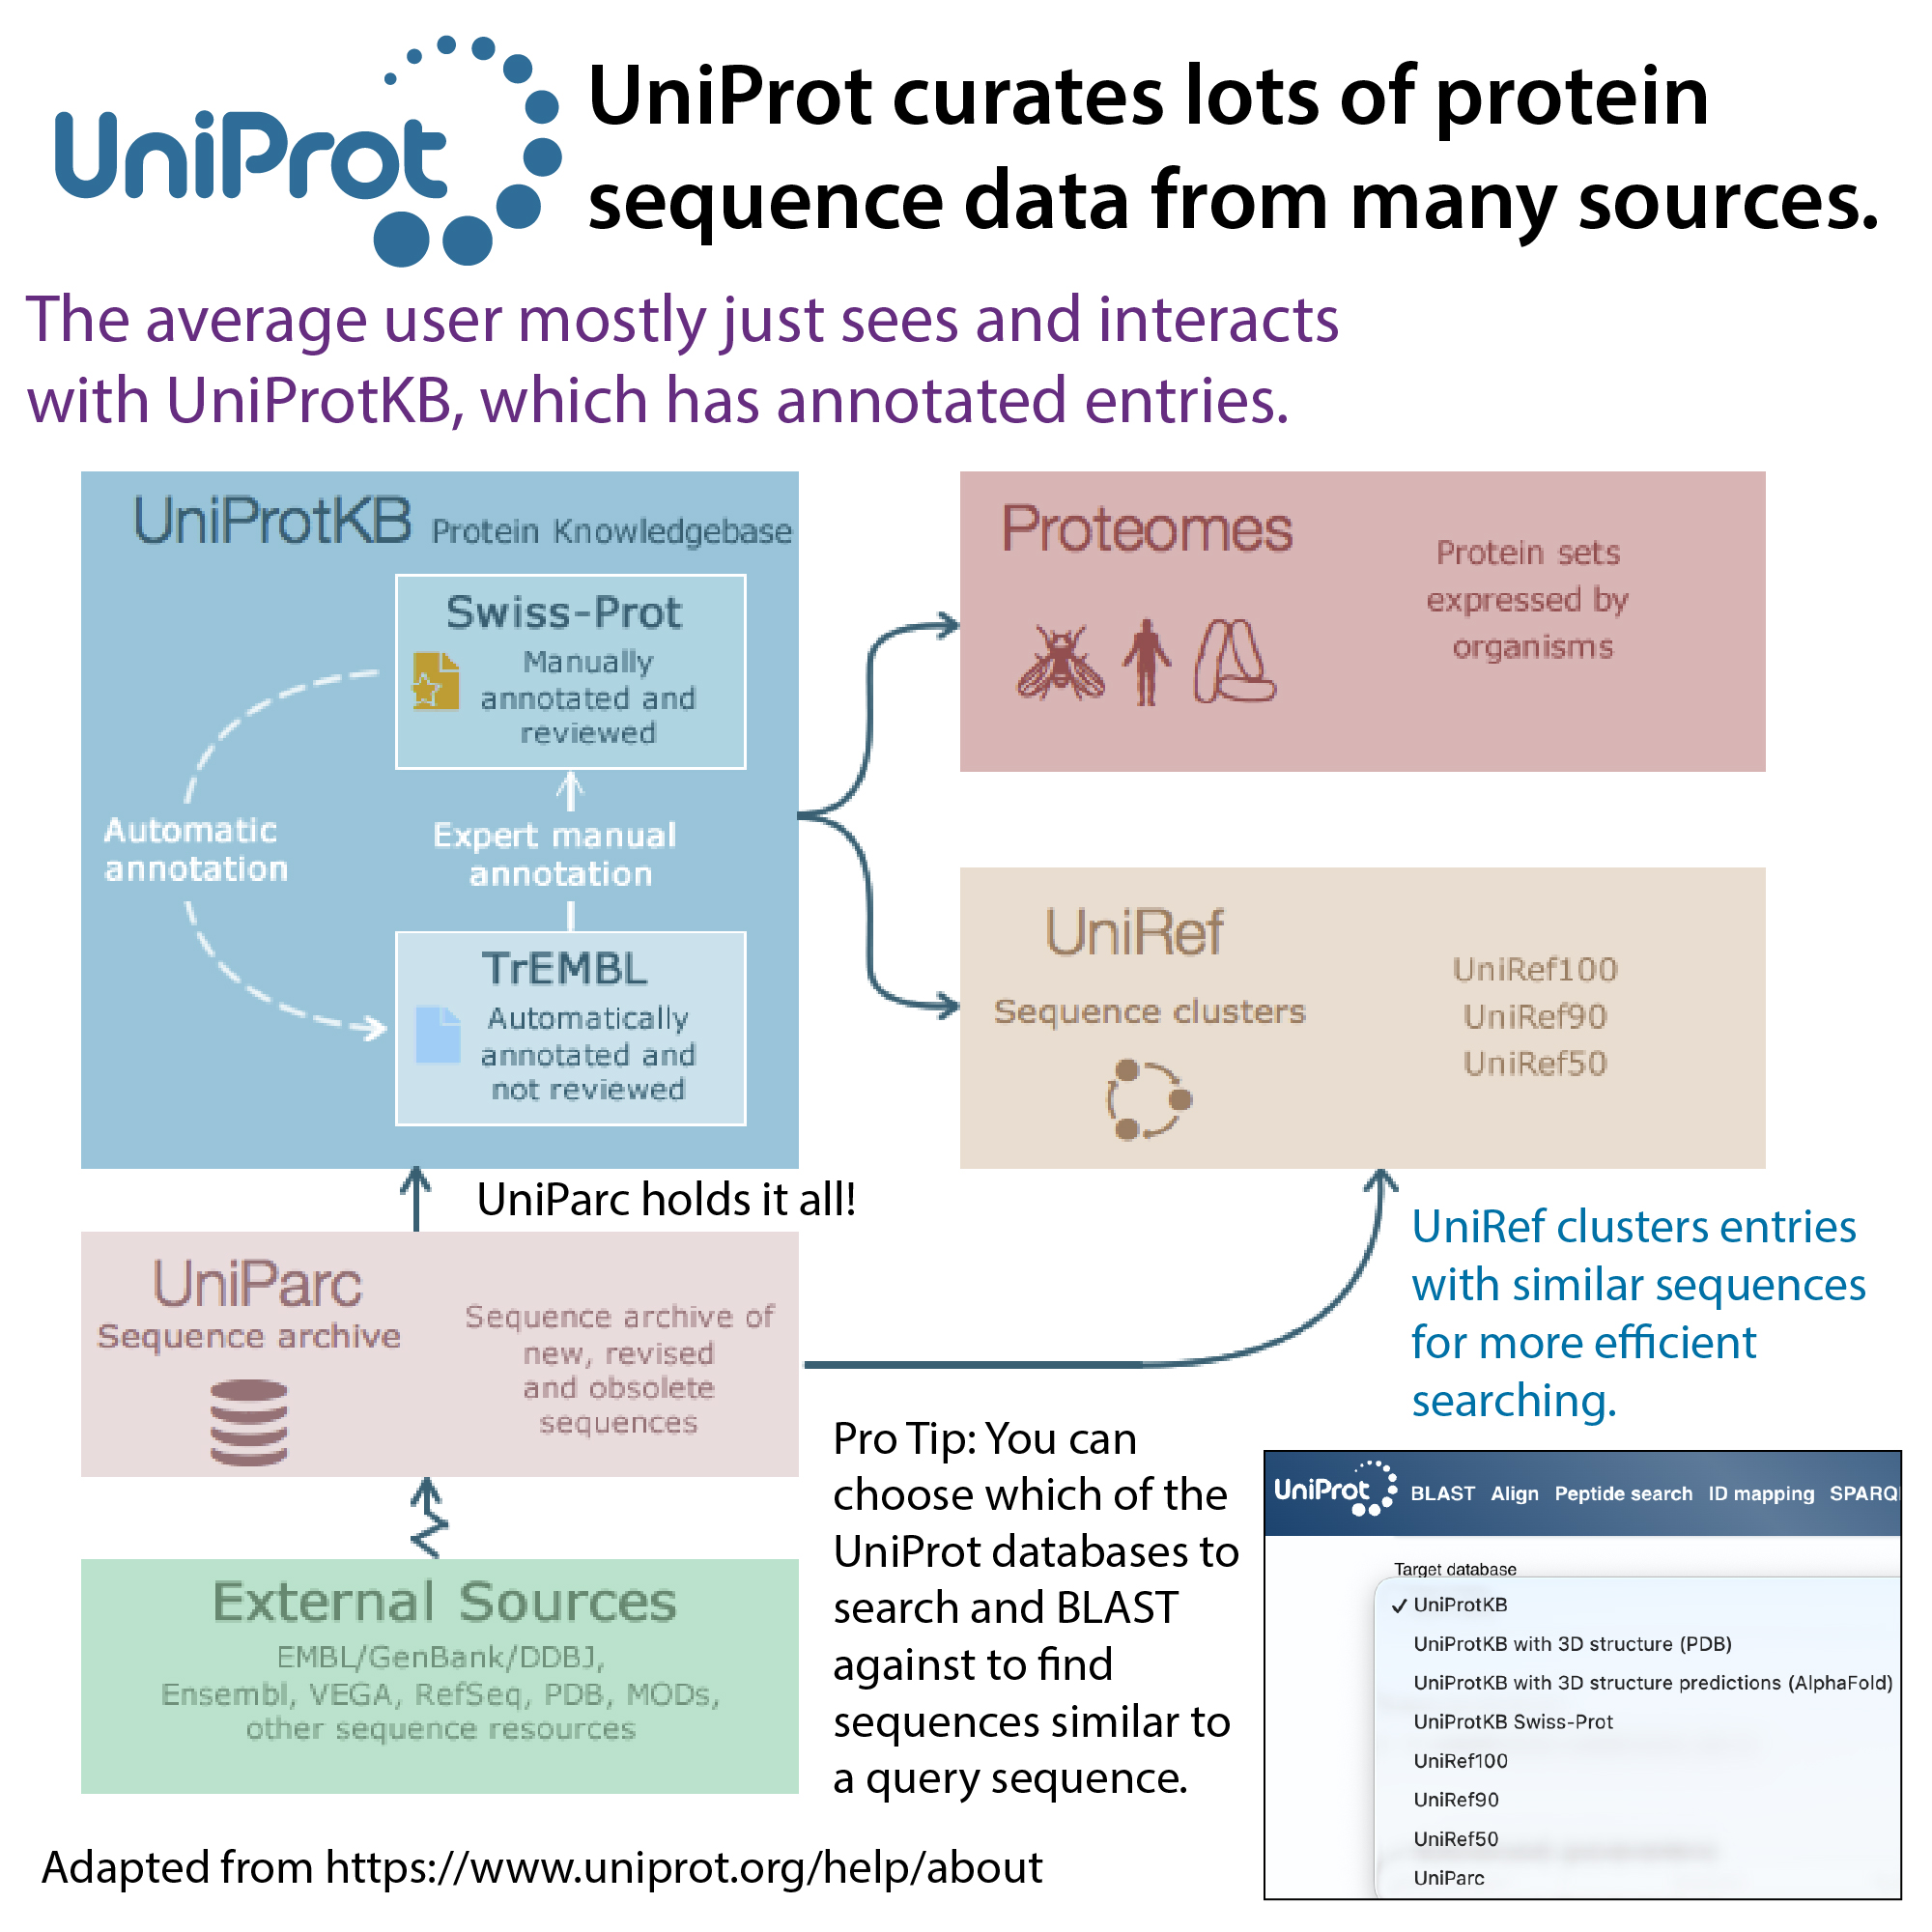
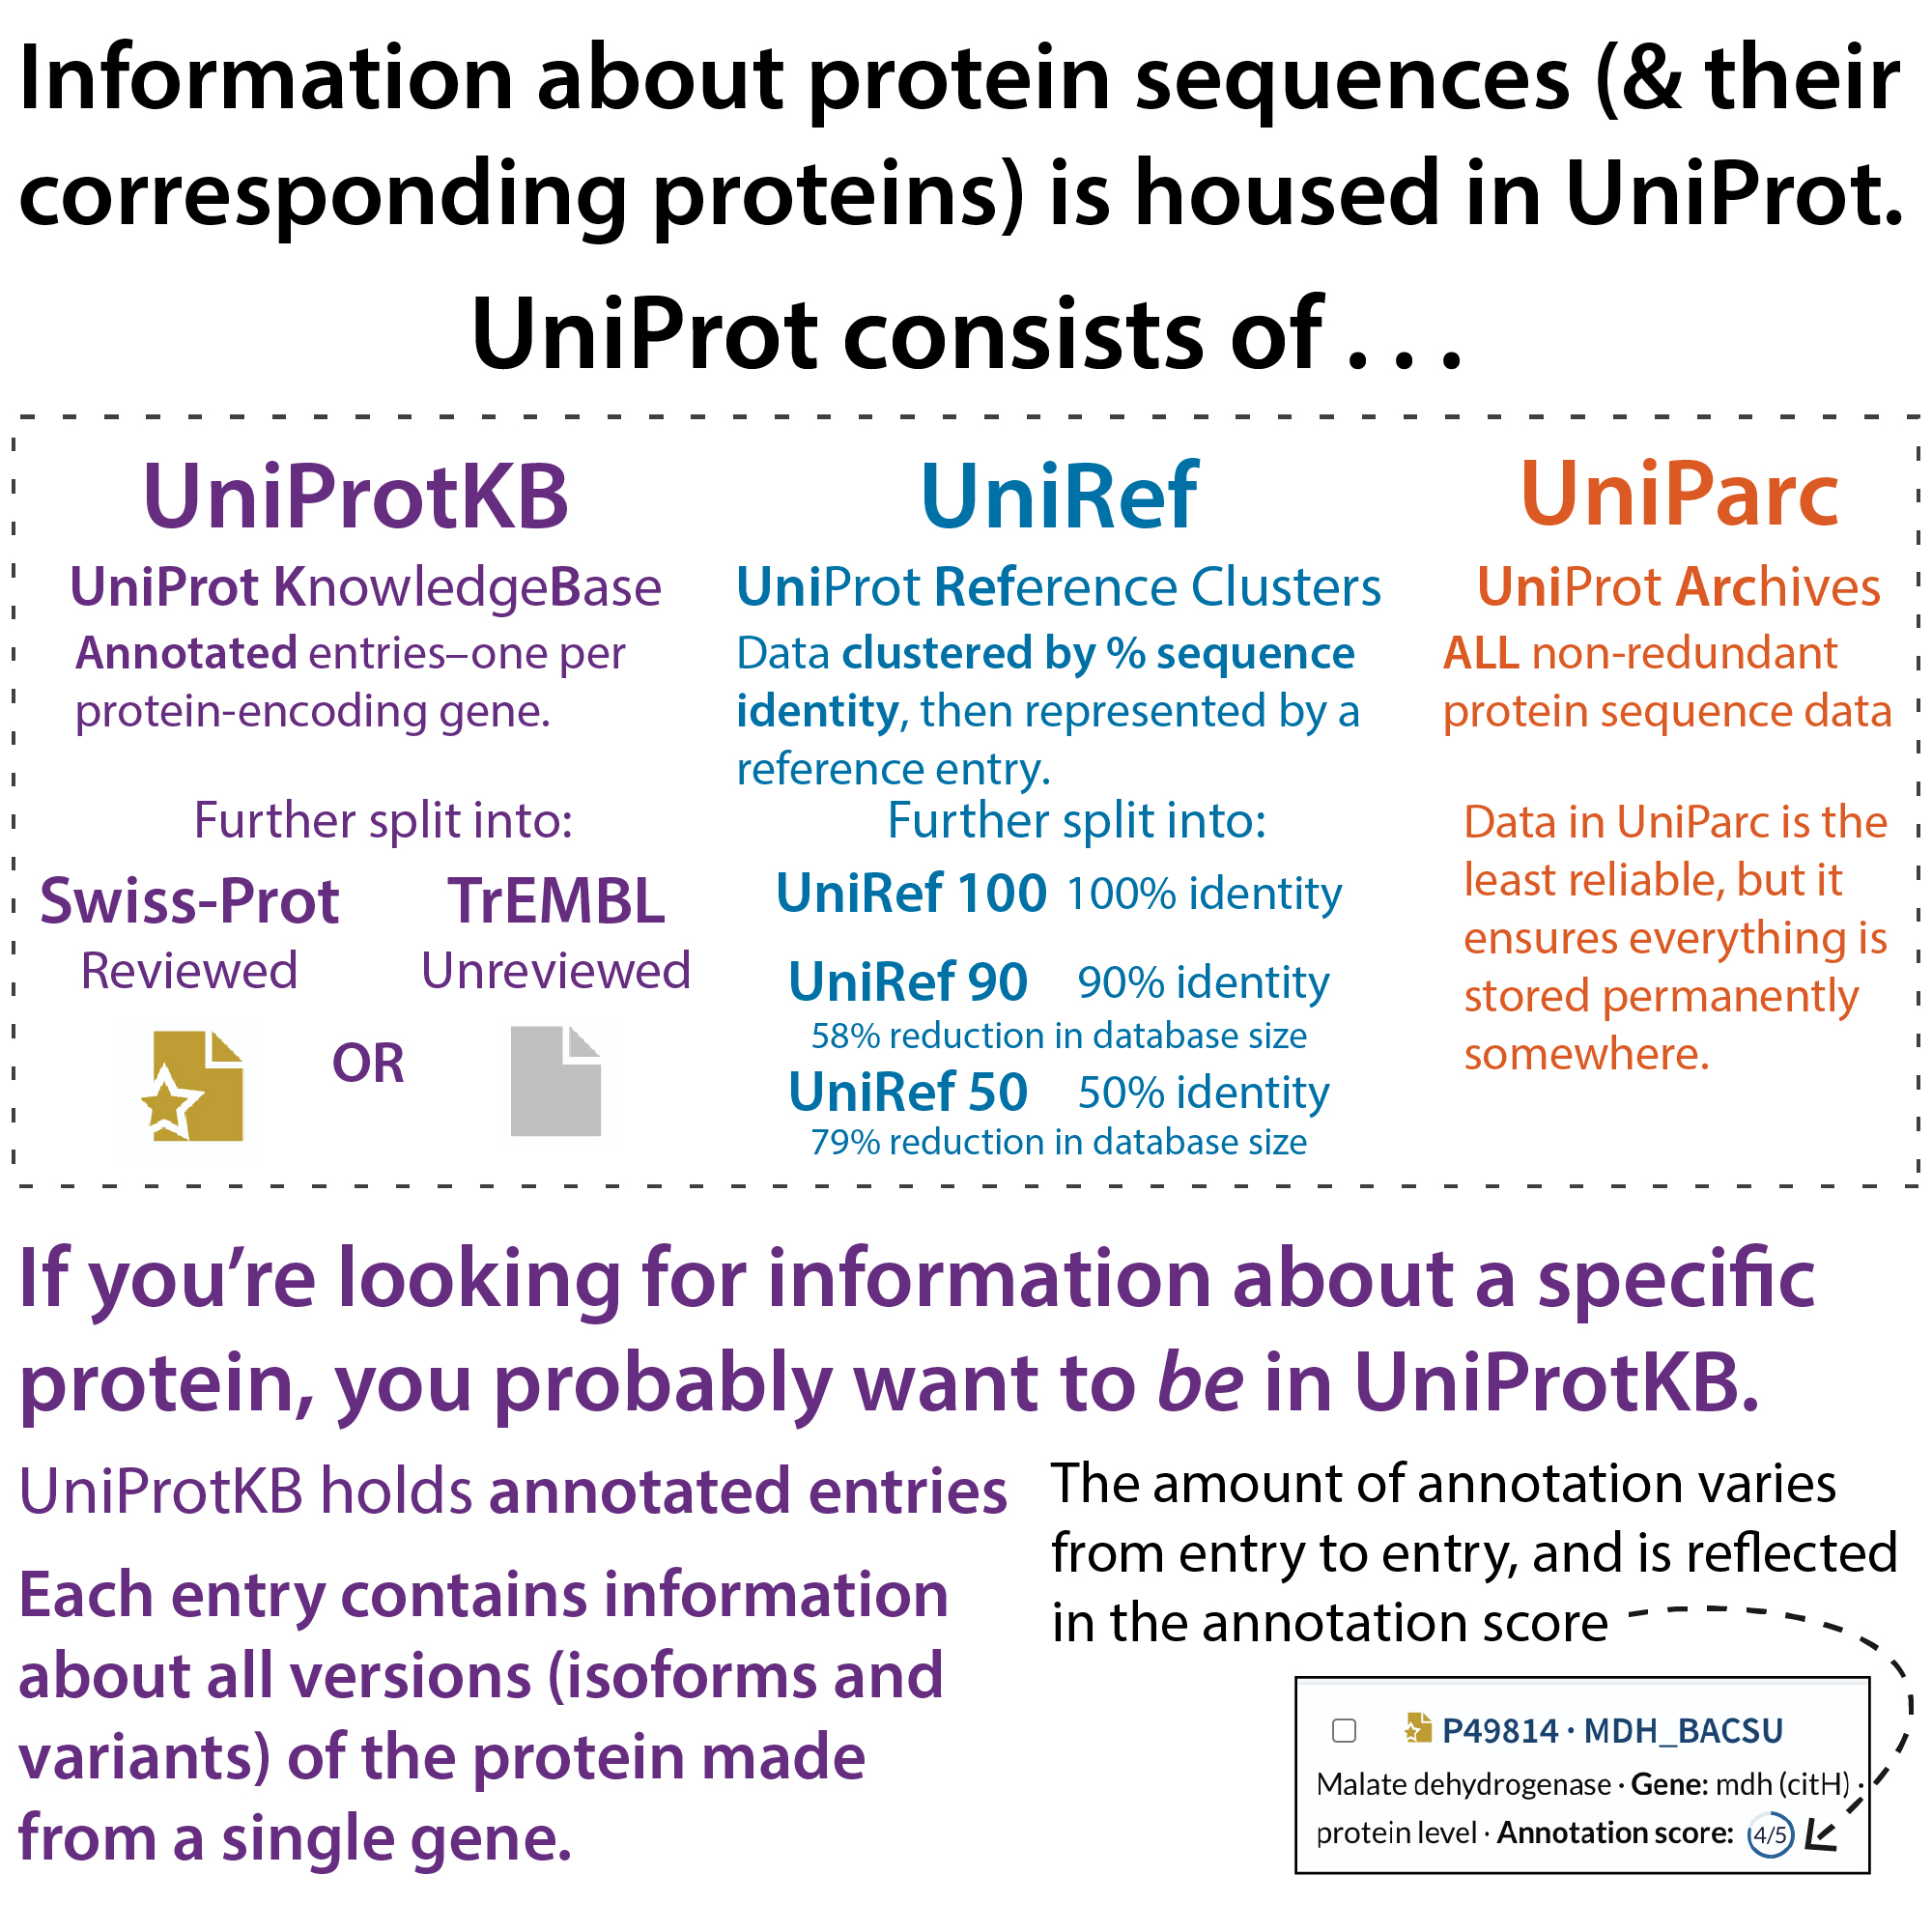
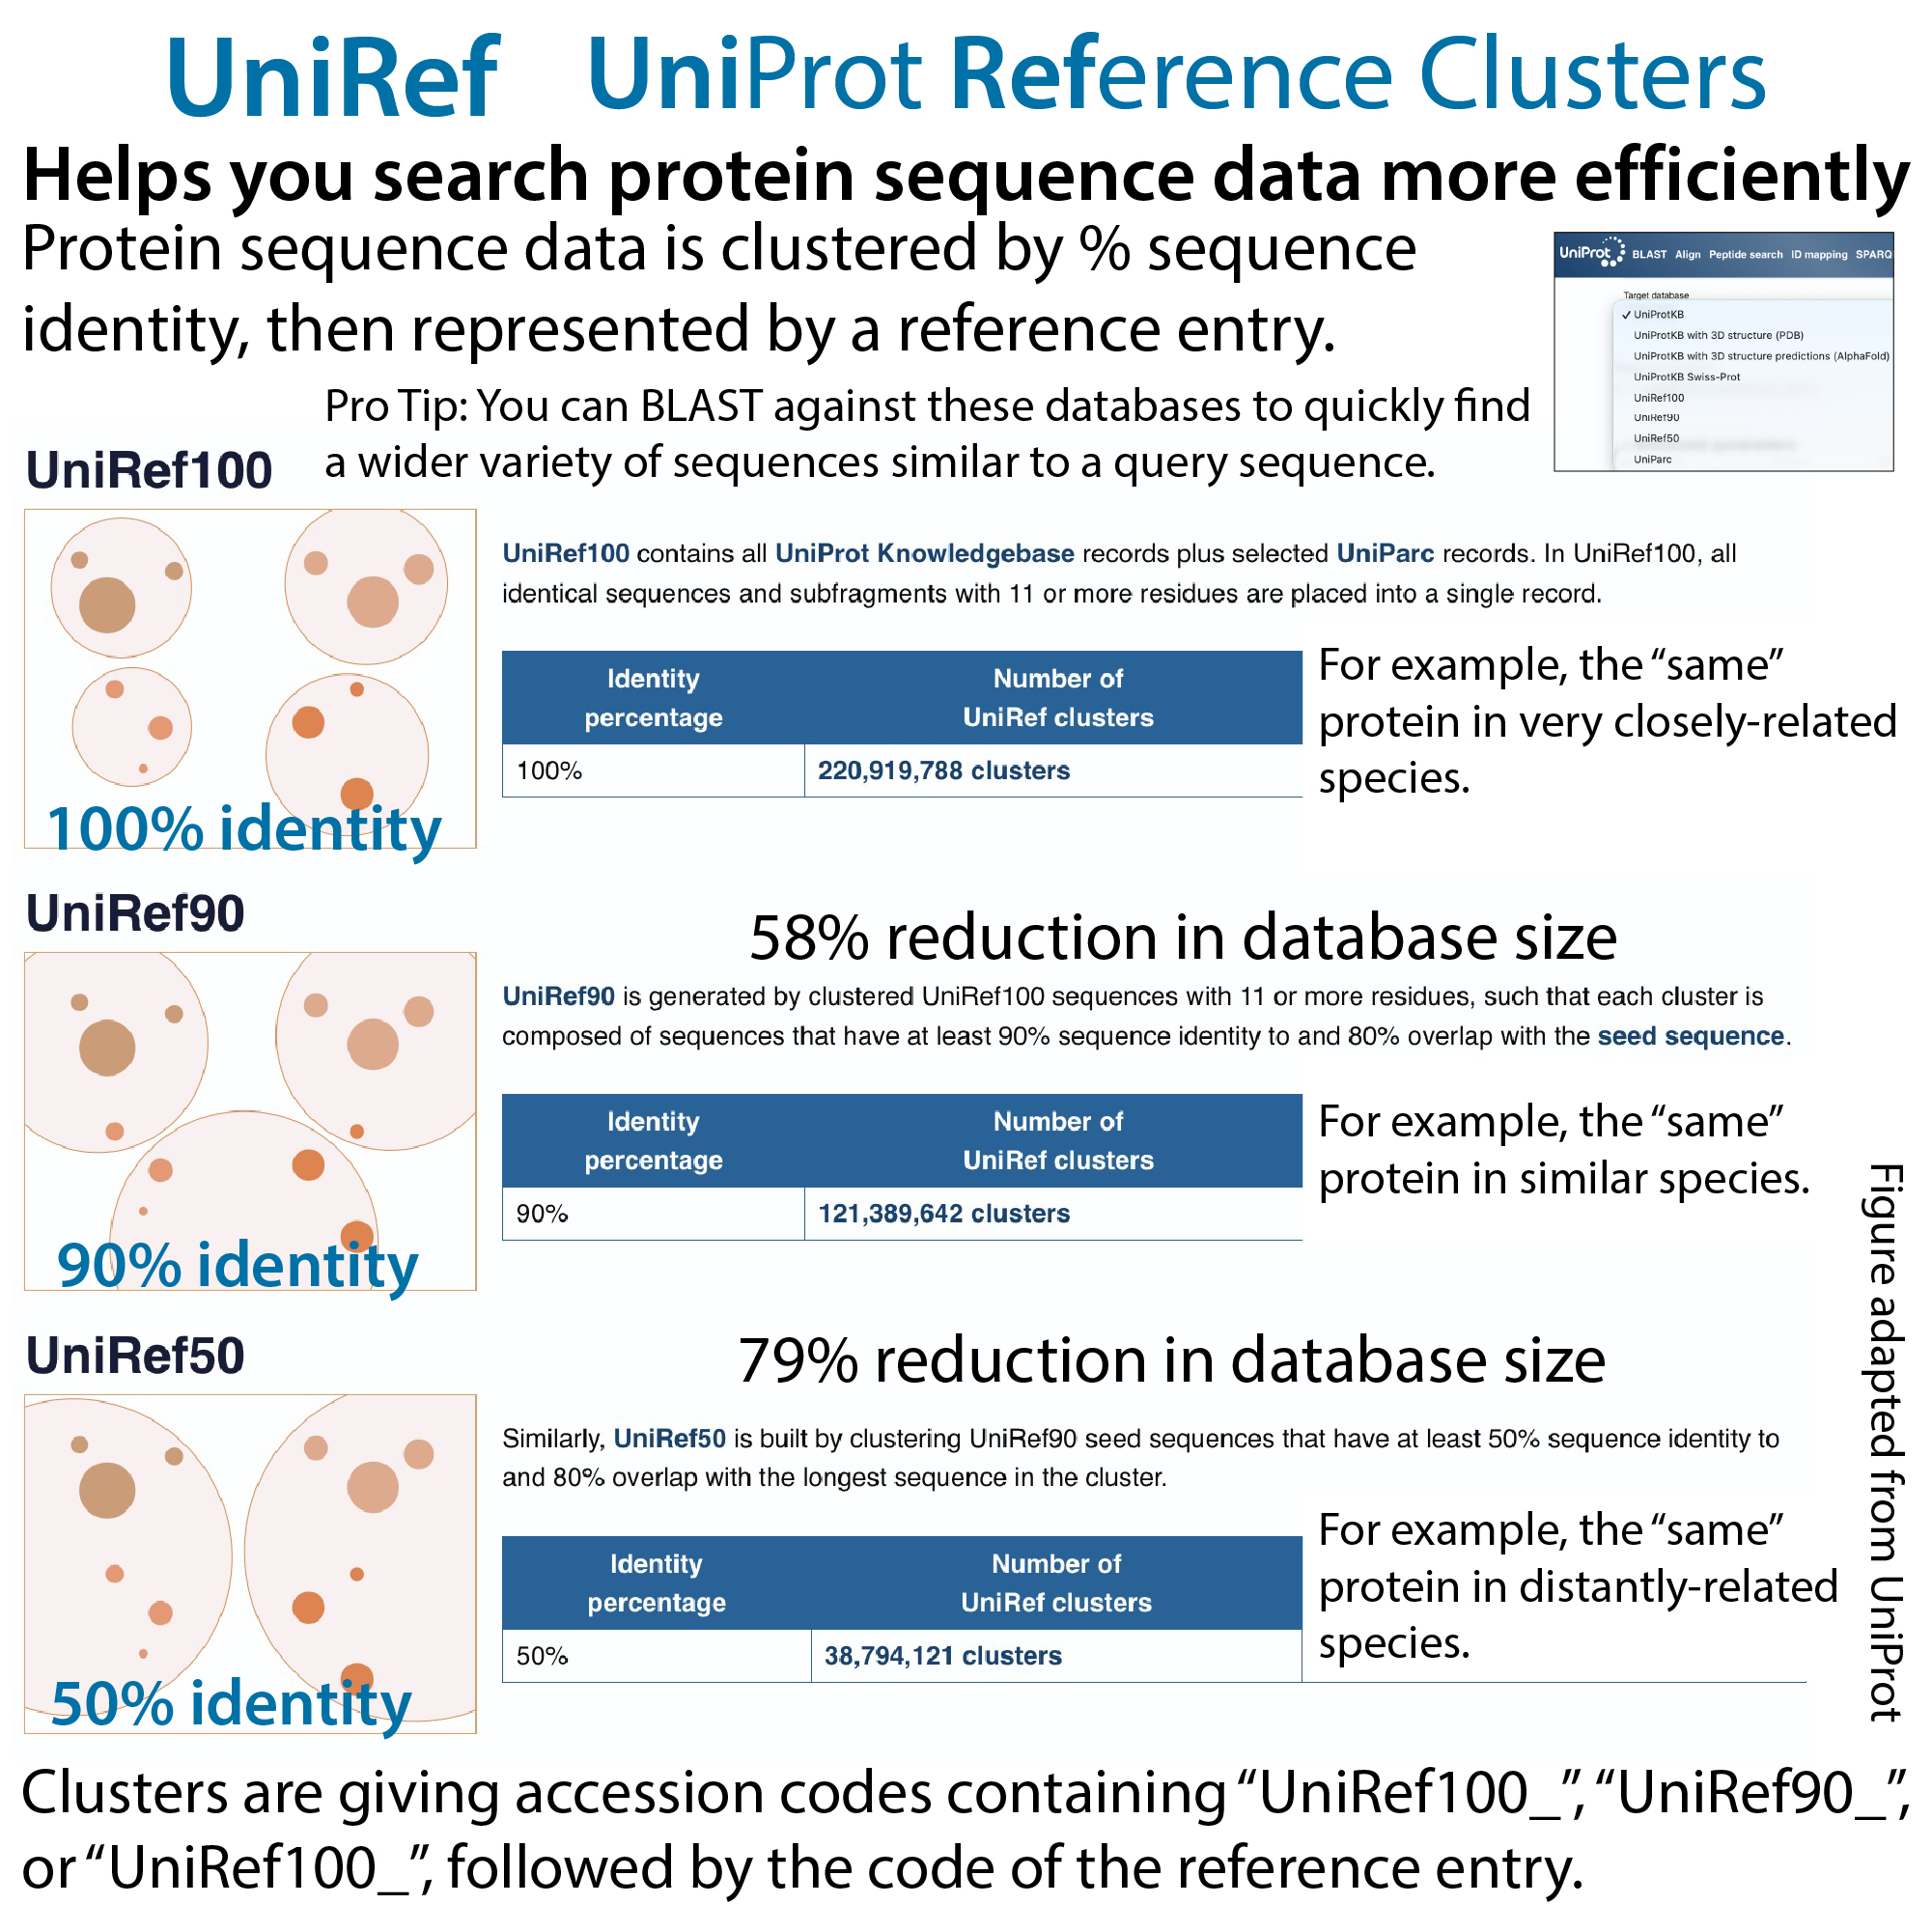
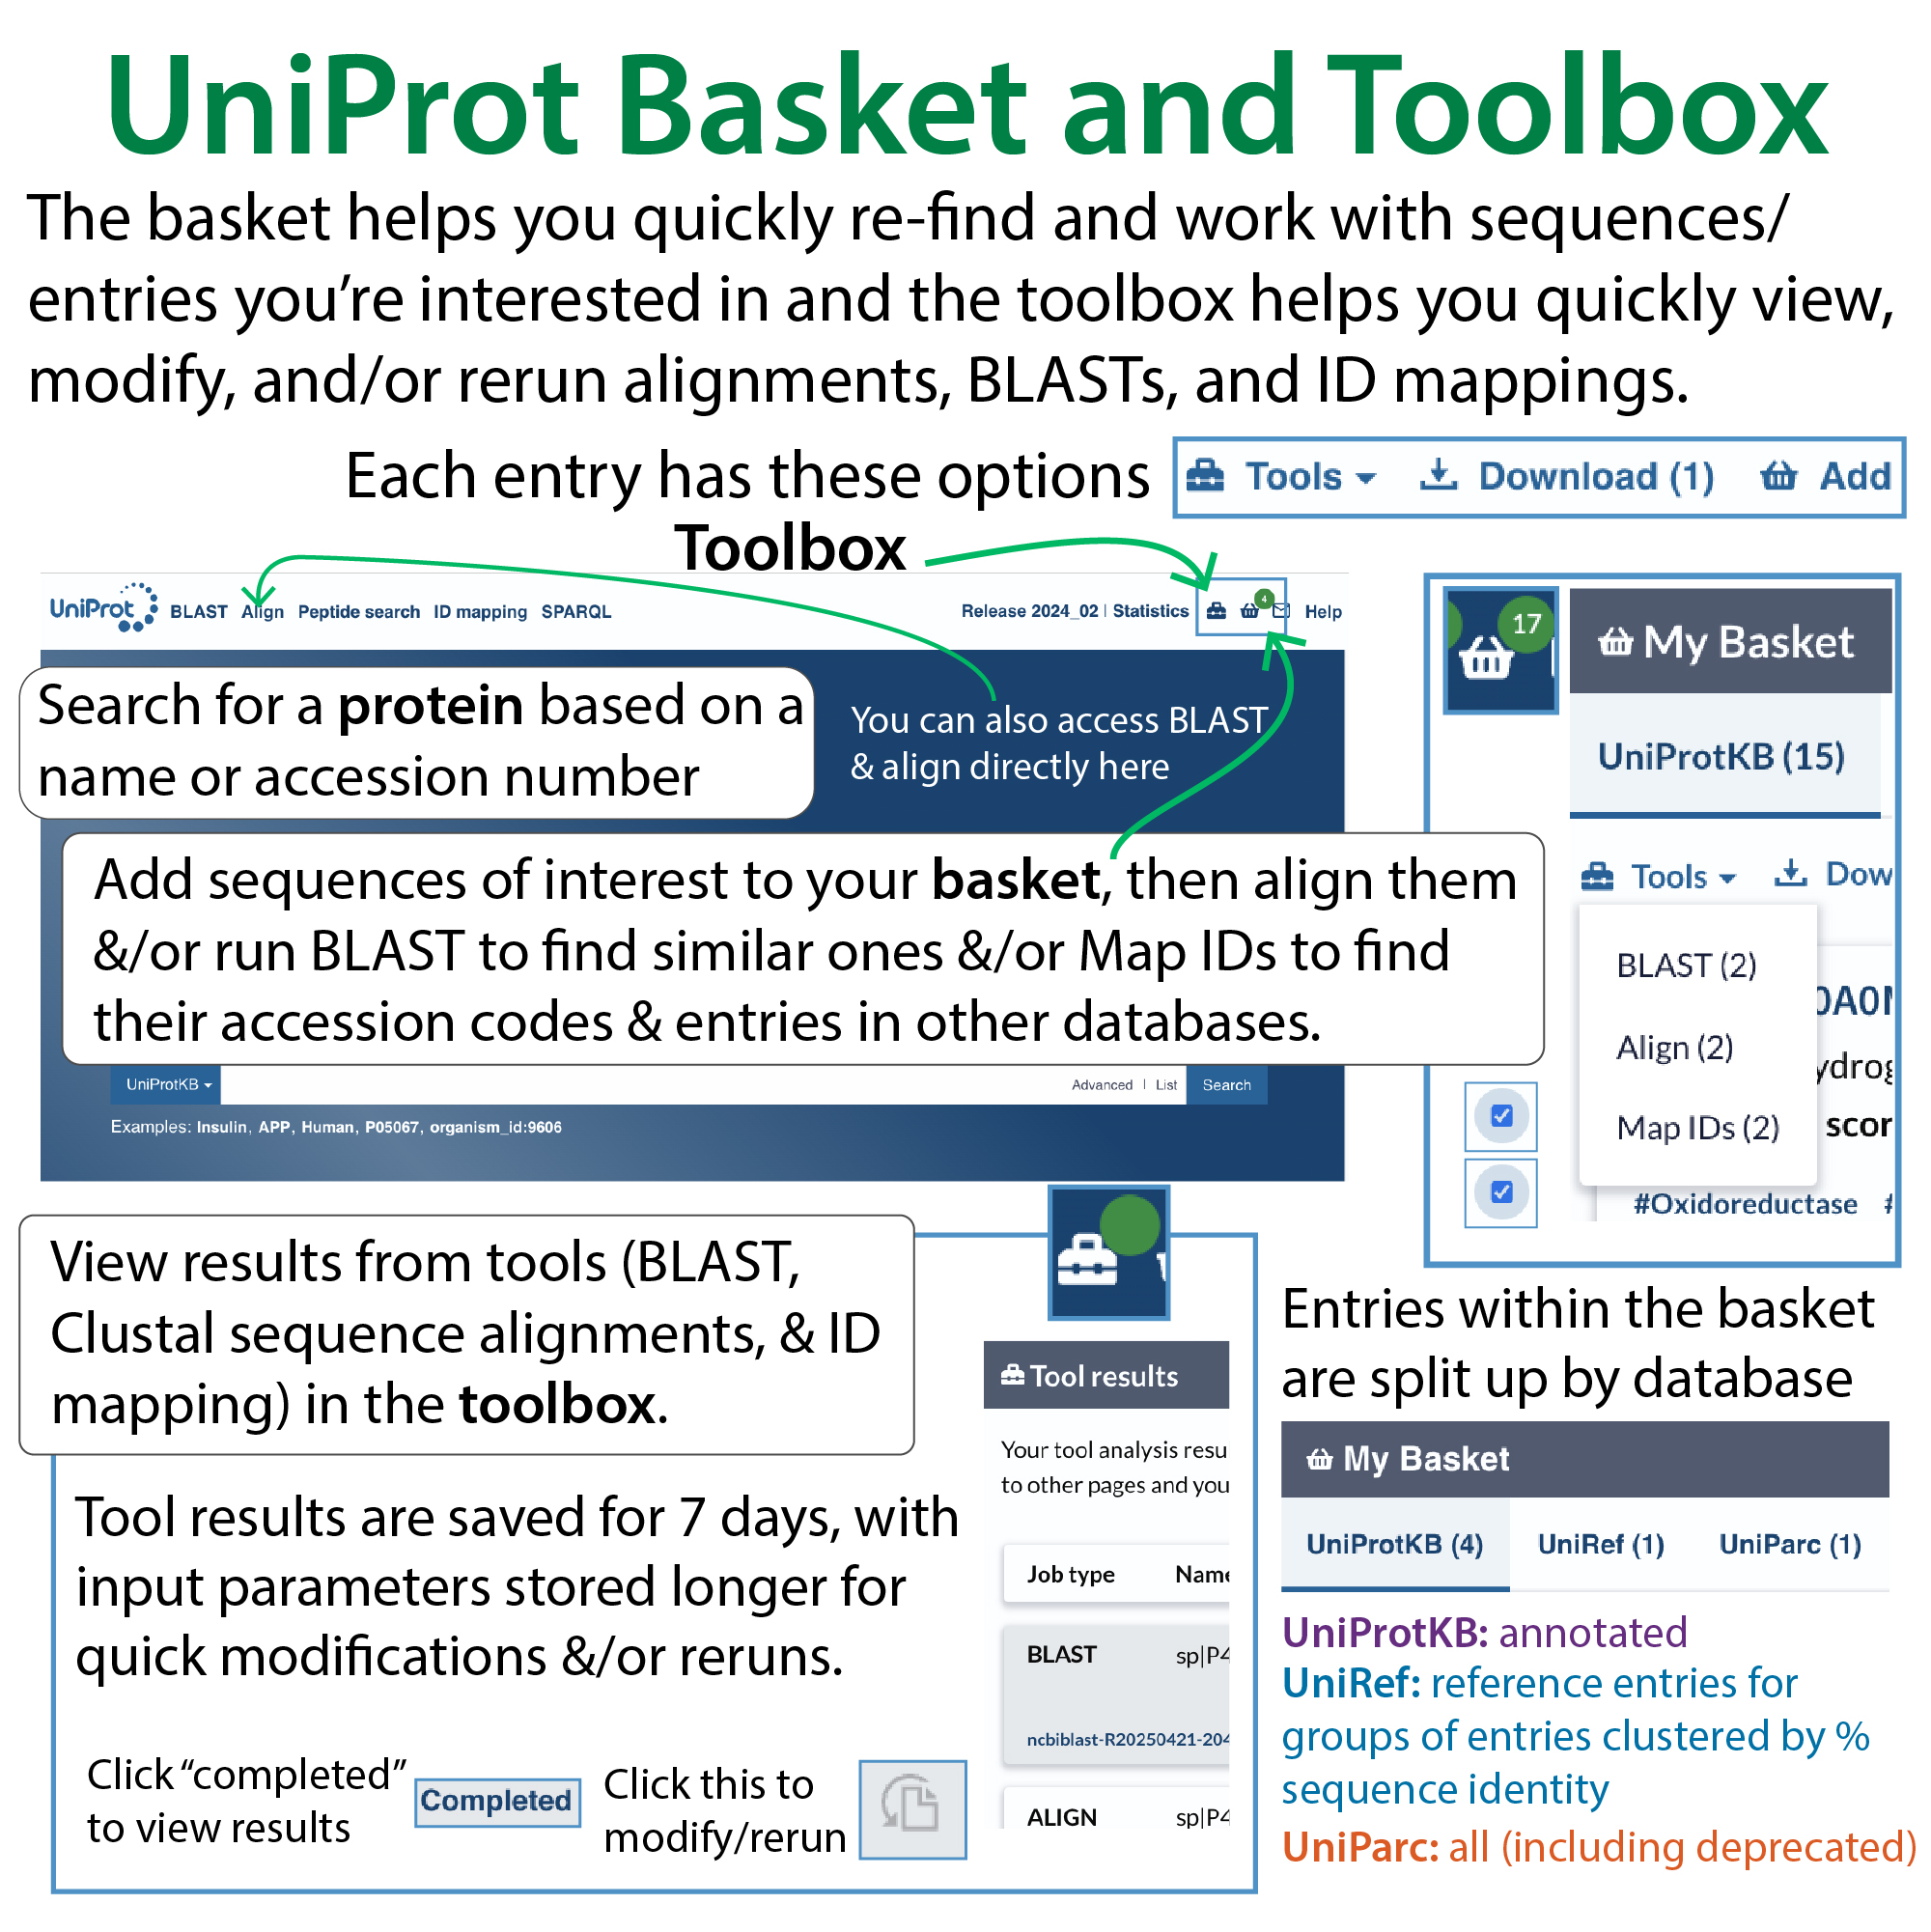
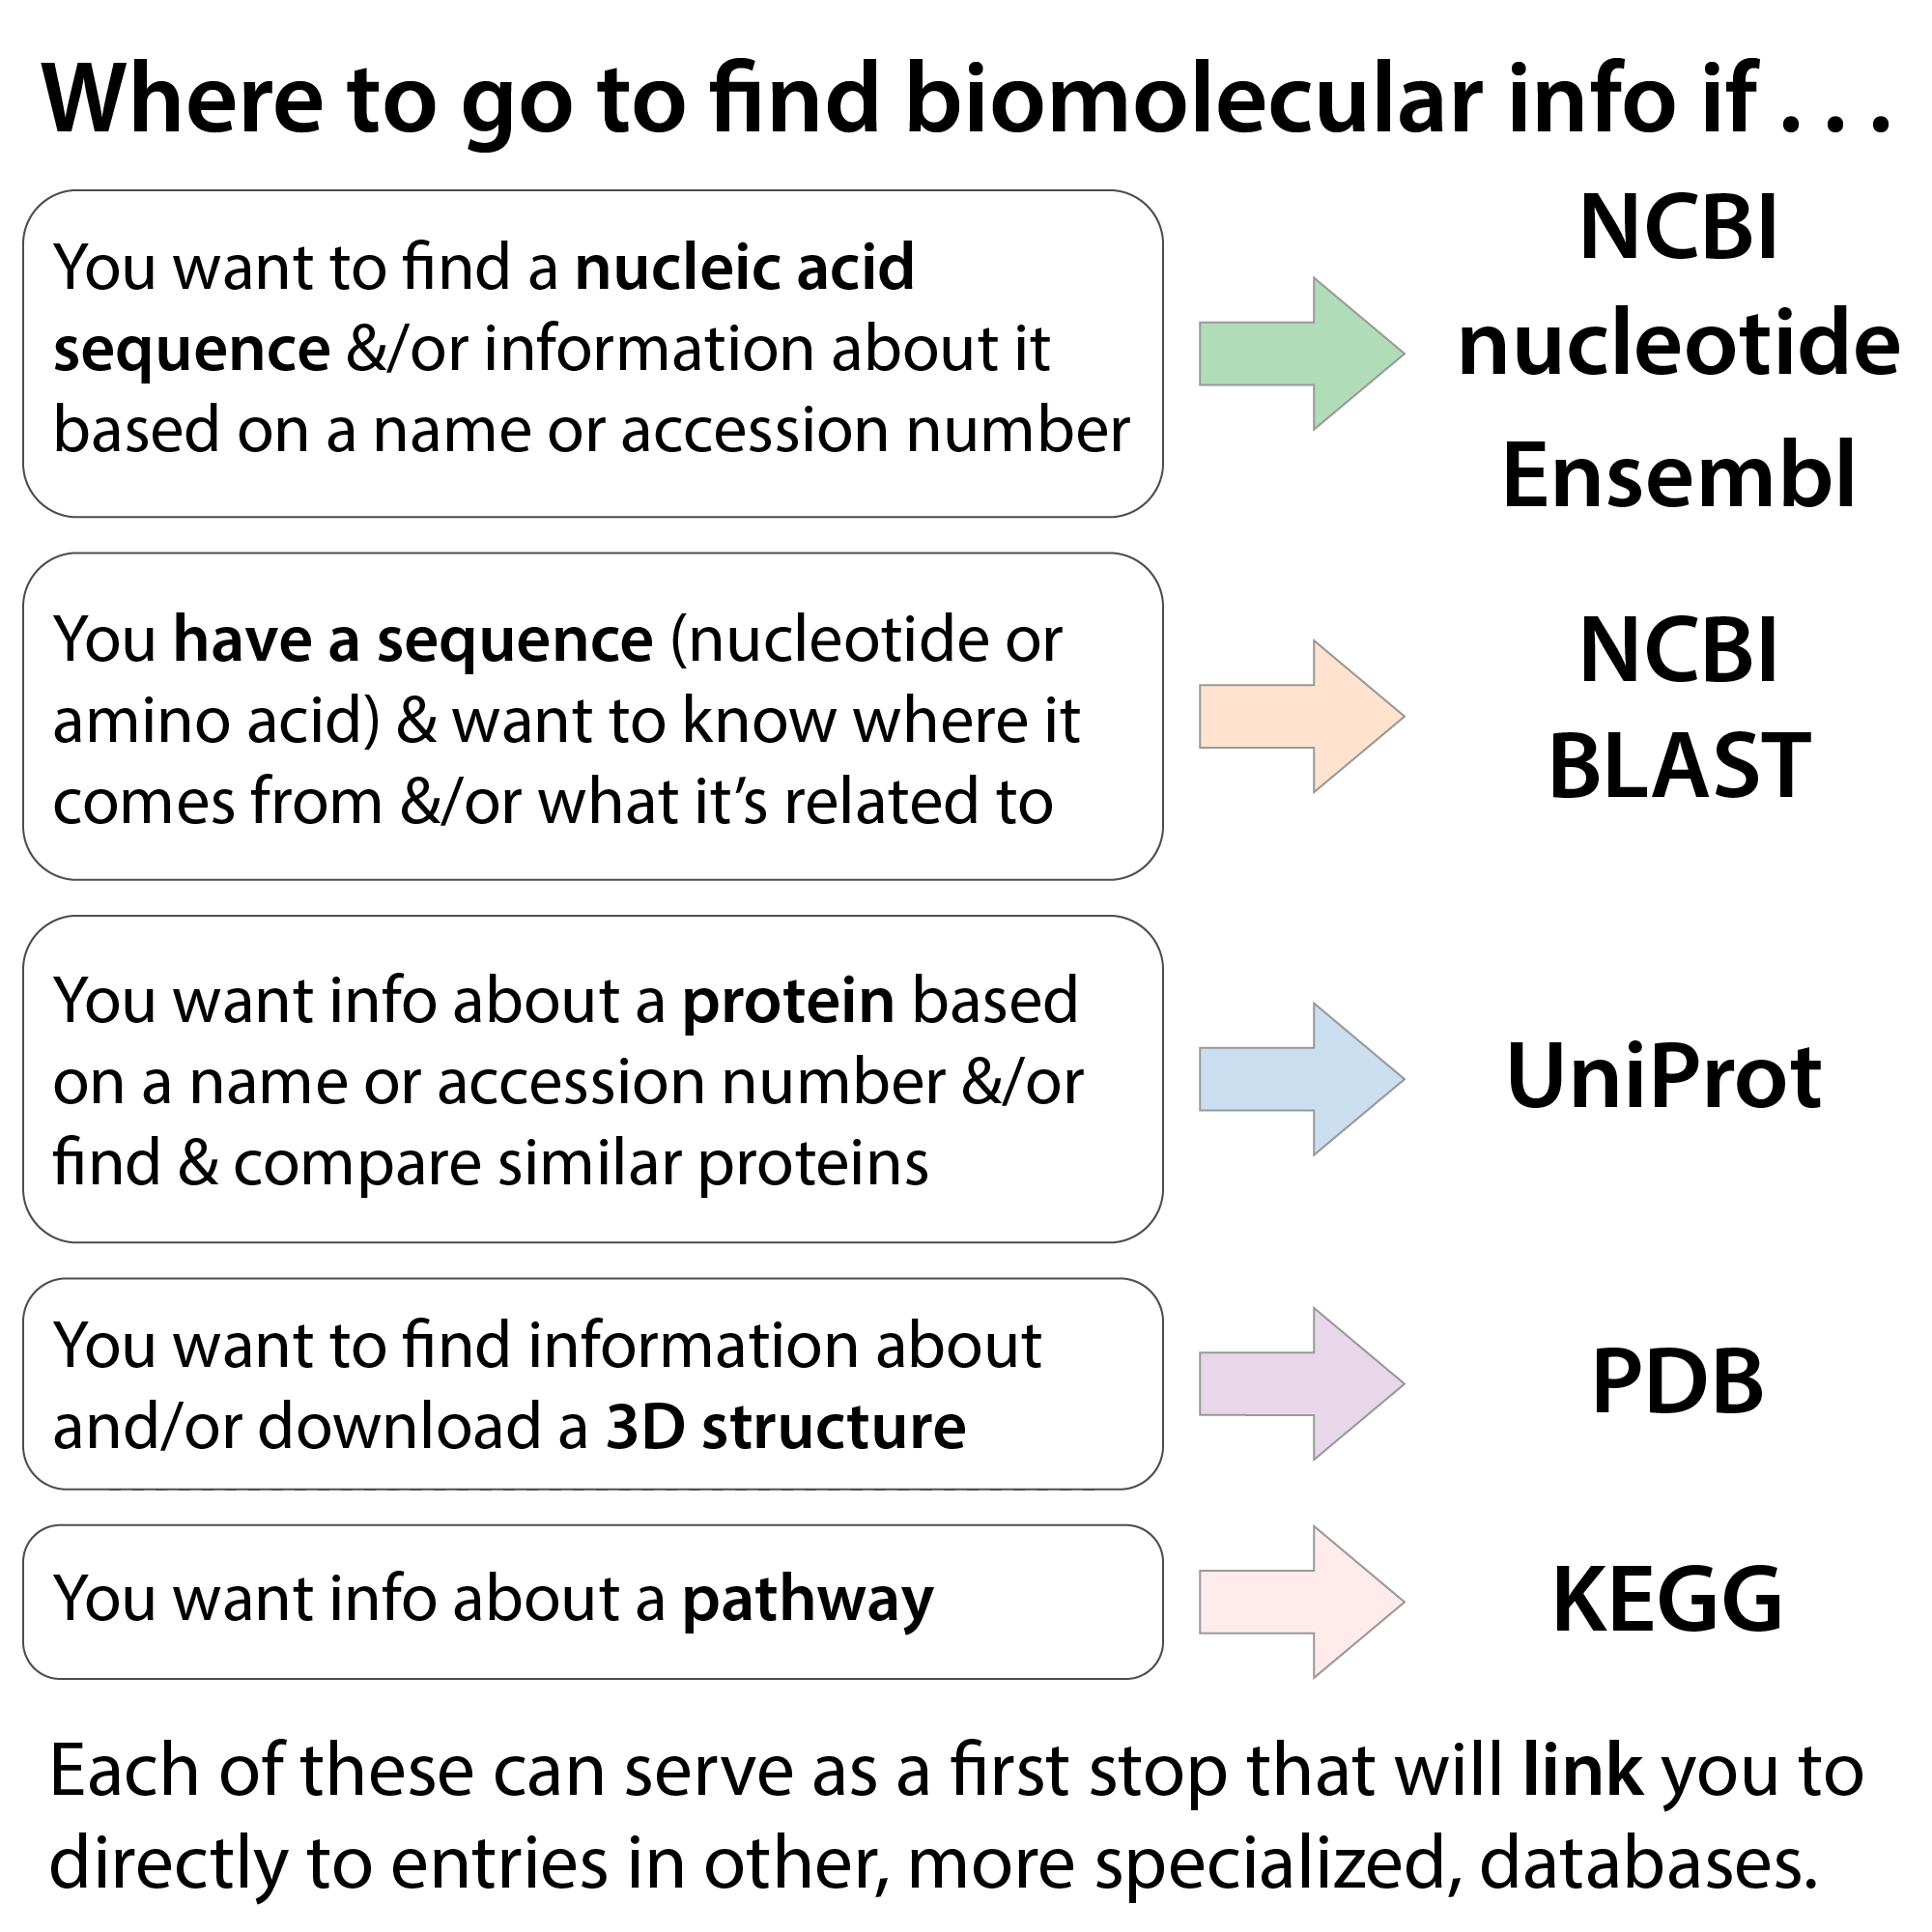
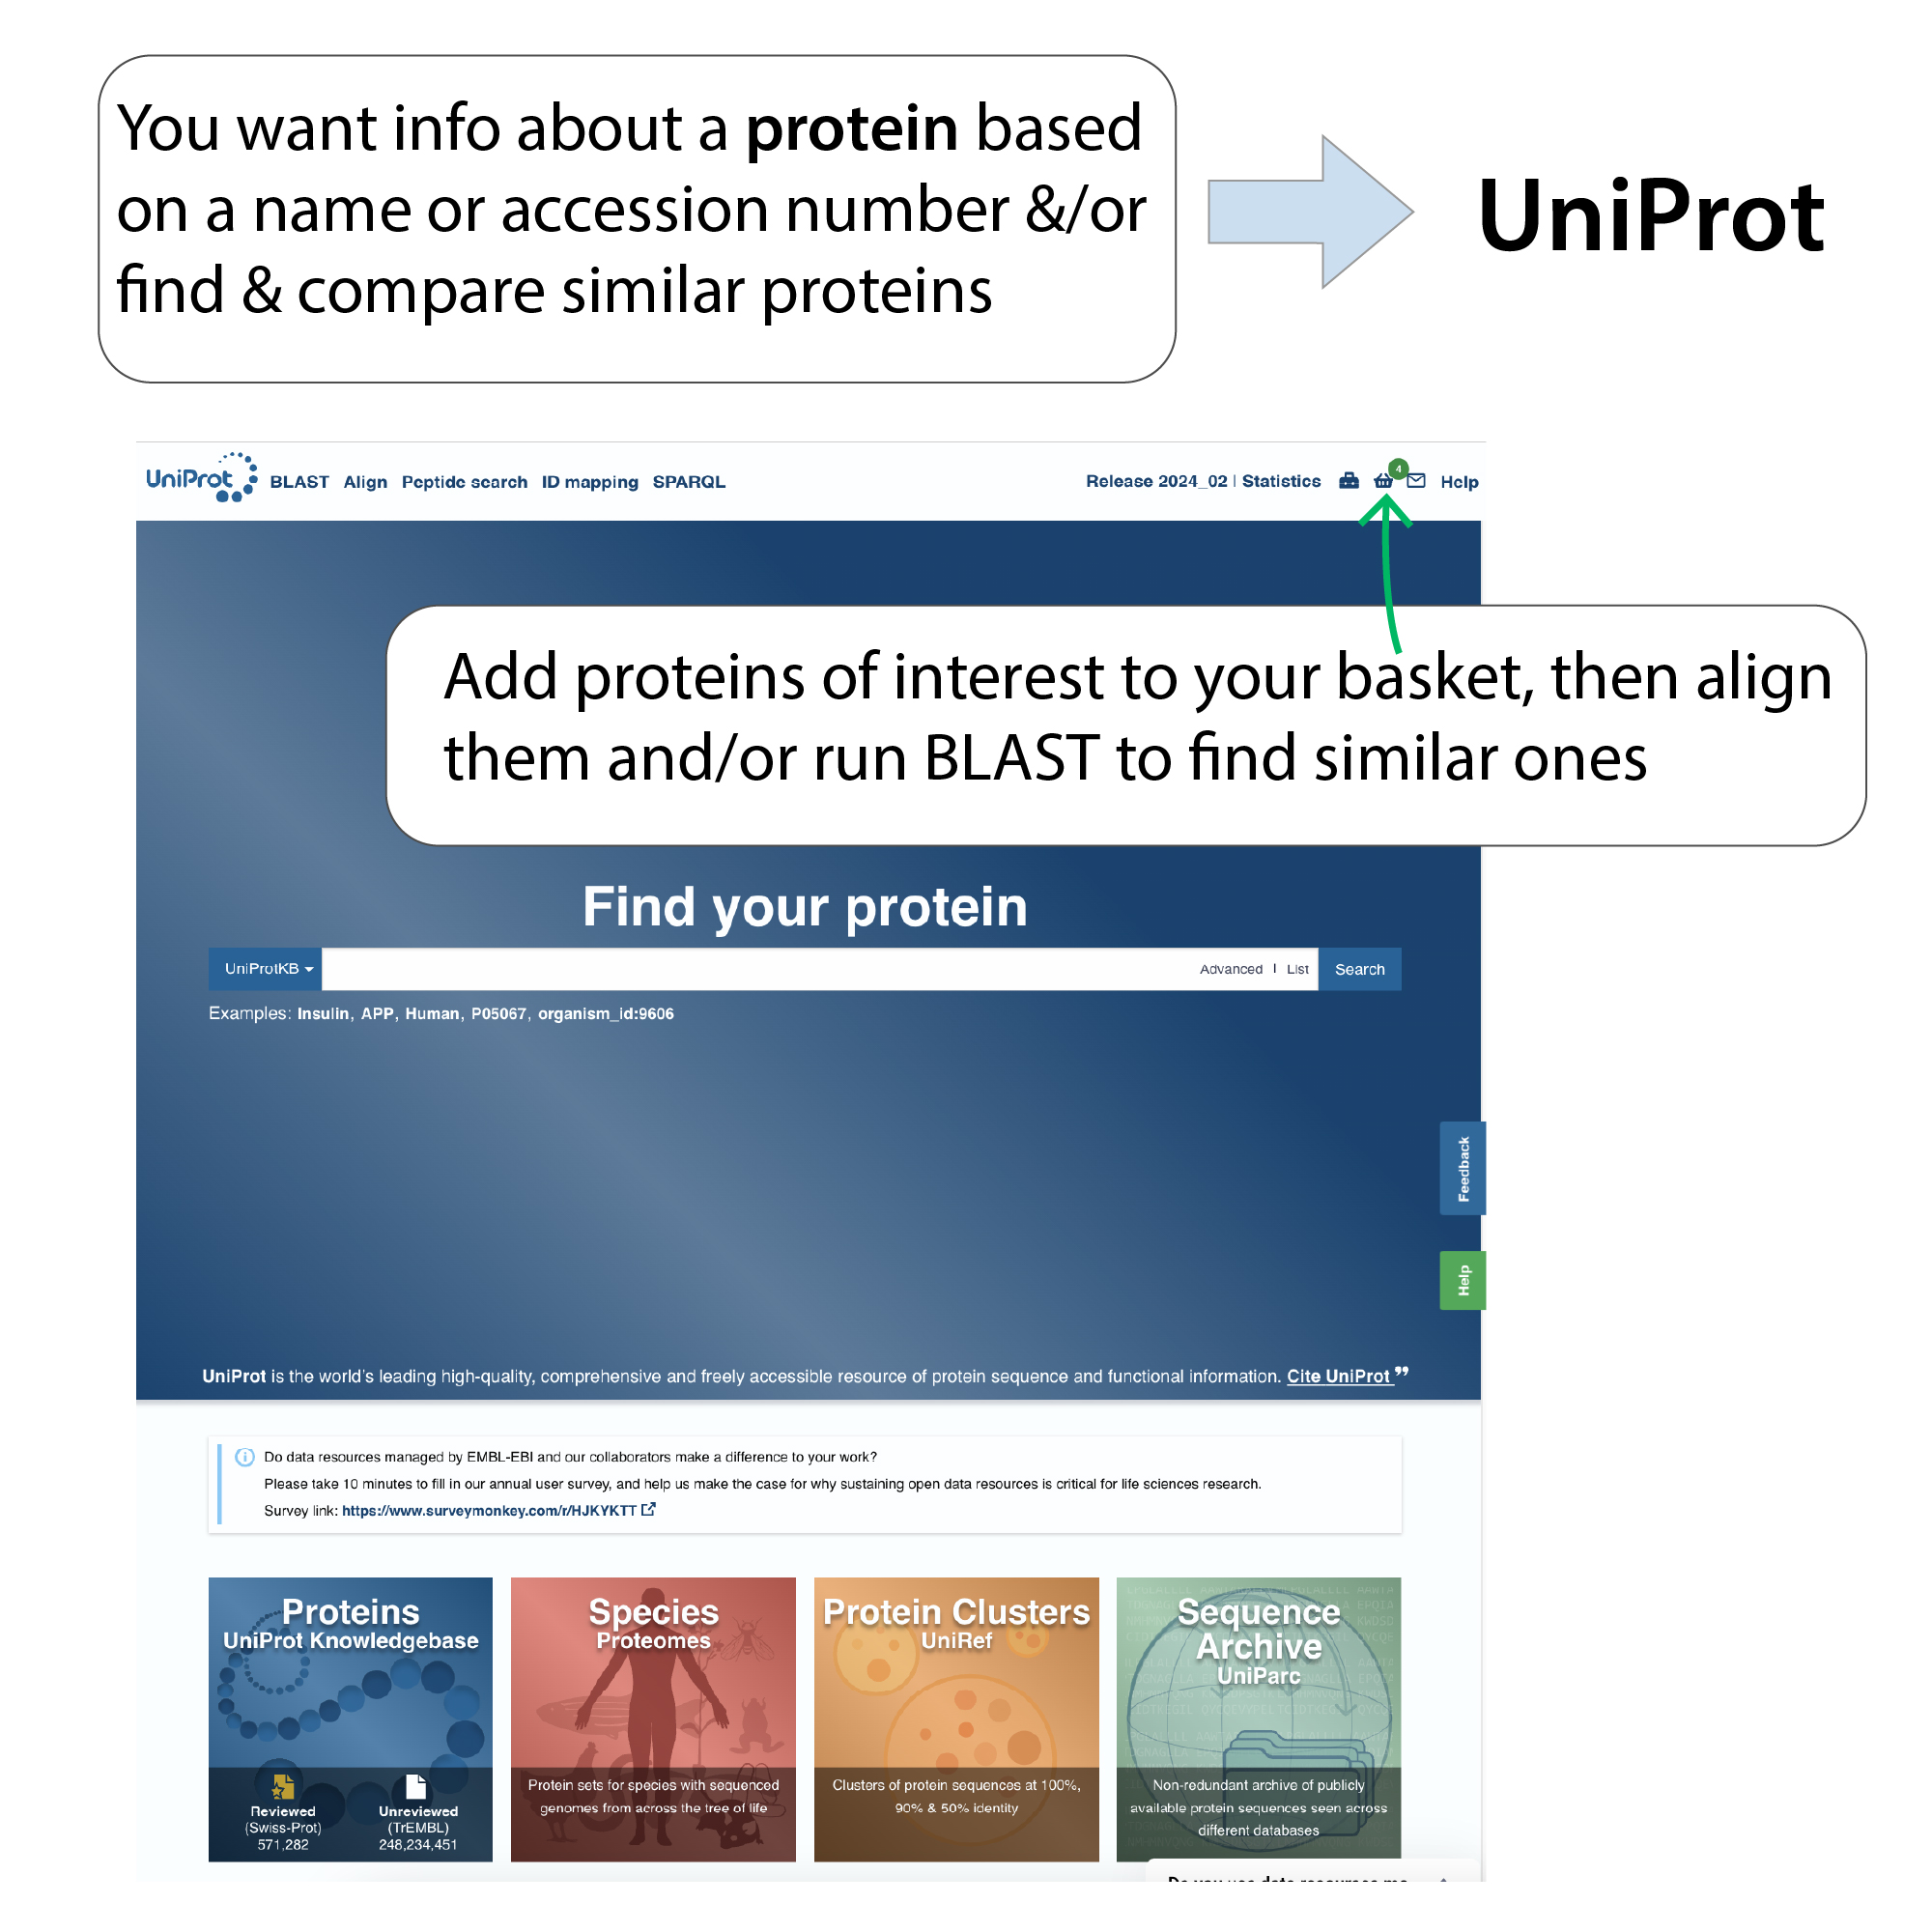
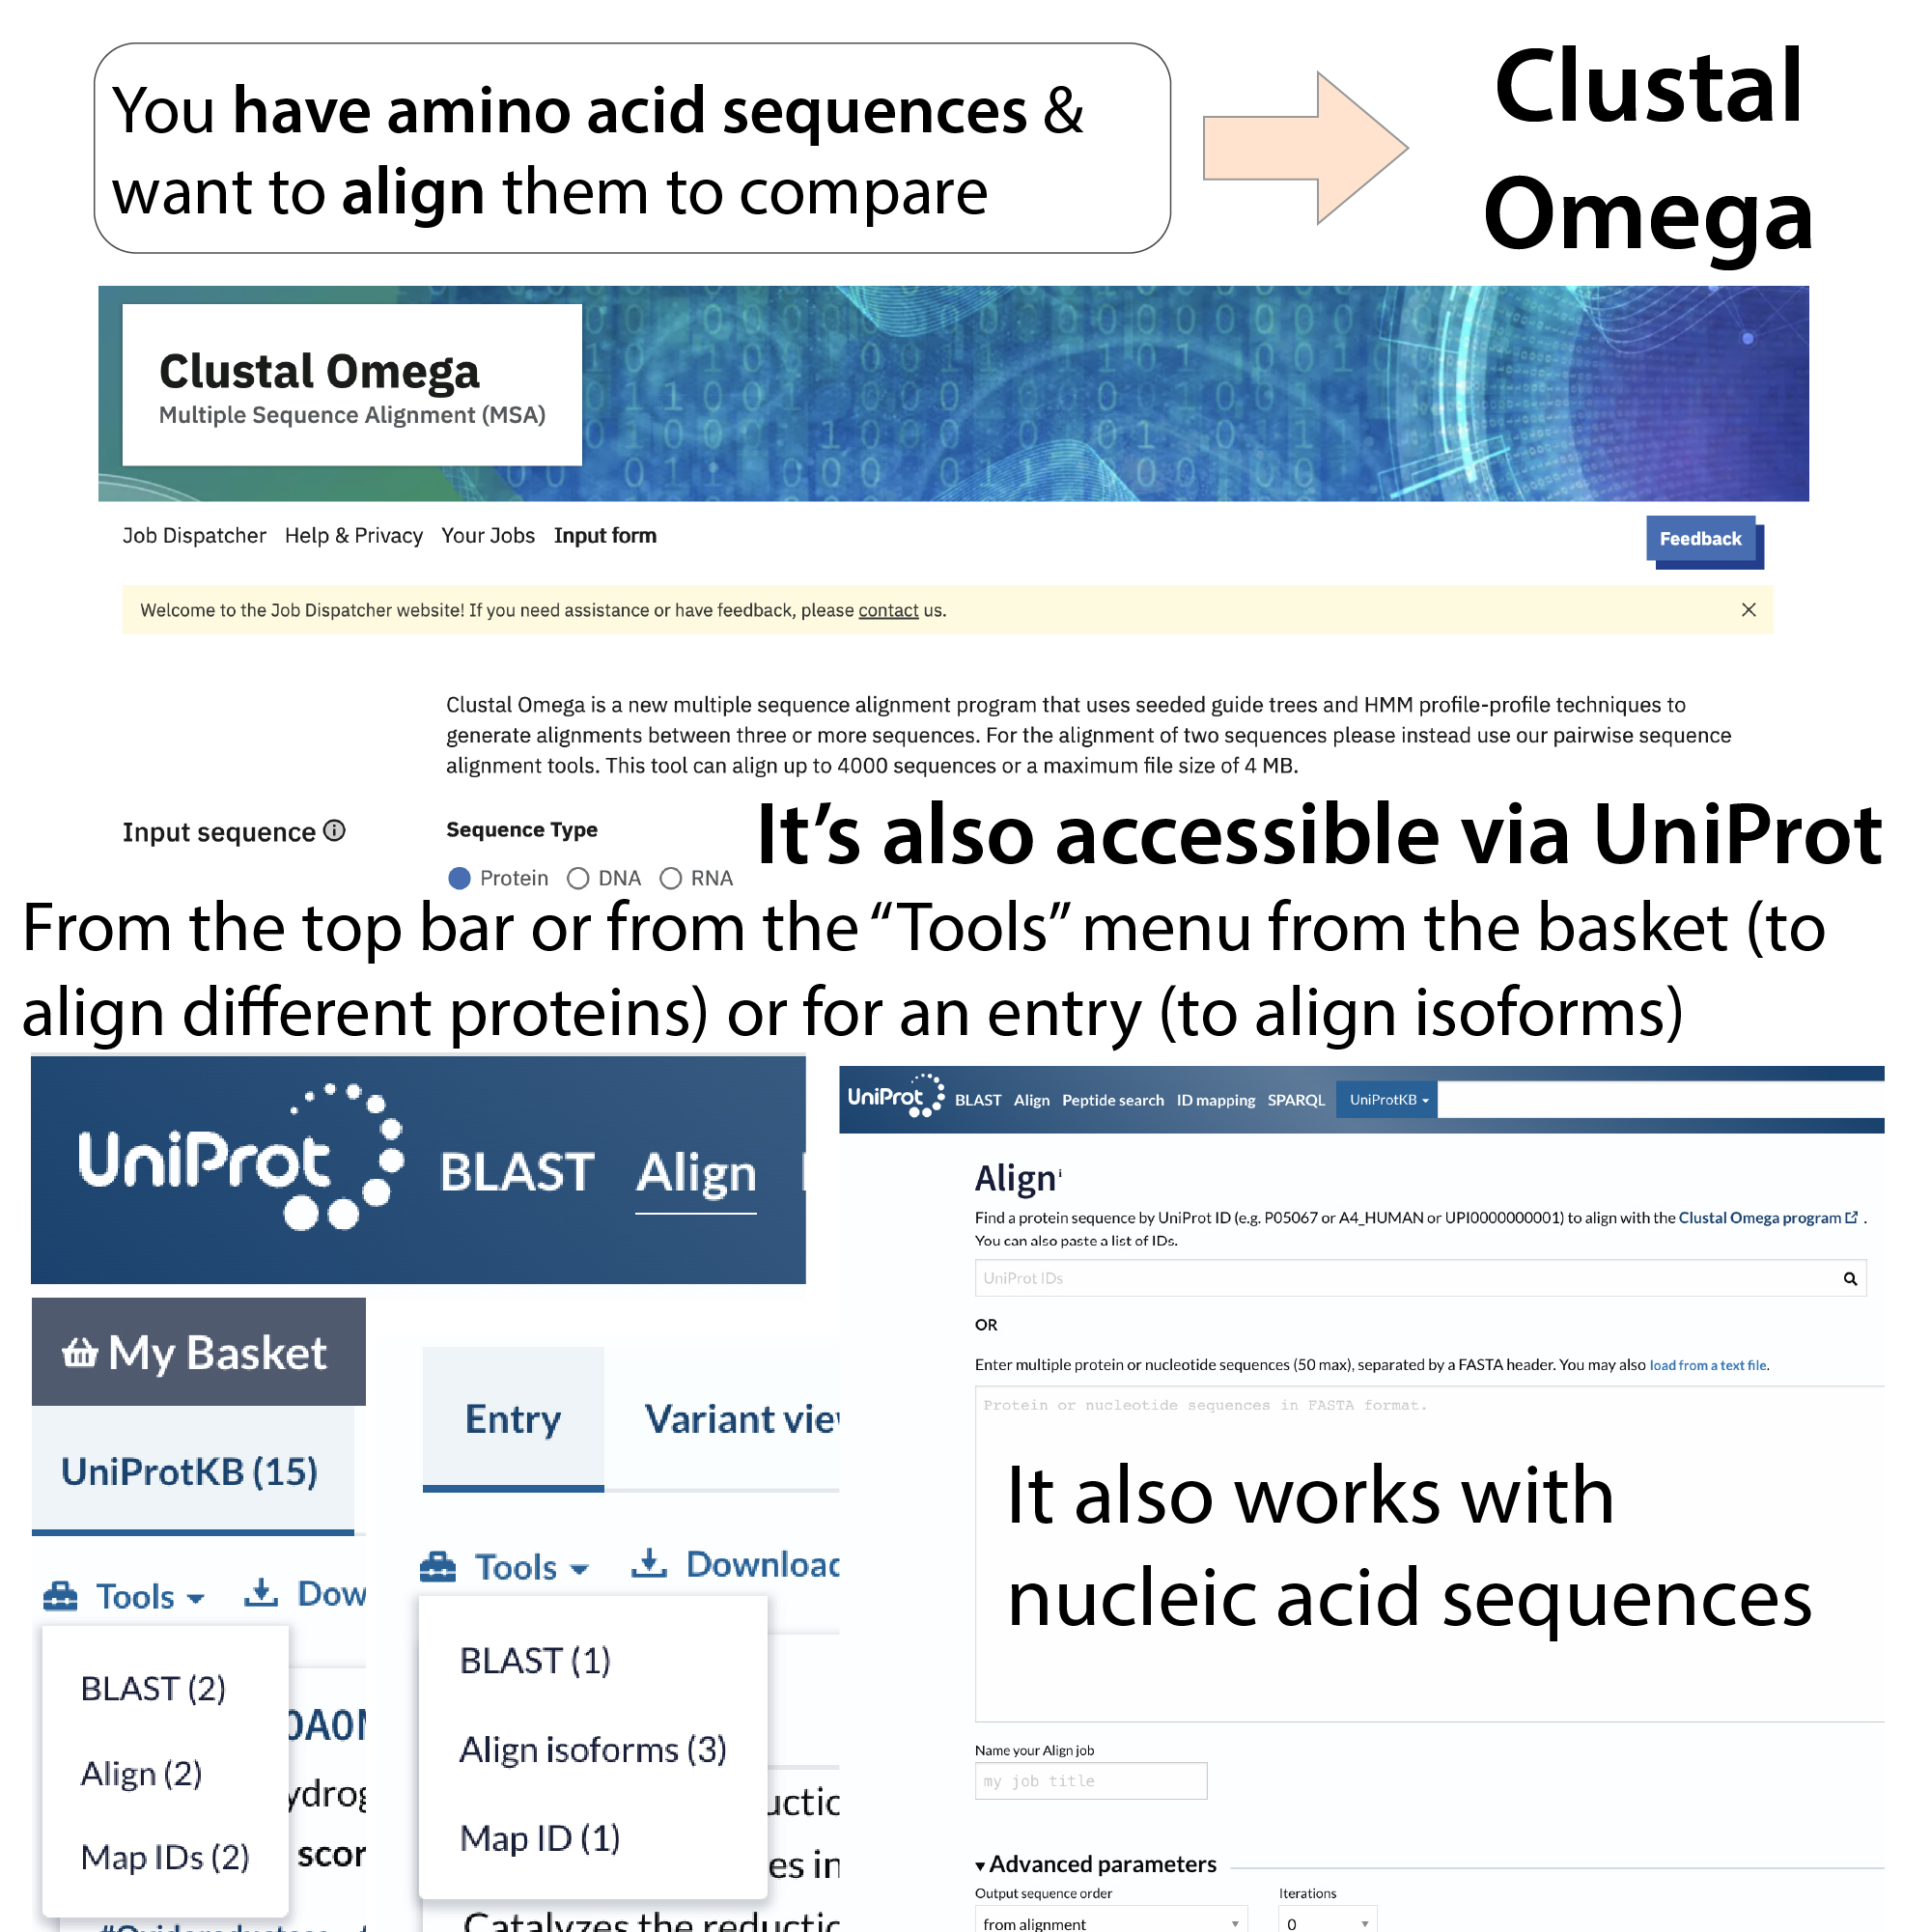
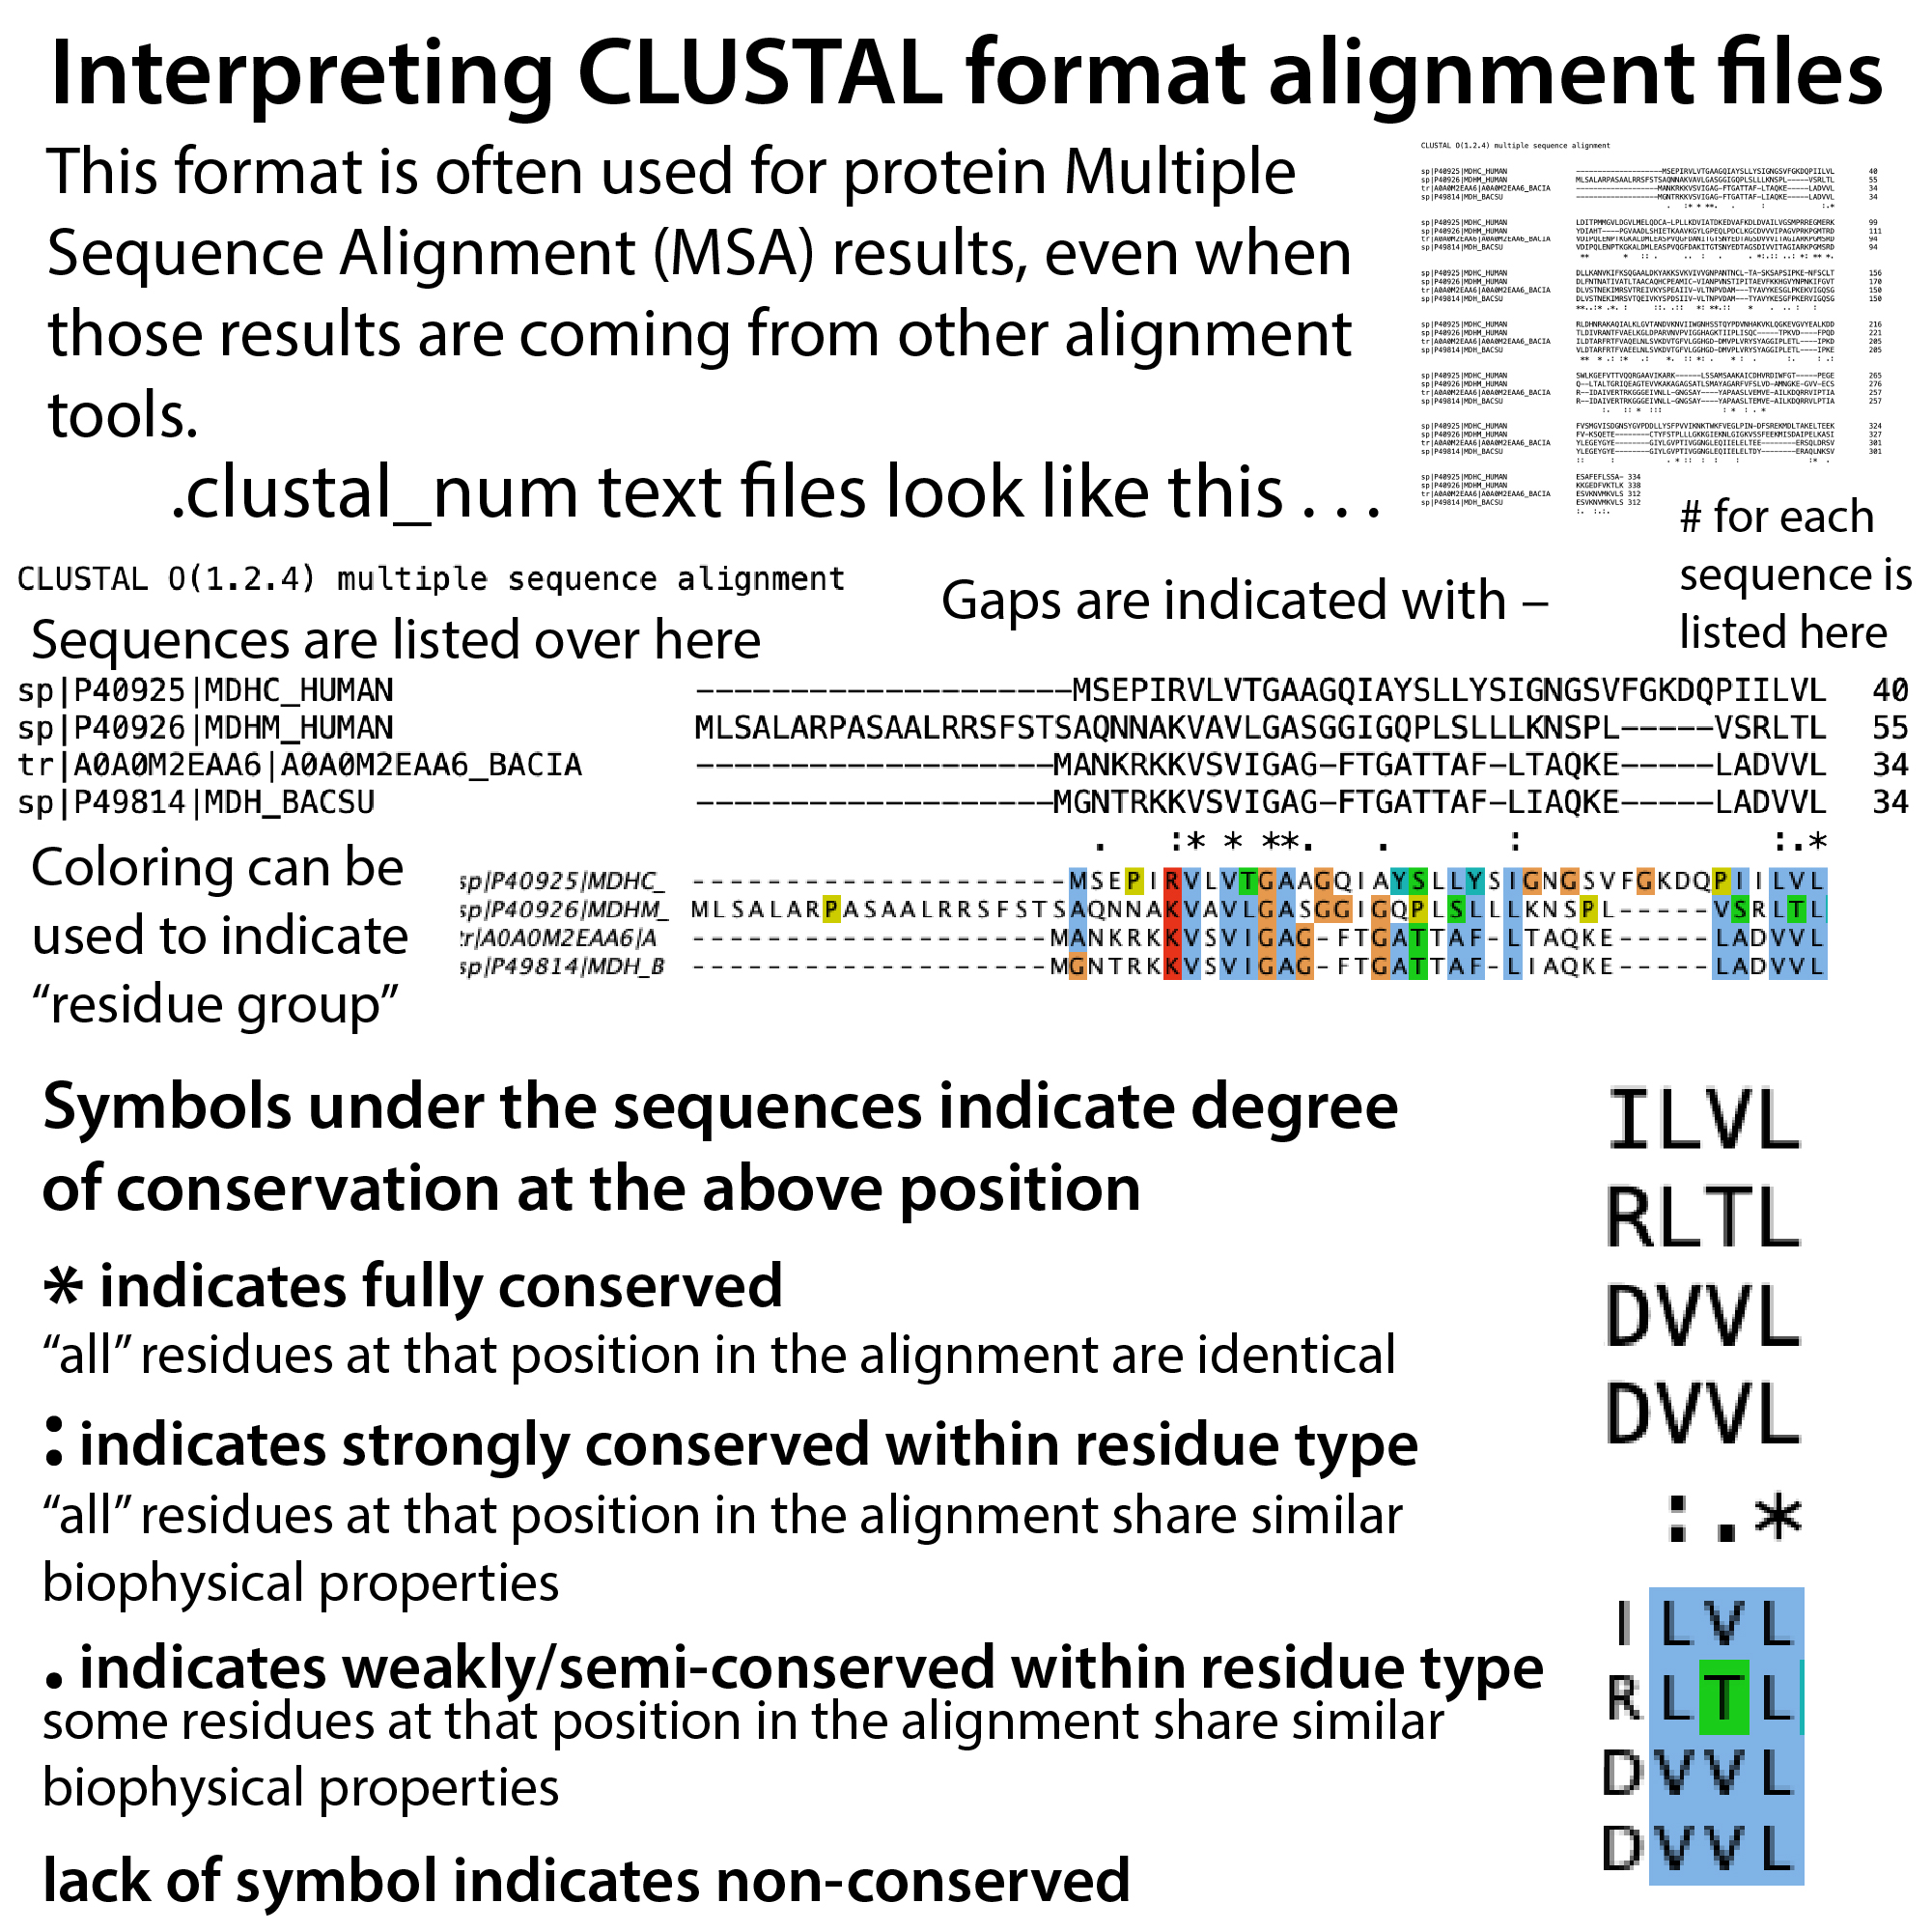
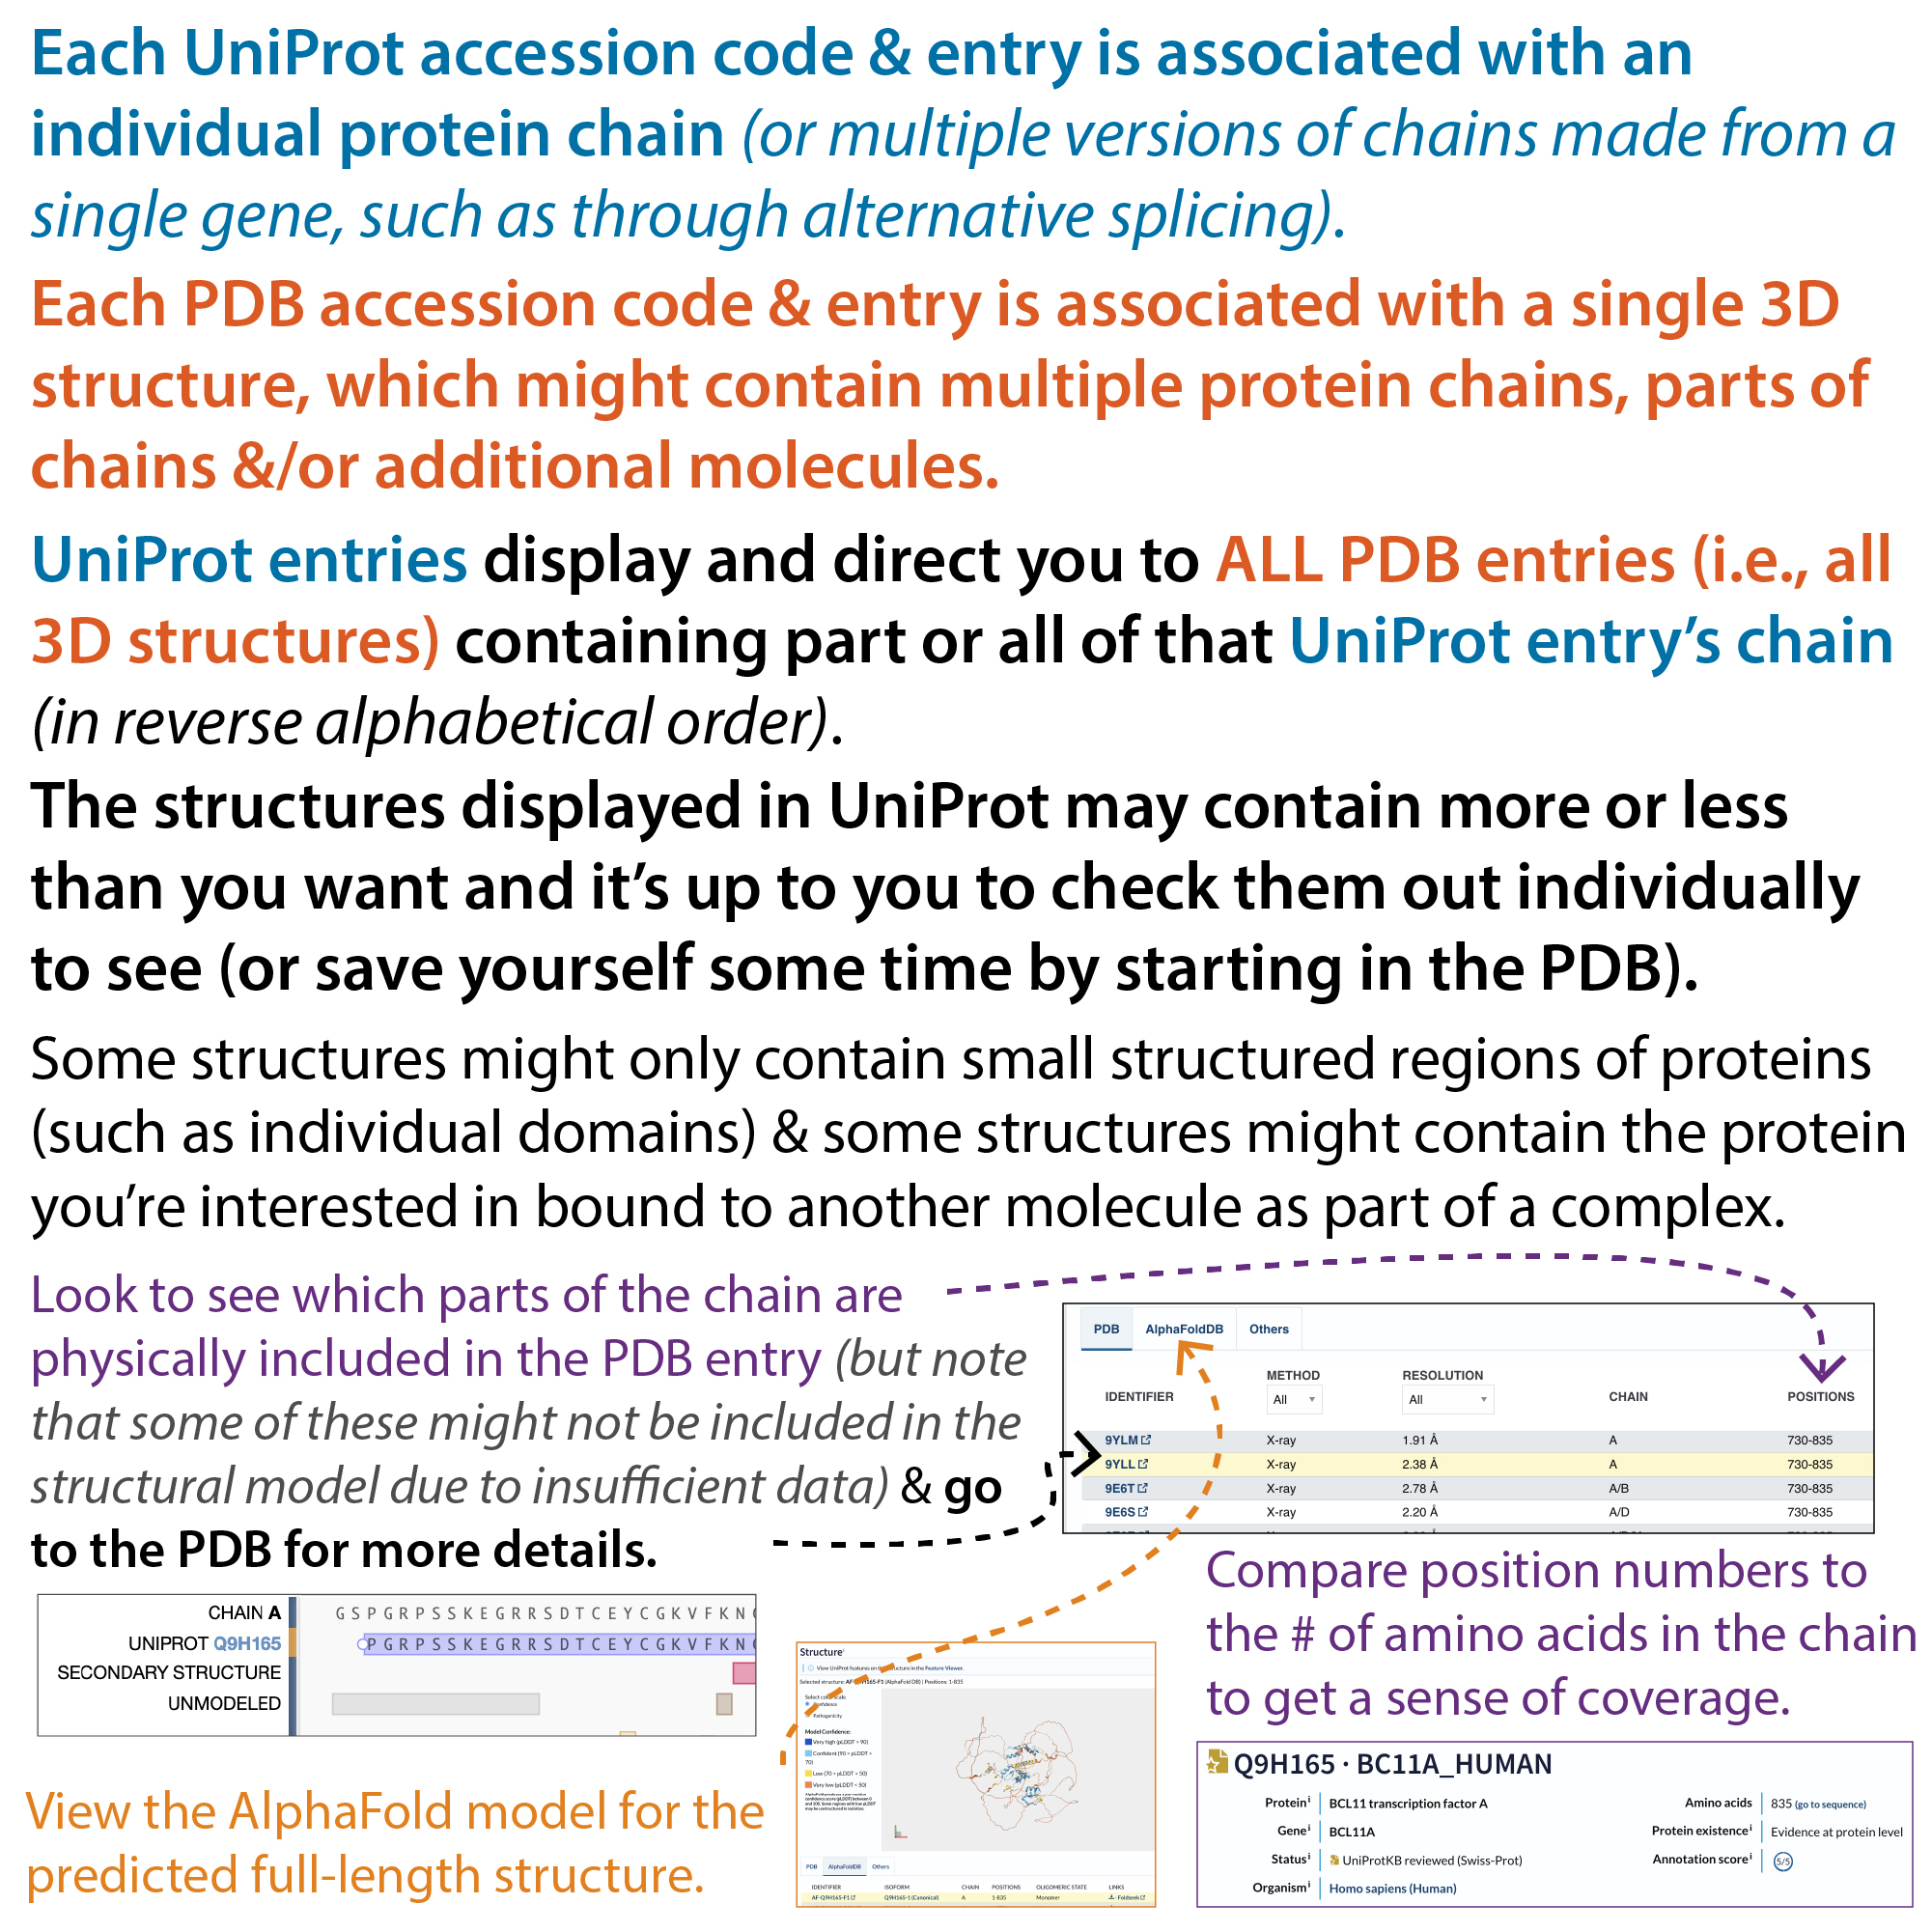
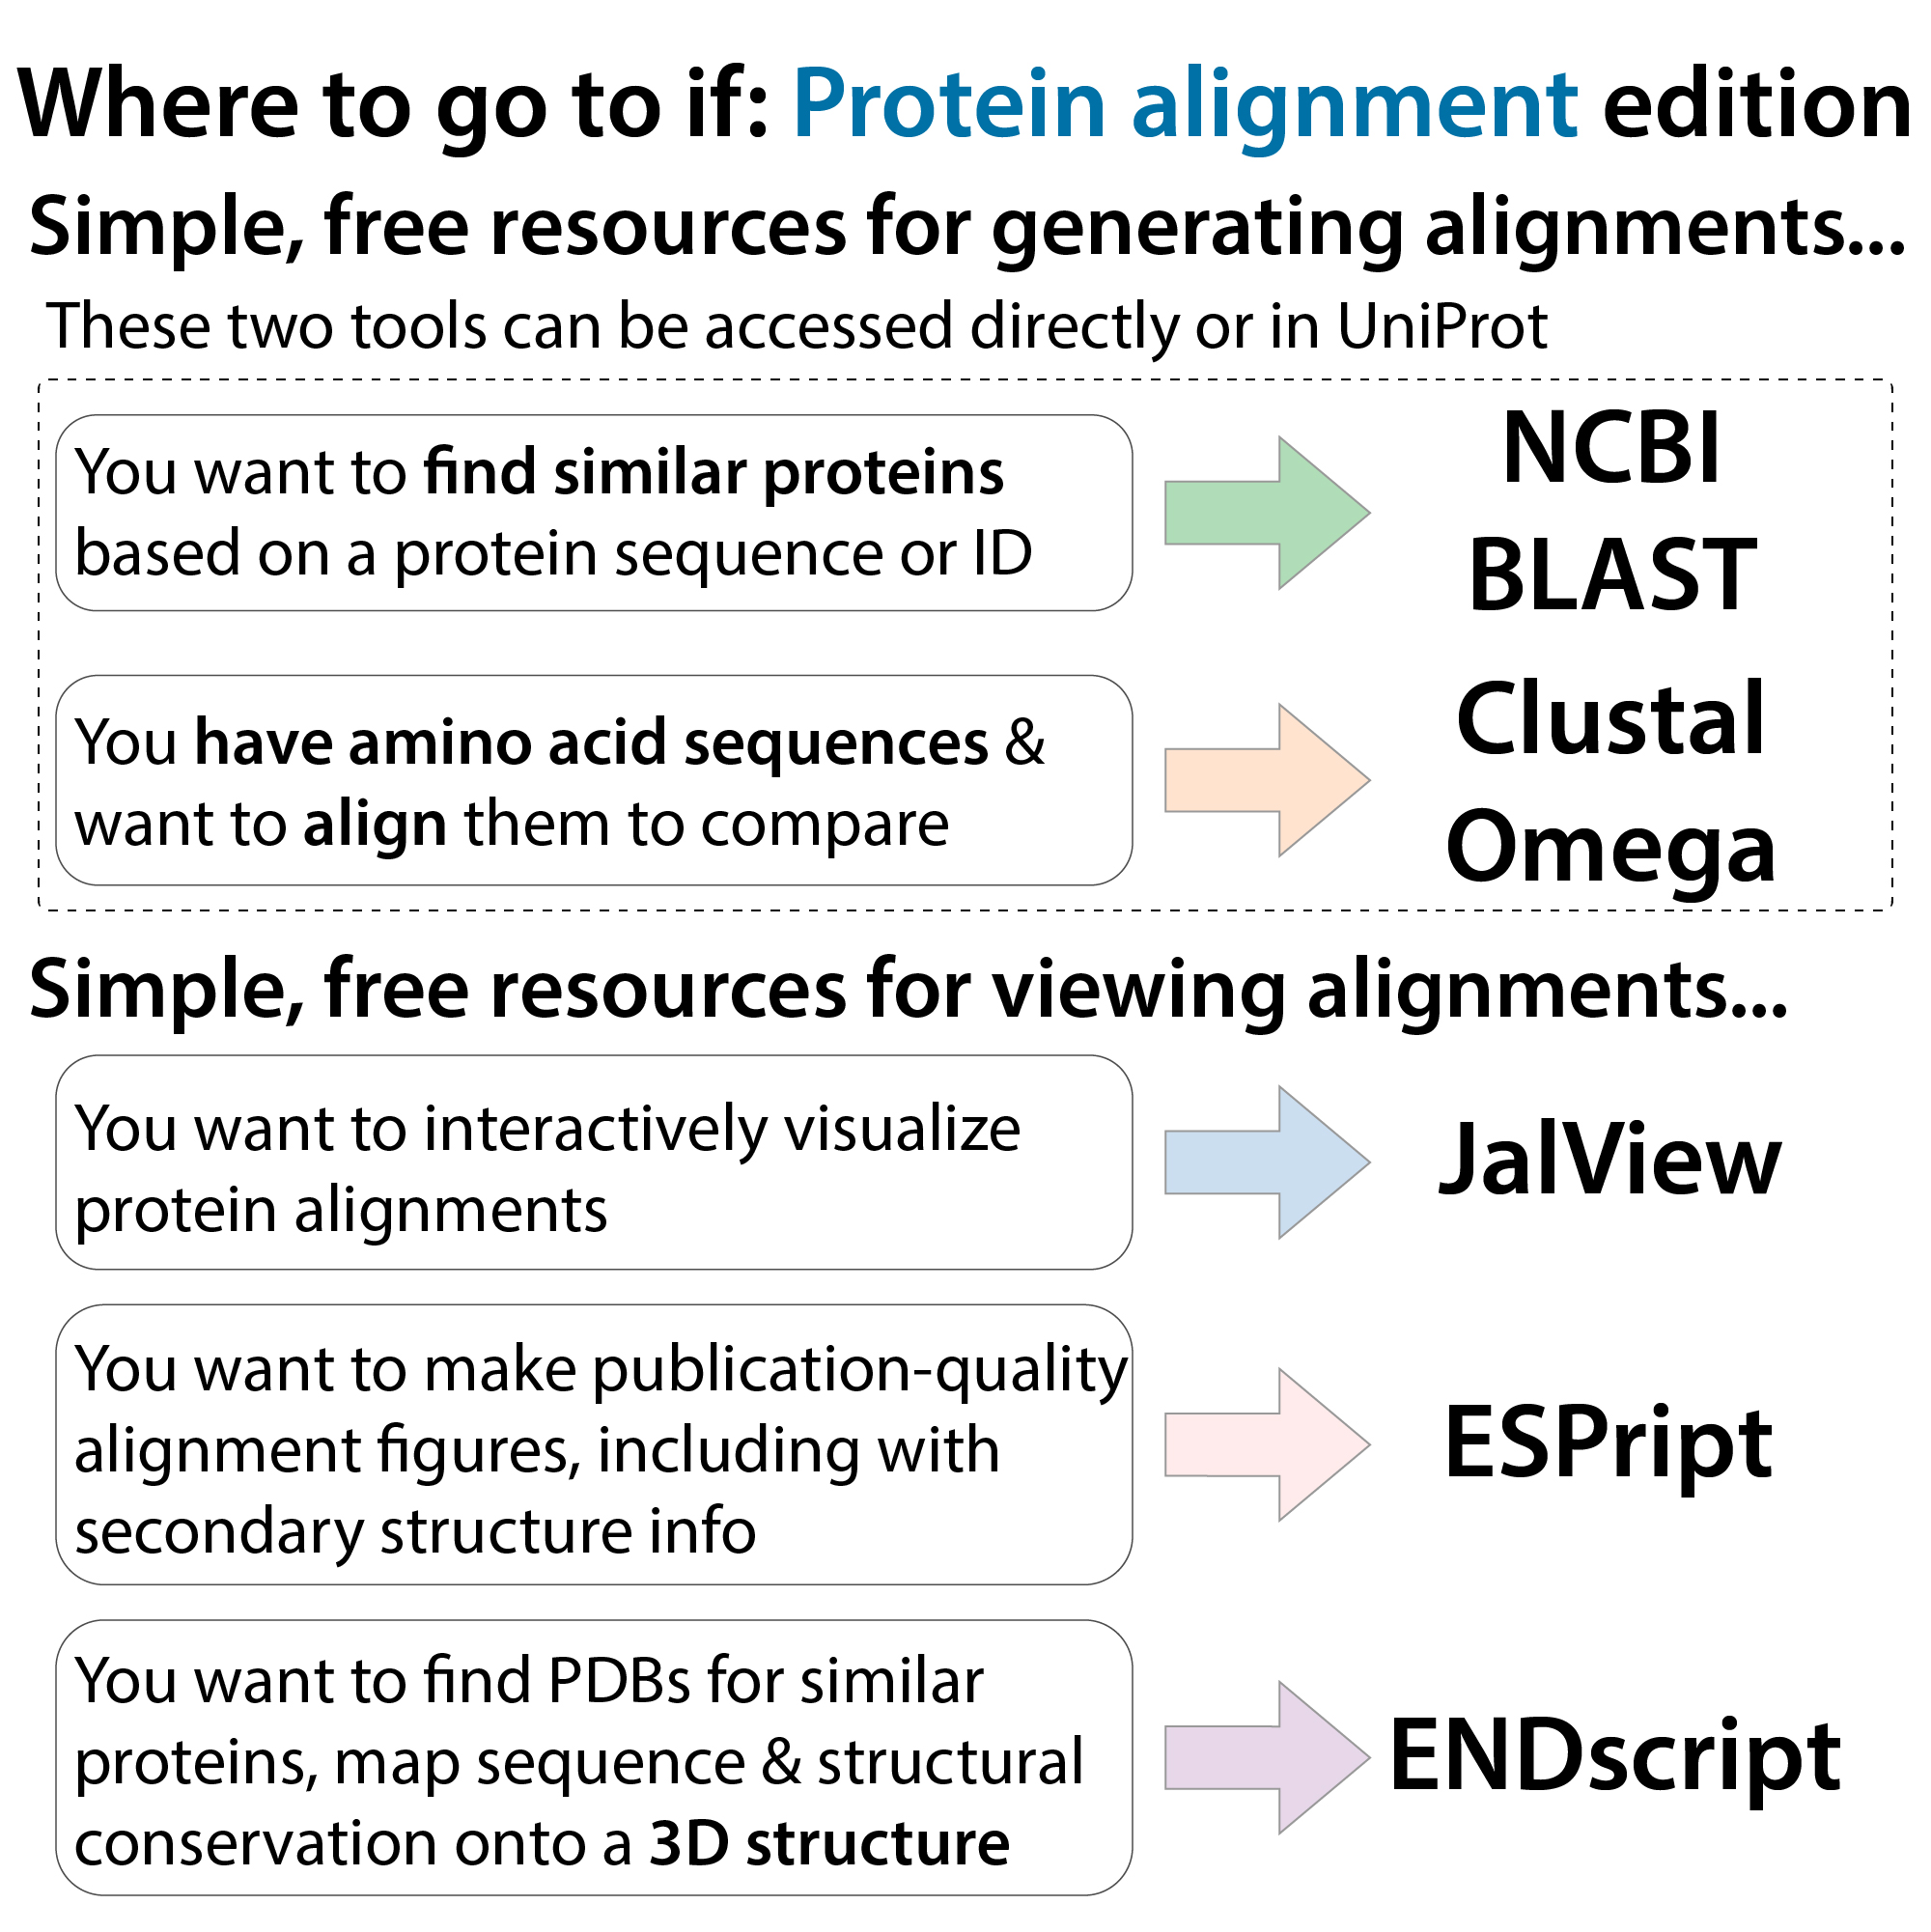
The protein biochemist’s toolbox almost definitely includes UniProt & ProtParam. So here are some of the basics of using these and other free online database tools to learn more about proteins. With UniProt as a launchpad you can search for proteins of interest, get their sequences, align them, find similar ones, look at their domains & where else those domains occur, figure out their likely charged-ness (from pI), their extinction coefficient (for measuring concentration with UV light), and way more. You can do way way more but I’m going to focus on the basic things I use a lot and give you an overview of what the way way more things include.
I’m not gonna write much today, just a show-and-tell, but here are links to the tools and links to past posts about some of the things I talked about. Originally posted this 8/23/21. Then added content & refreshed.
Additional pages & guides, with downloadable PDFs:
UniProt
This is your basic starting point for finding & learning about a protein – it connects you to way more resources through like a bazillion links & lets you align sequences): https://www.uniprot.org/
The PDB (Protein Data Bank)
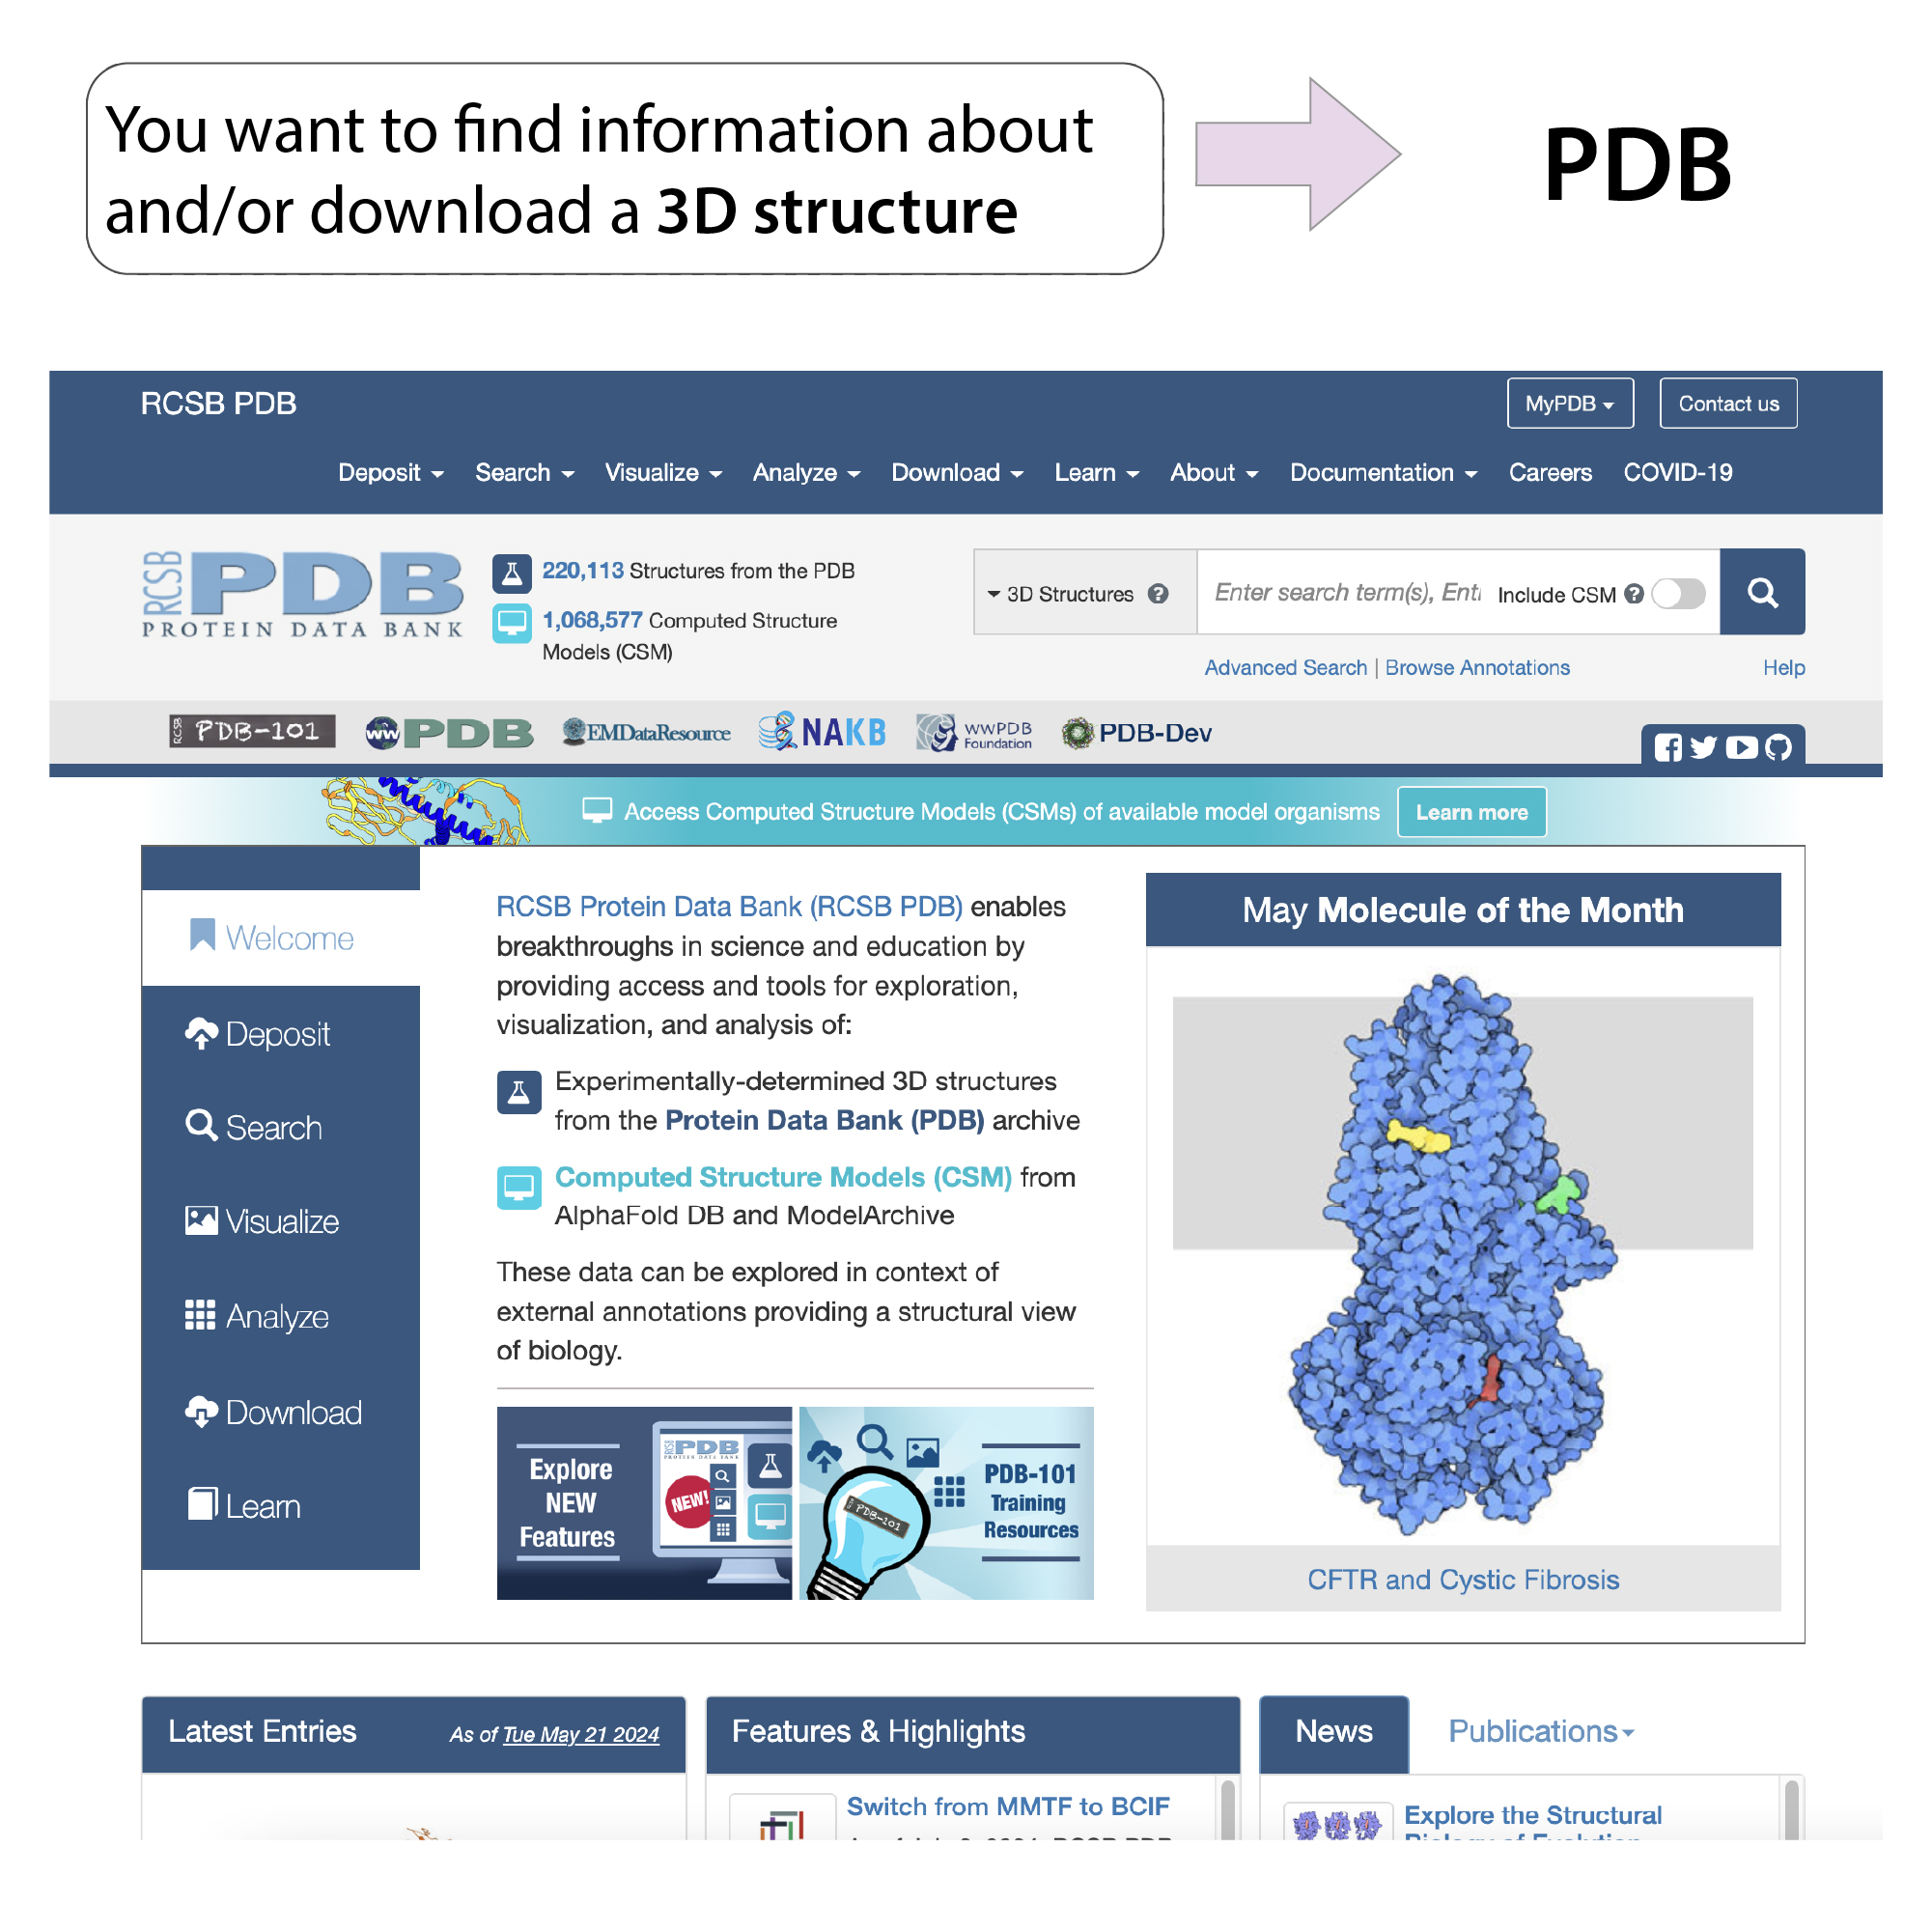
This is where to go if you want to explore the 3D structures of proteins. I have WAAAAAY more about it here: The PDB (Protein Data Bank). Some of its key features you’ll want to check out:
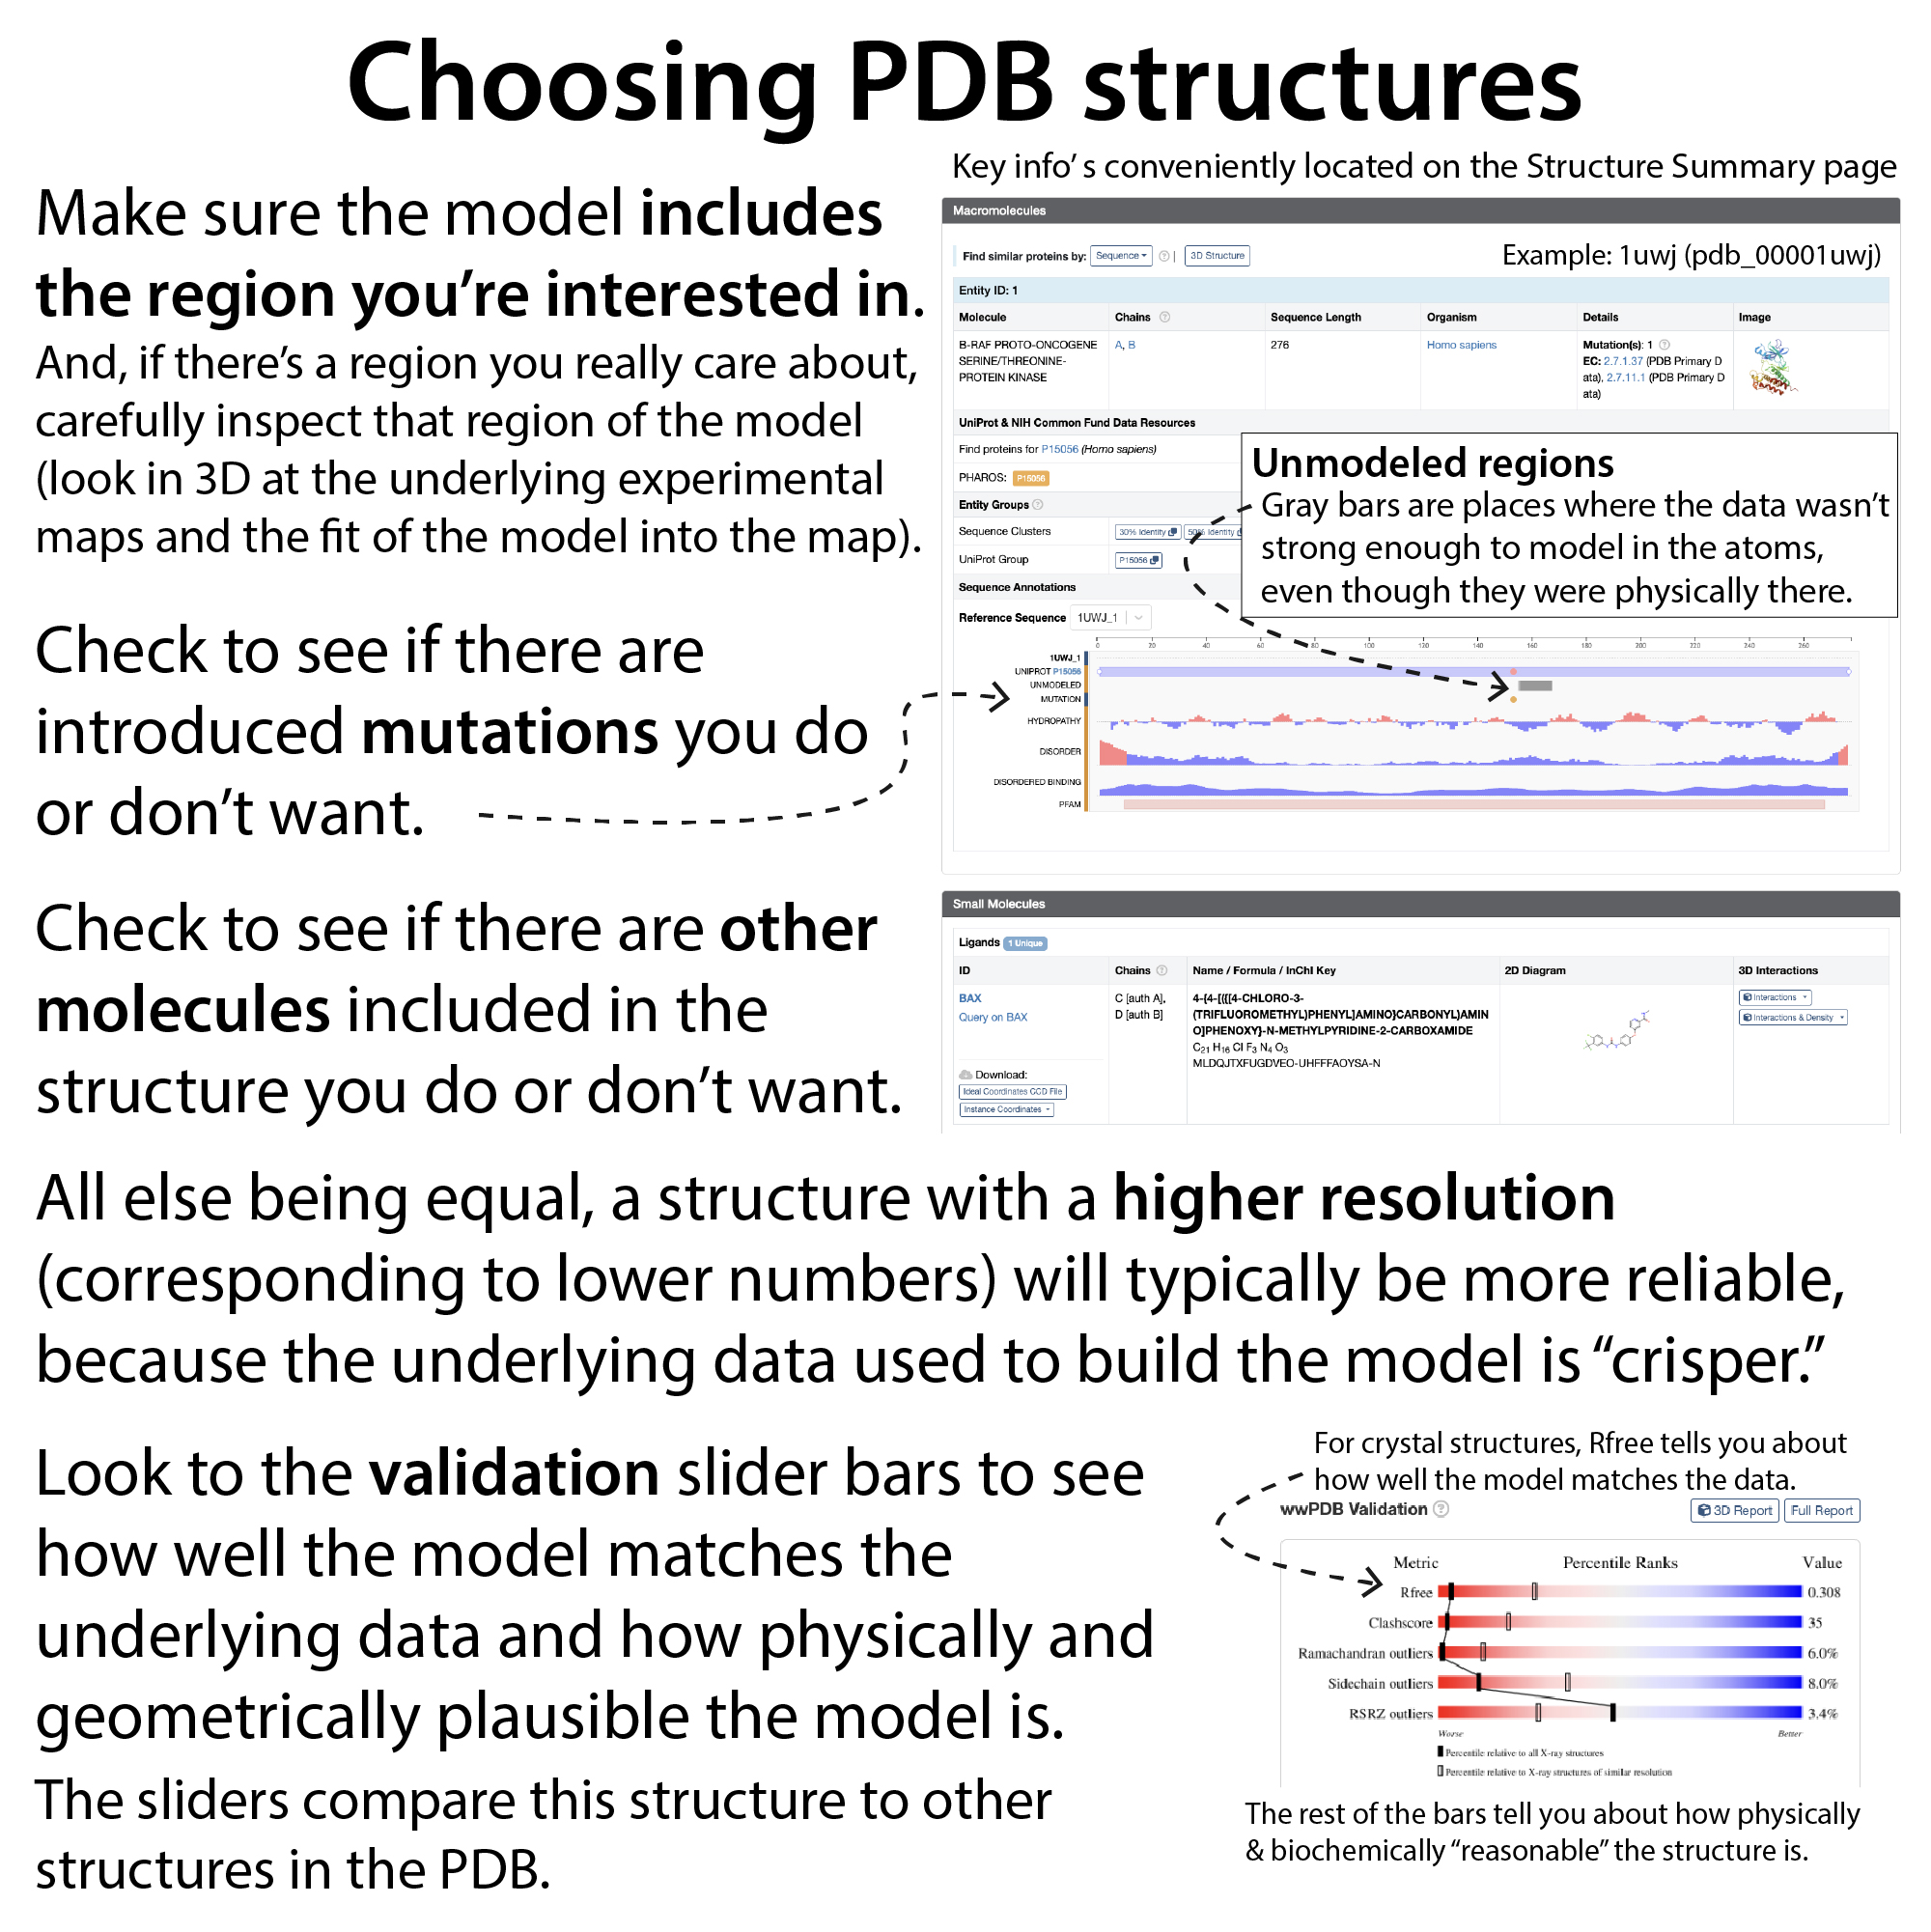
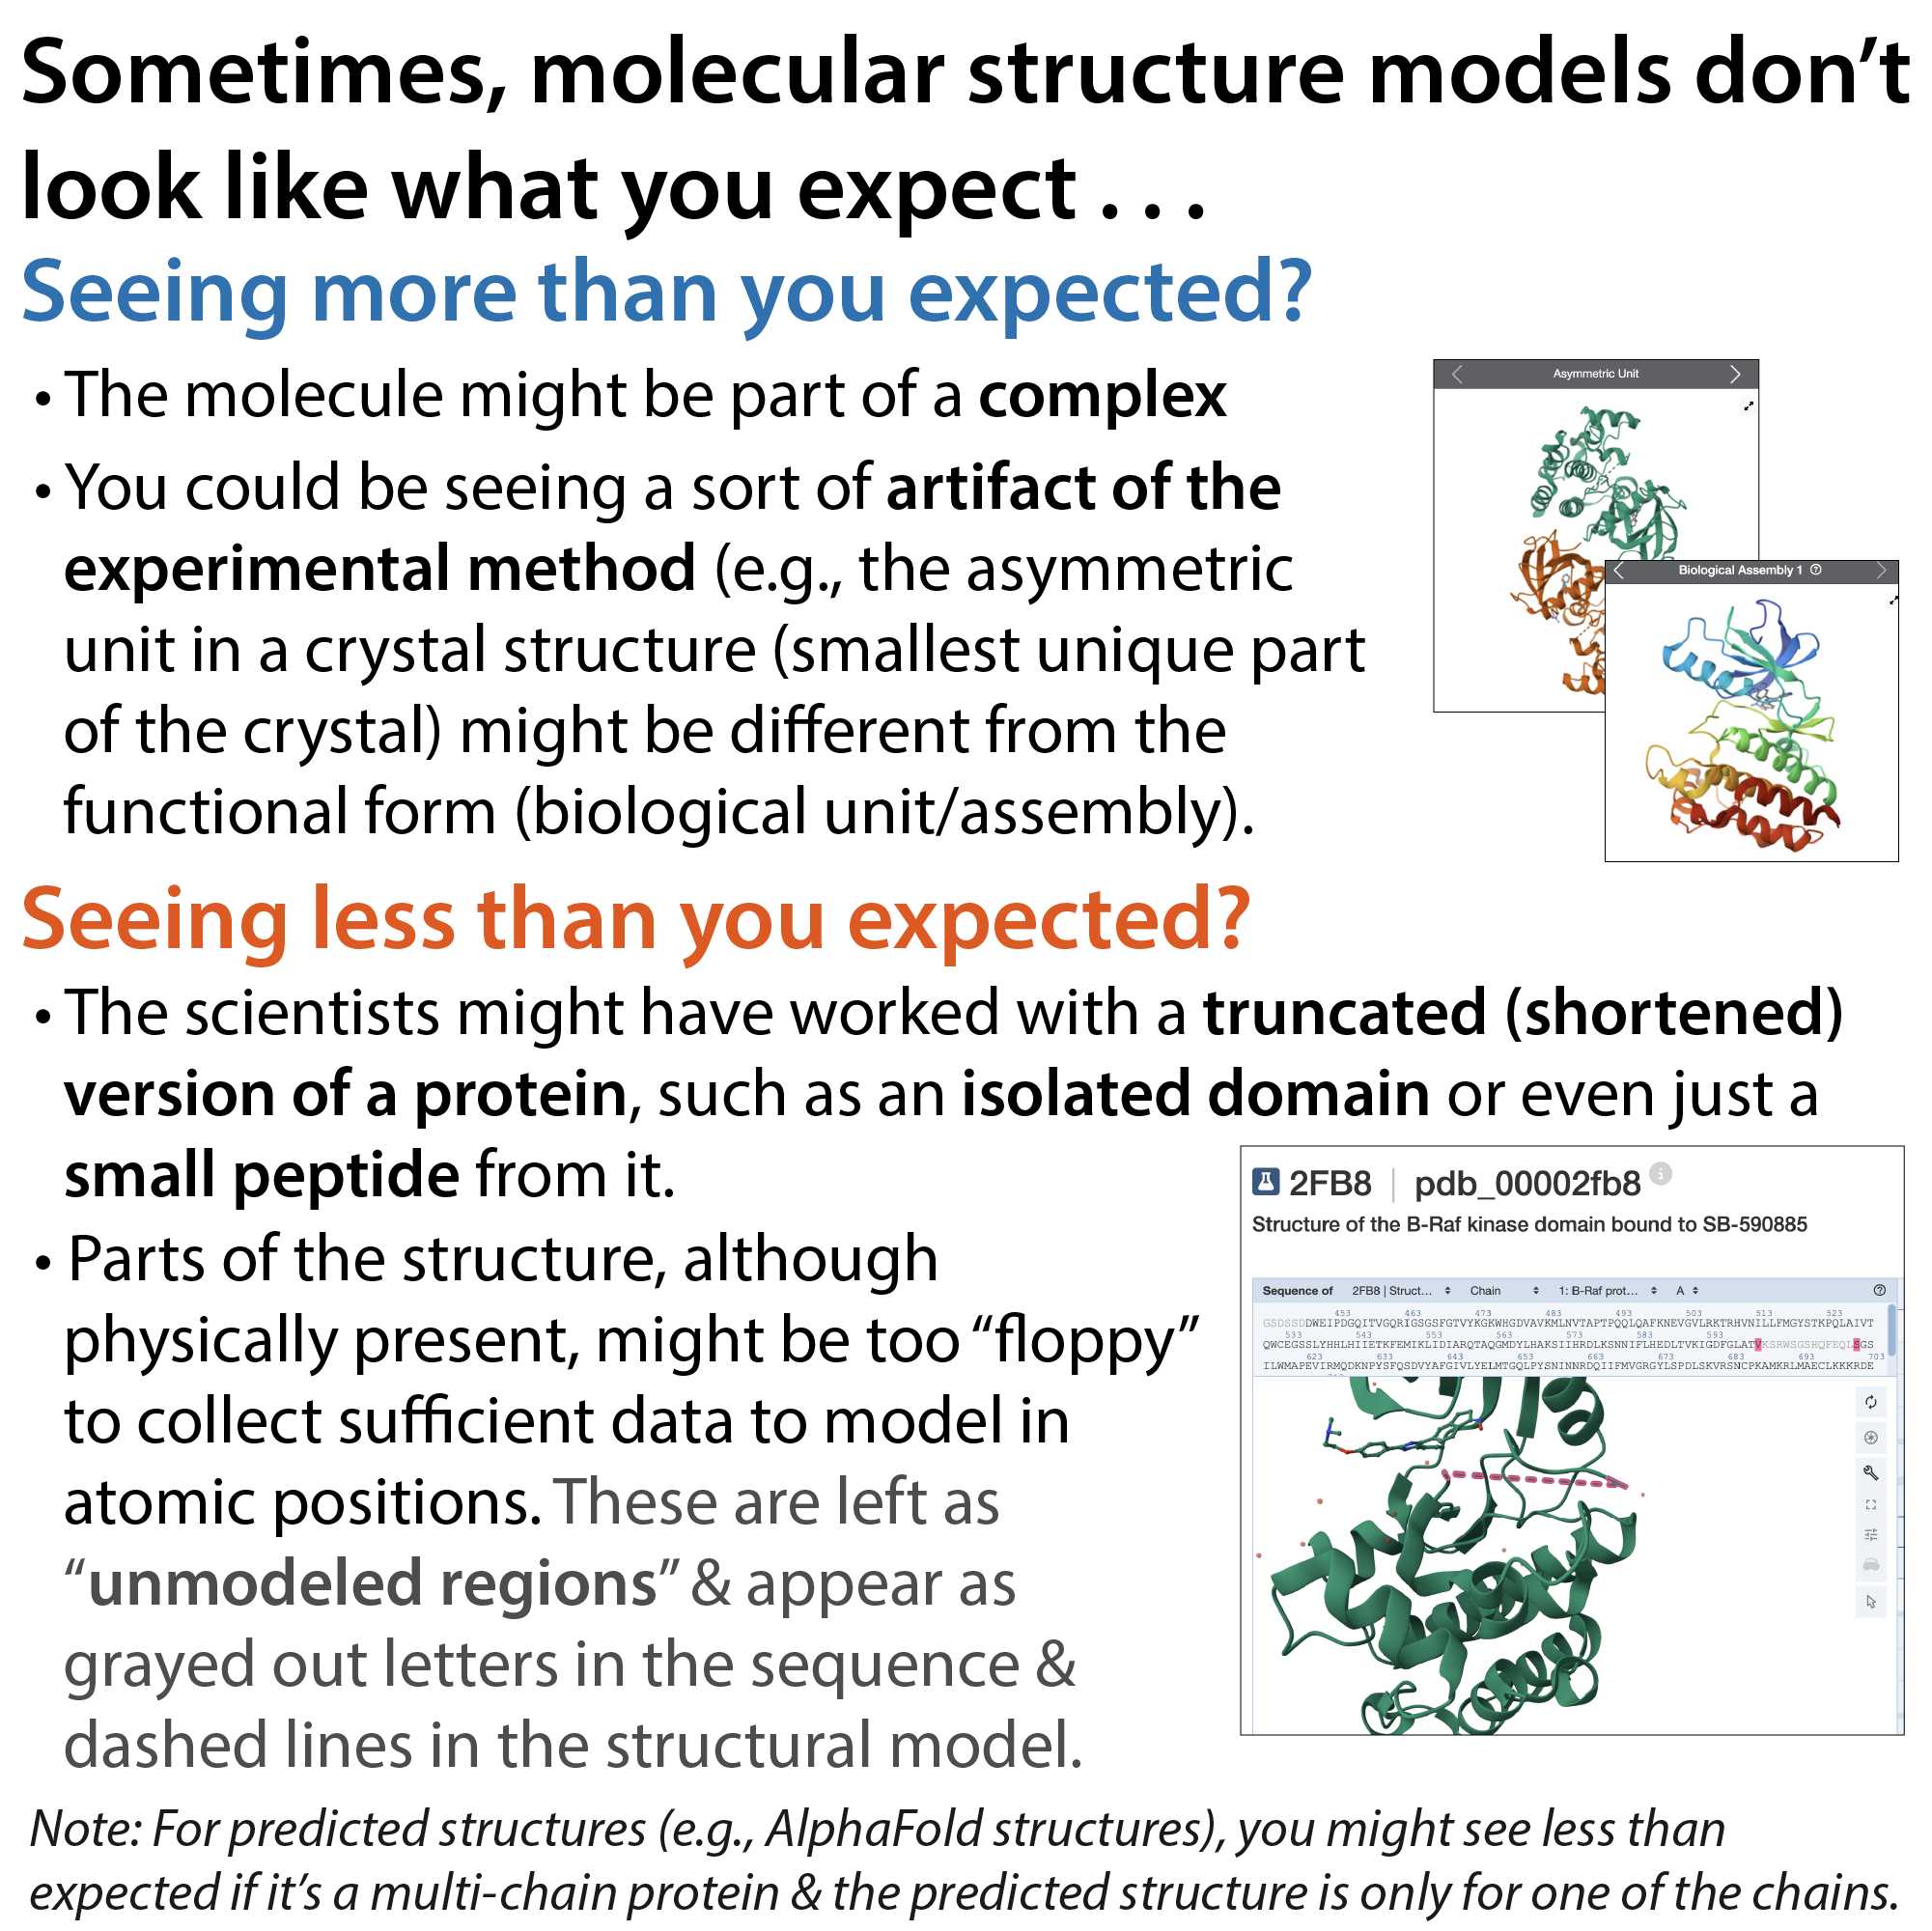
- Structure Summary page: provides an overview of a structure – measurements of the quality of the structural model and underlying data, a description of what the structure contains, information about the source of the sample, information about the experimental method, and links to any accompanying paper and other related structures
- Validation Reports, including 3D view – points out potential problems with the structural model’s geometry (bond angles, etc.) and clashes (atoms too close in space) as well as places the model doesn’t match the data well. More here: https://thebumblingbiochemist.com/365-days-of-science/structurequality/ & https://youtu.be/0AswlZBLpKw
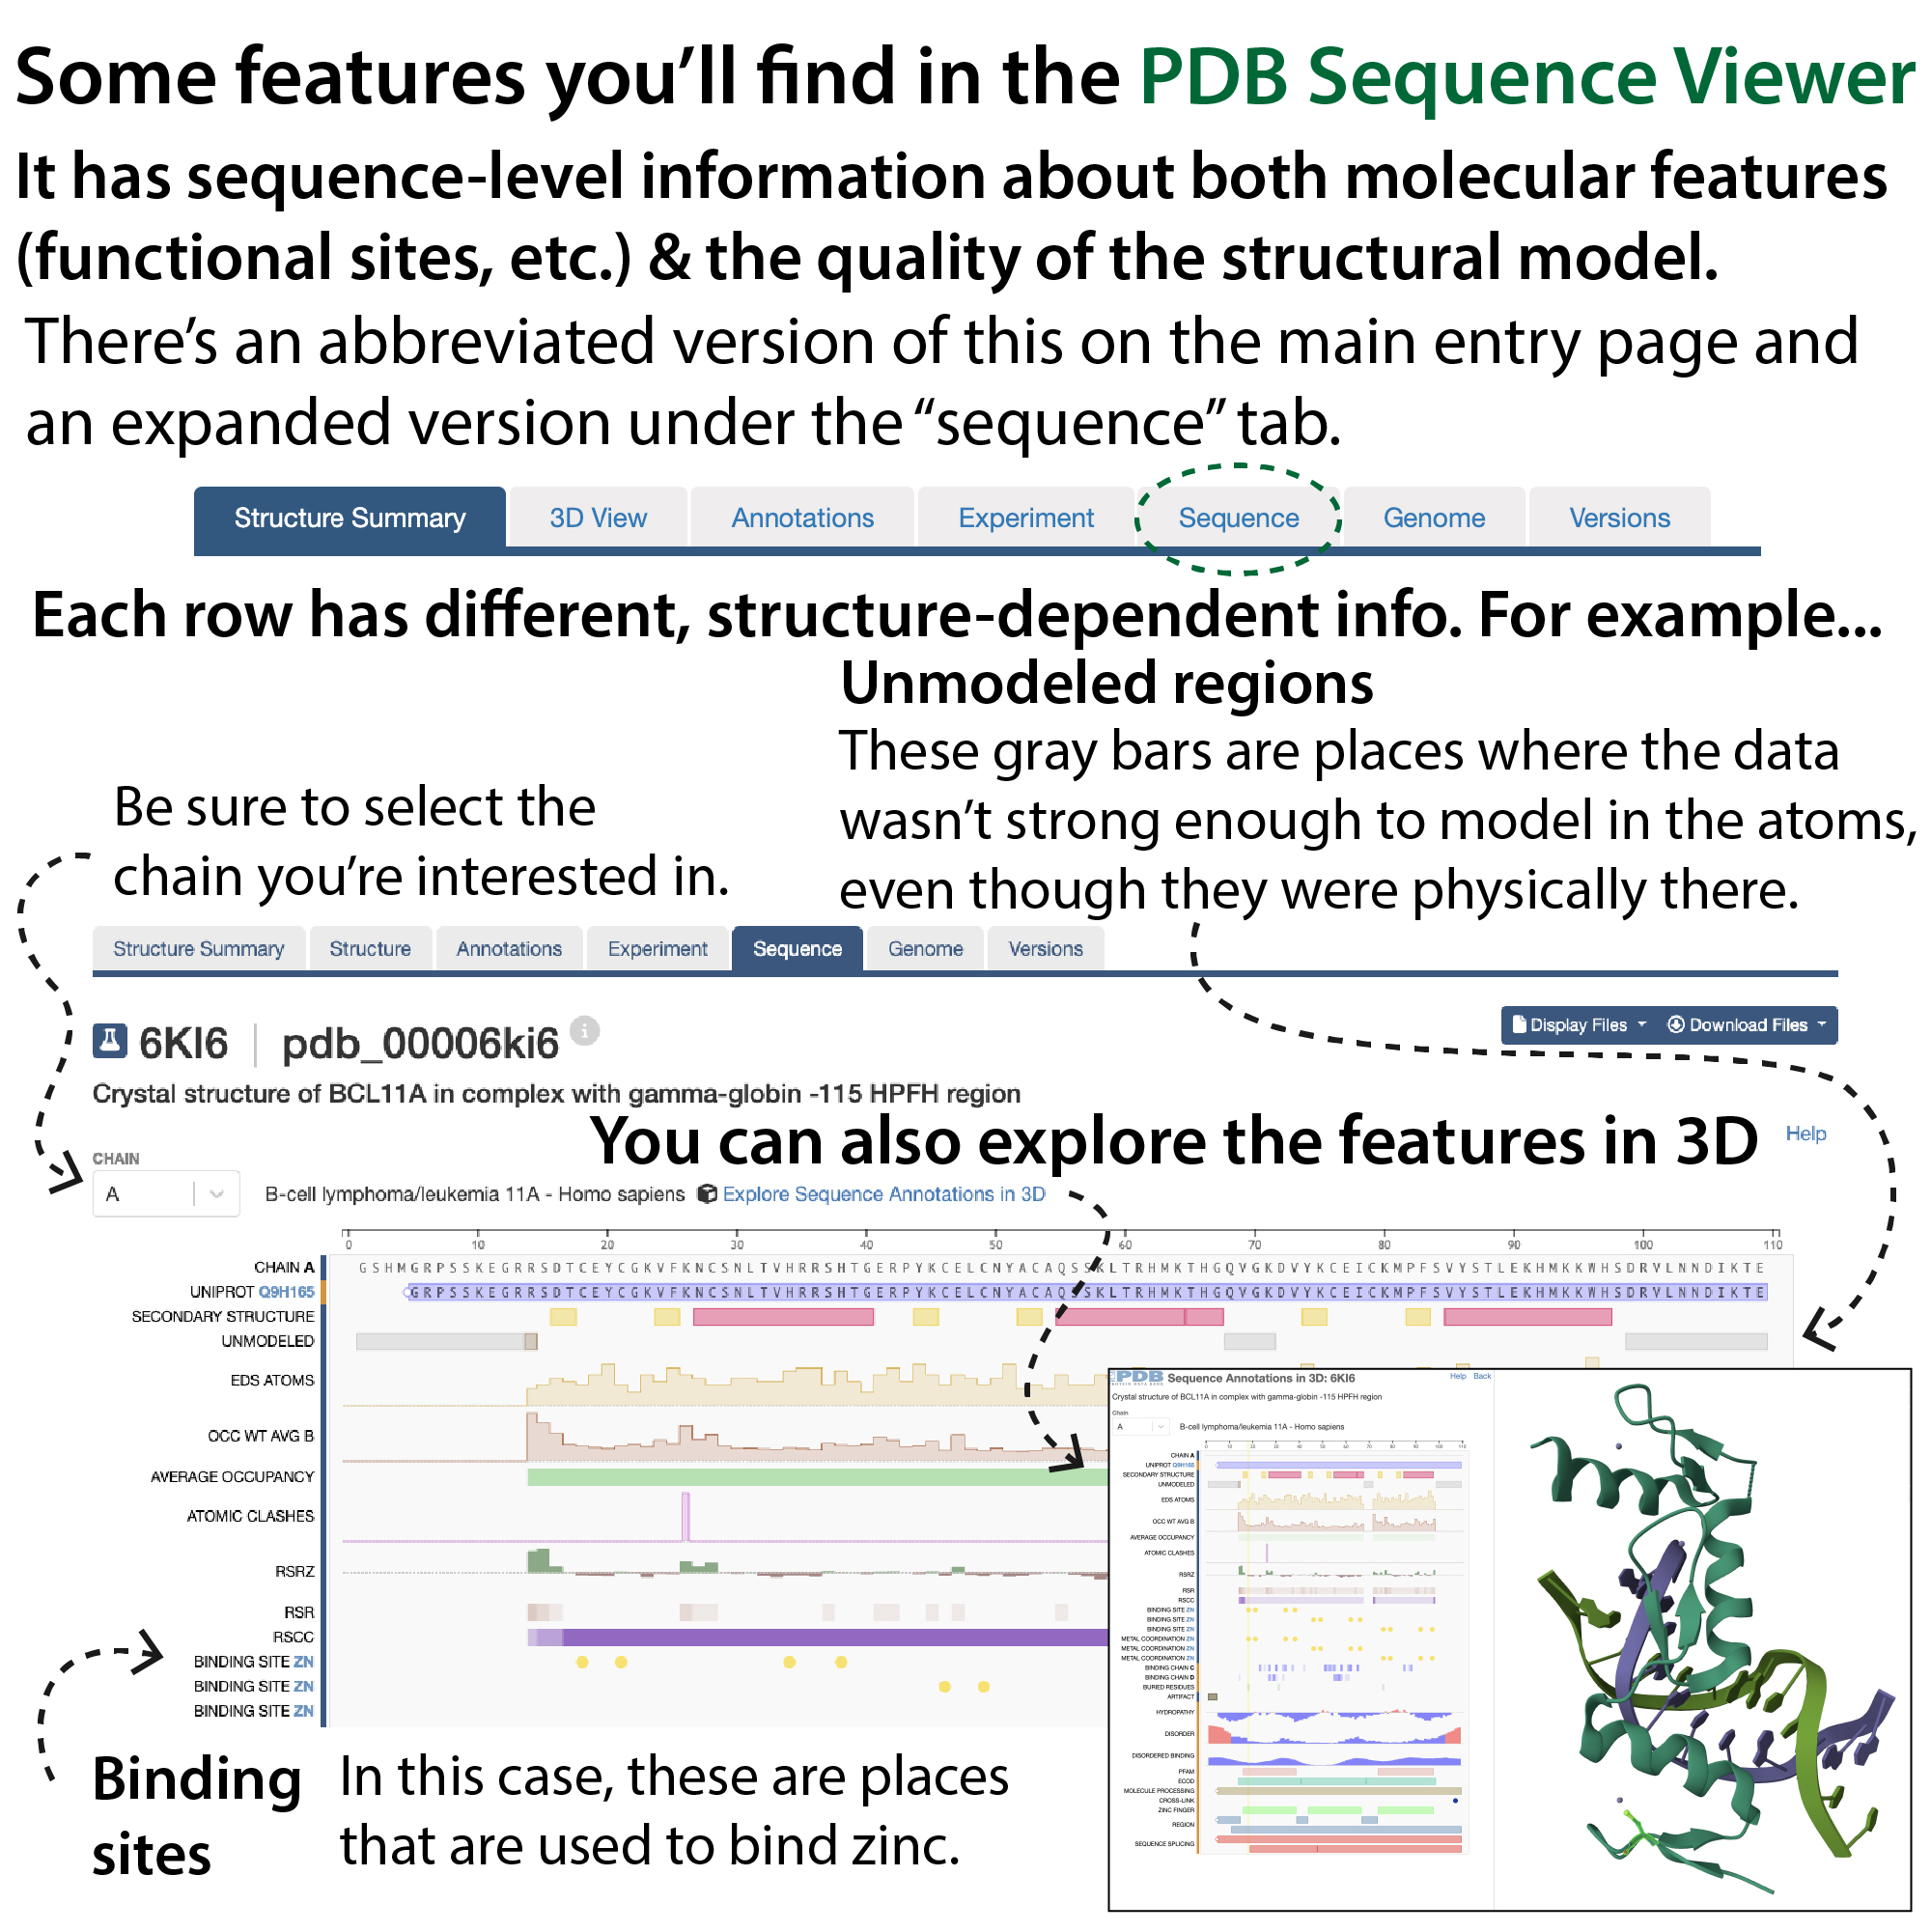
- 3D Sequence Viewer – maps annotations like functional sites to the 3D structure. More here: https://youtu.be/6zKBBkzl-4A
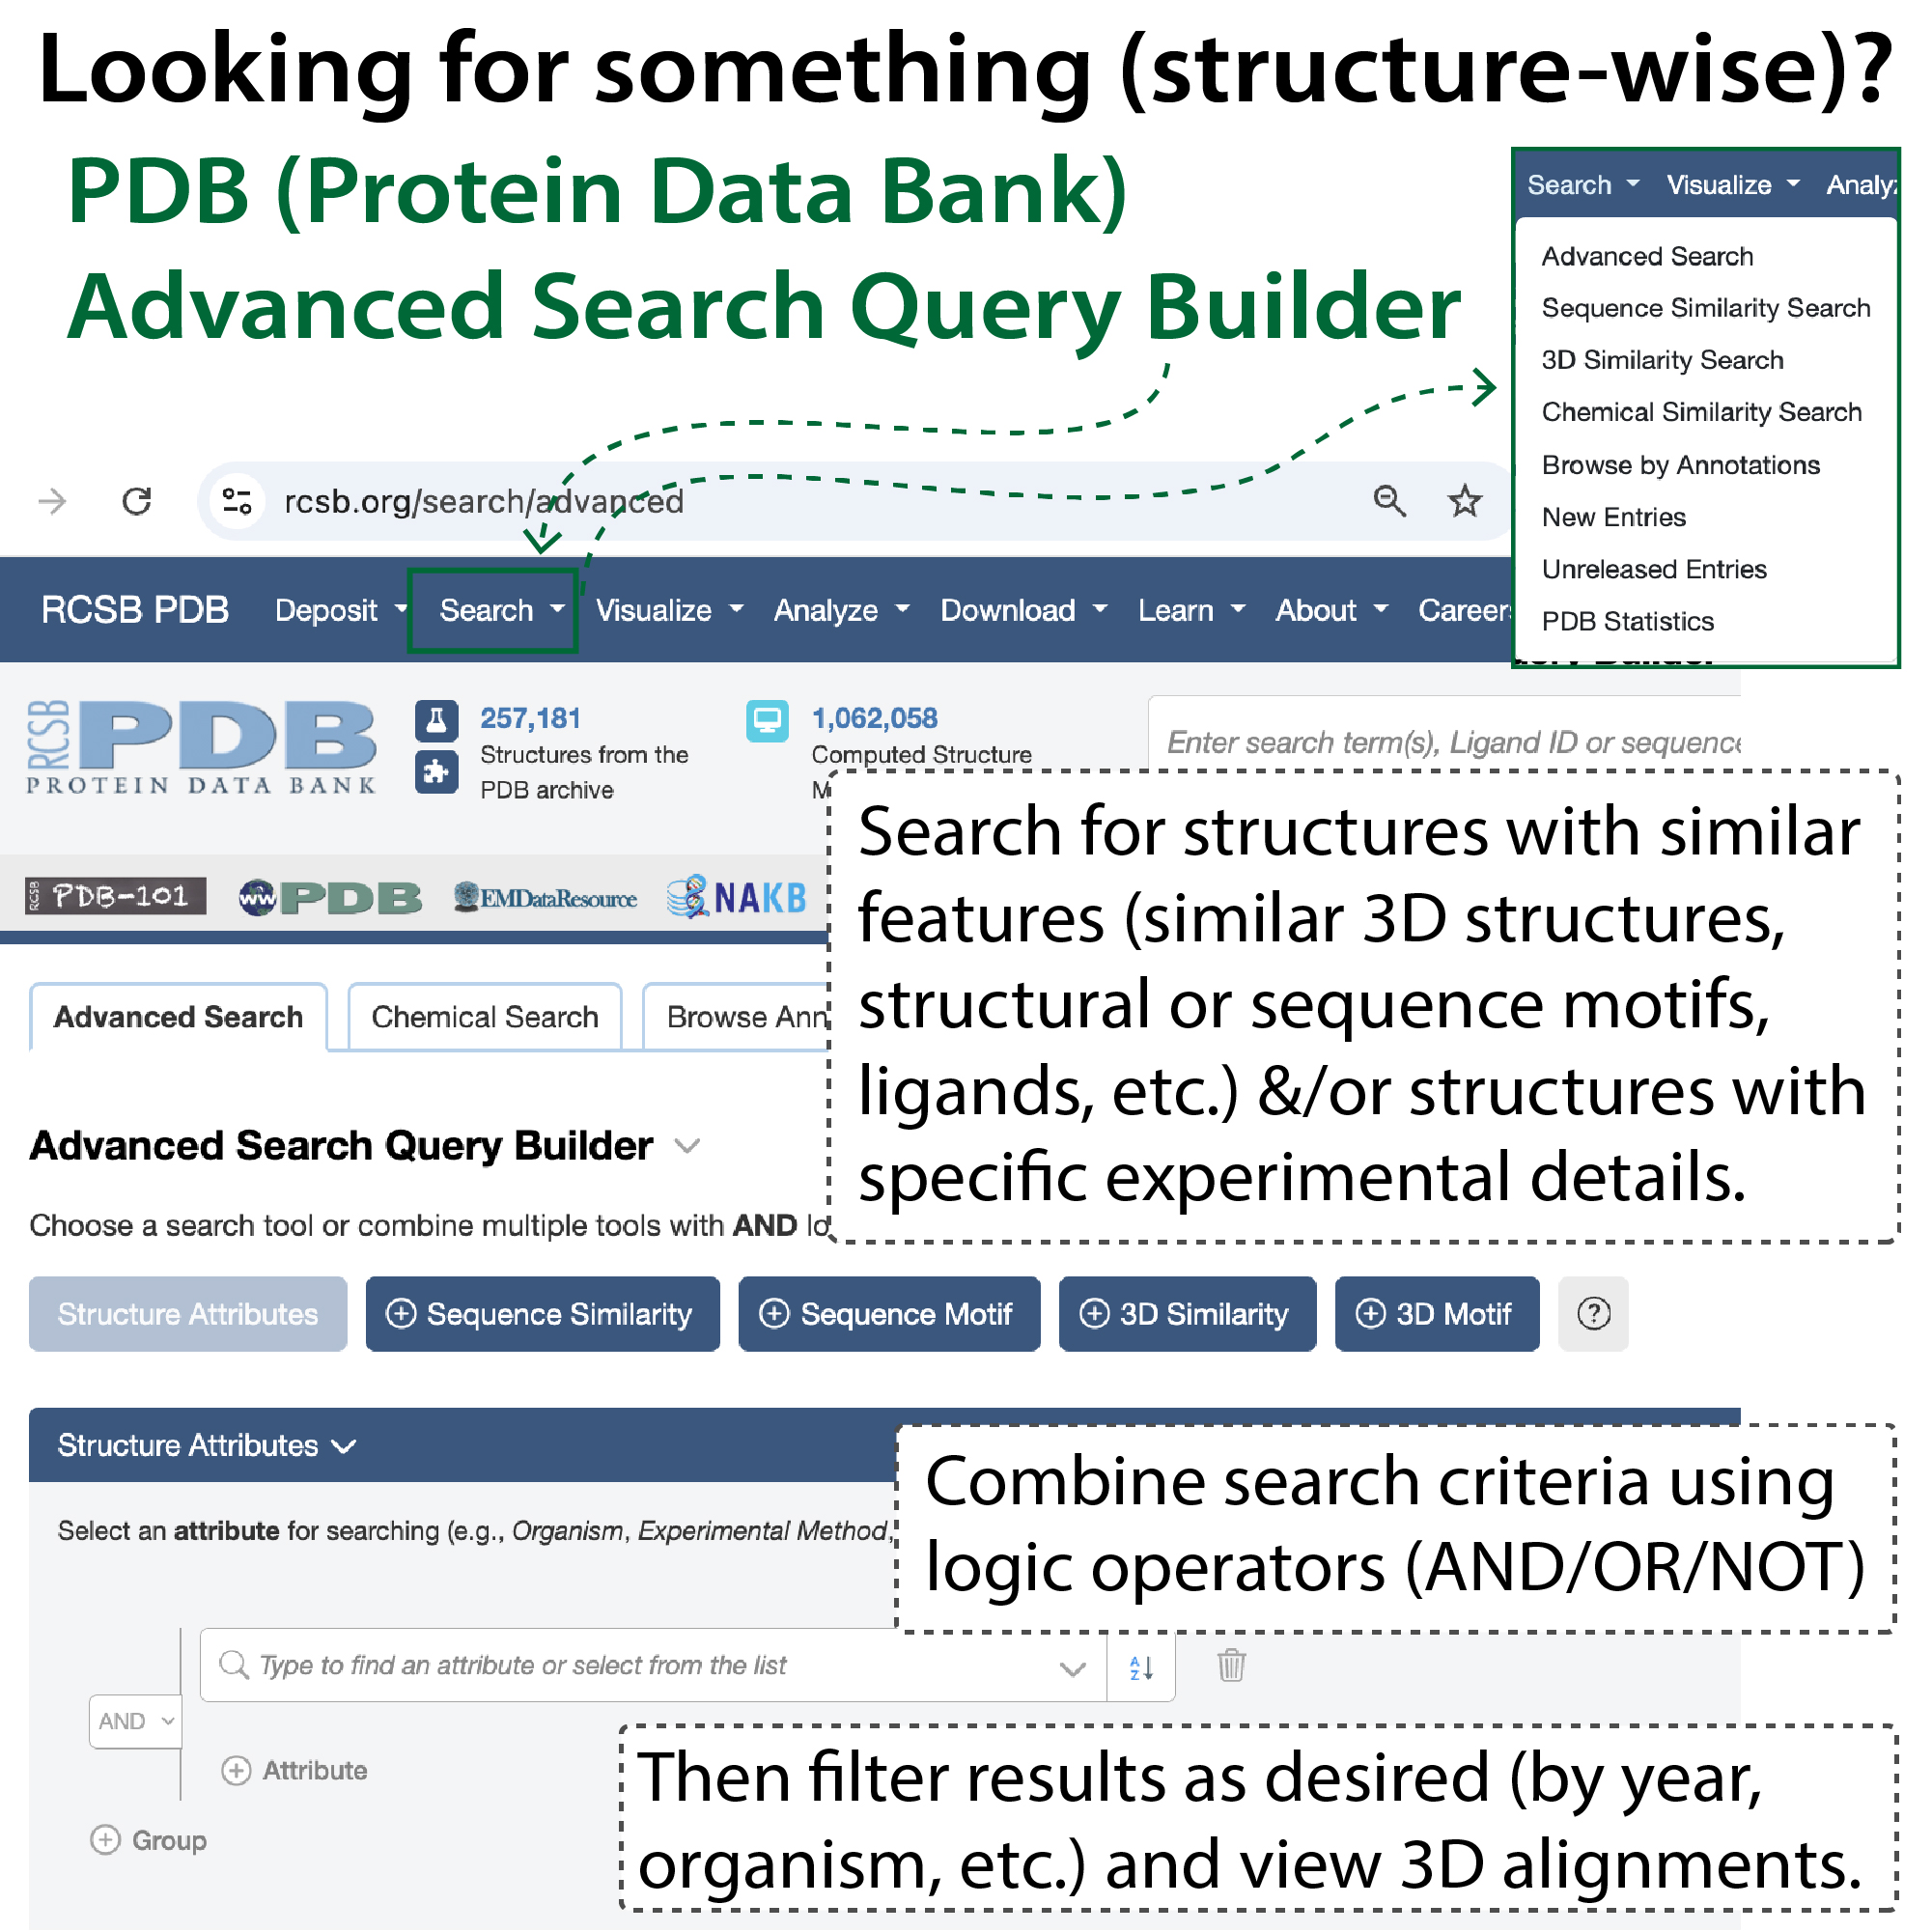
- Advanced Search Query Builder – allows you to search for proteins based on similar sequences, structures, motifs, experimental methods, ligands, etc., narrowing things down using logic operators (AND/OR/NOT) etc. to find exactly what you want. More here: https://youtu.be/iSM6orTve-Y
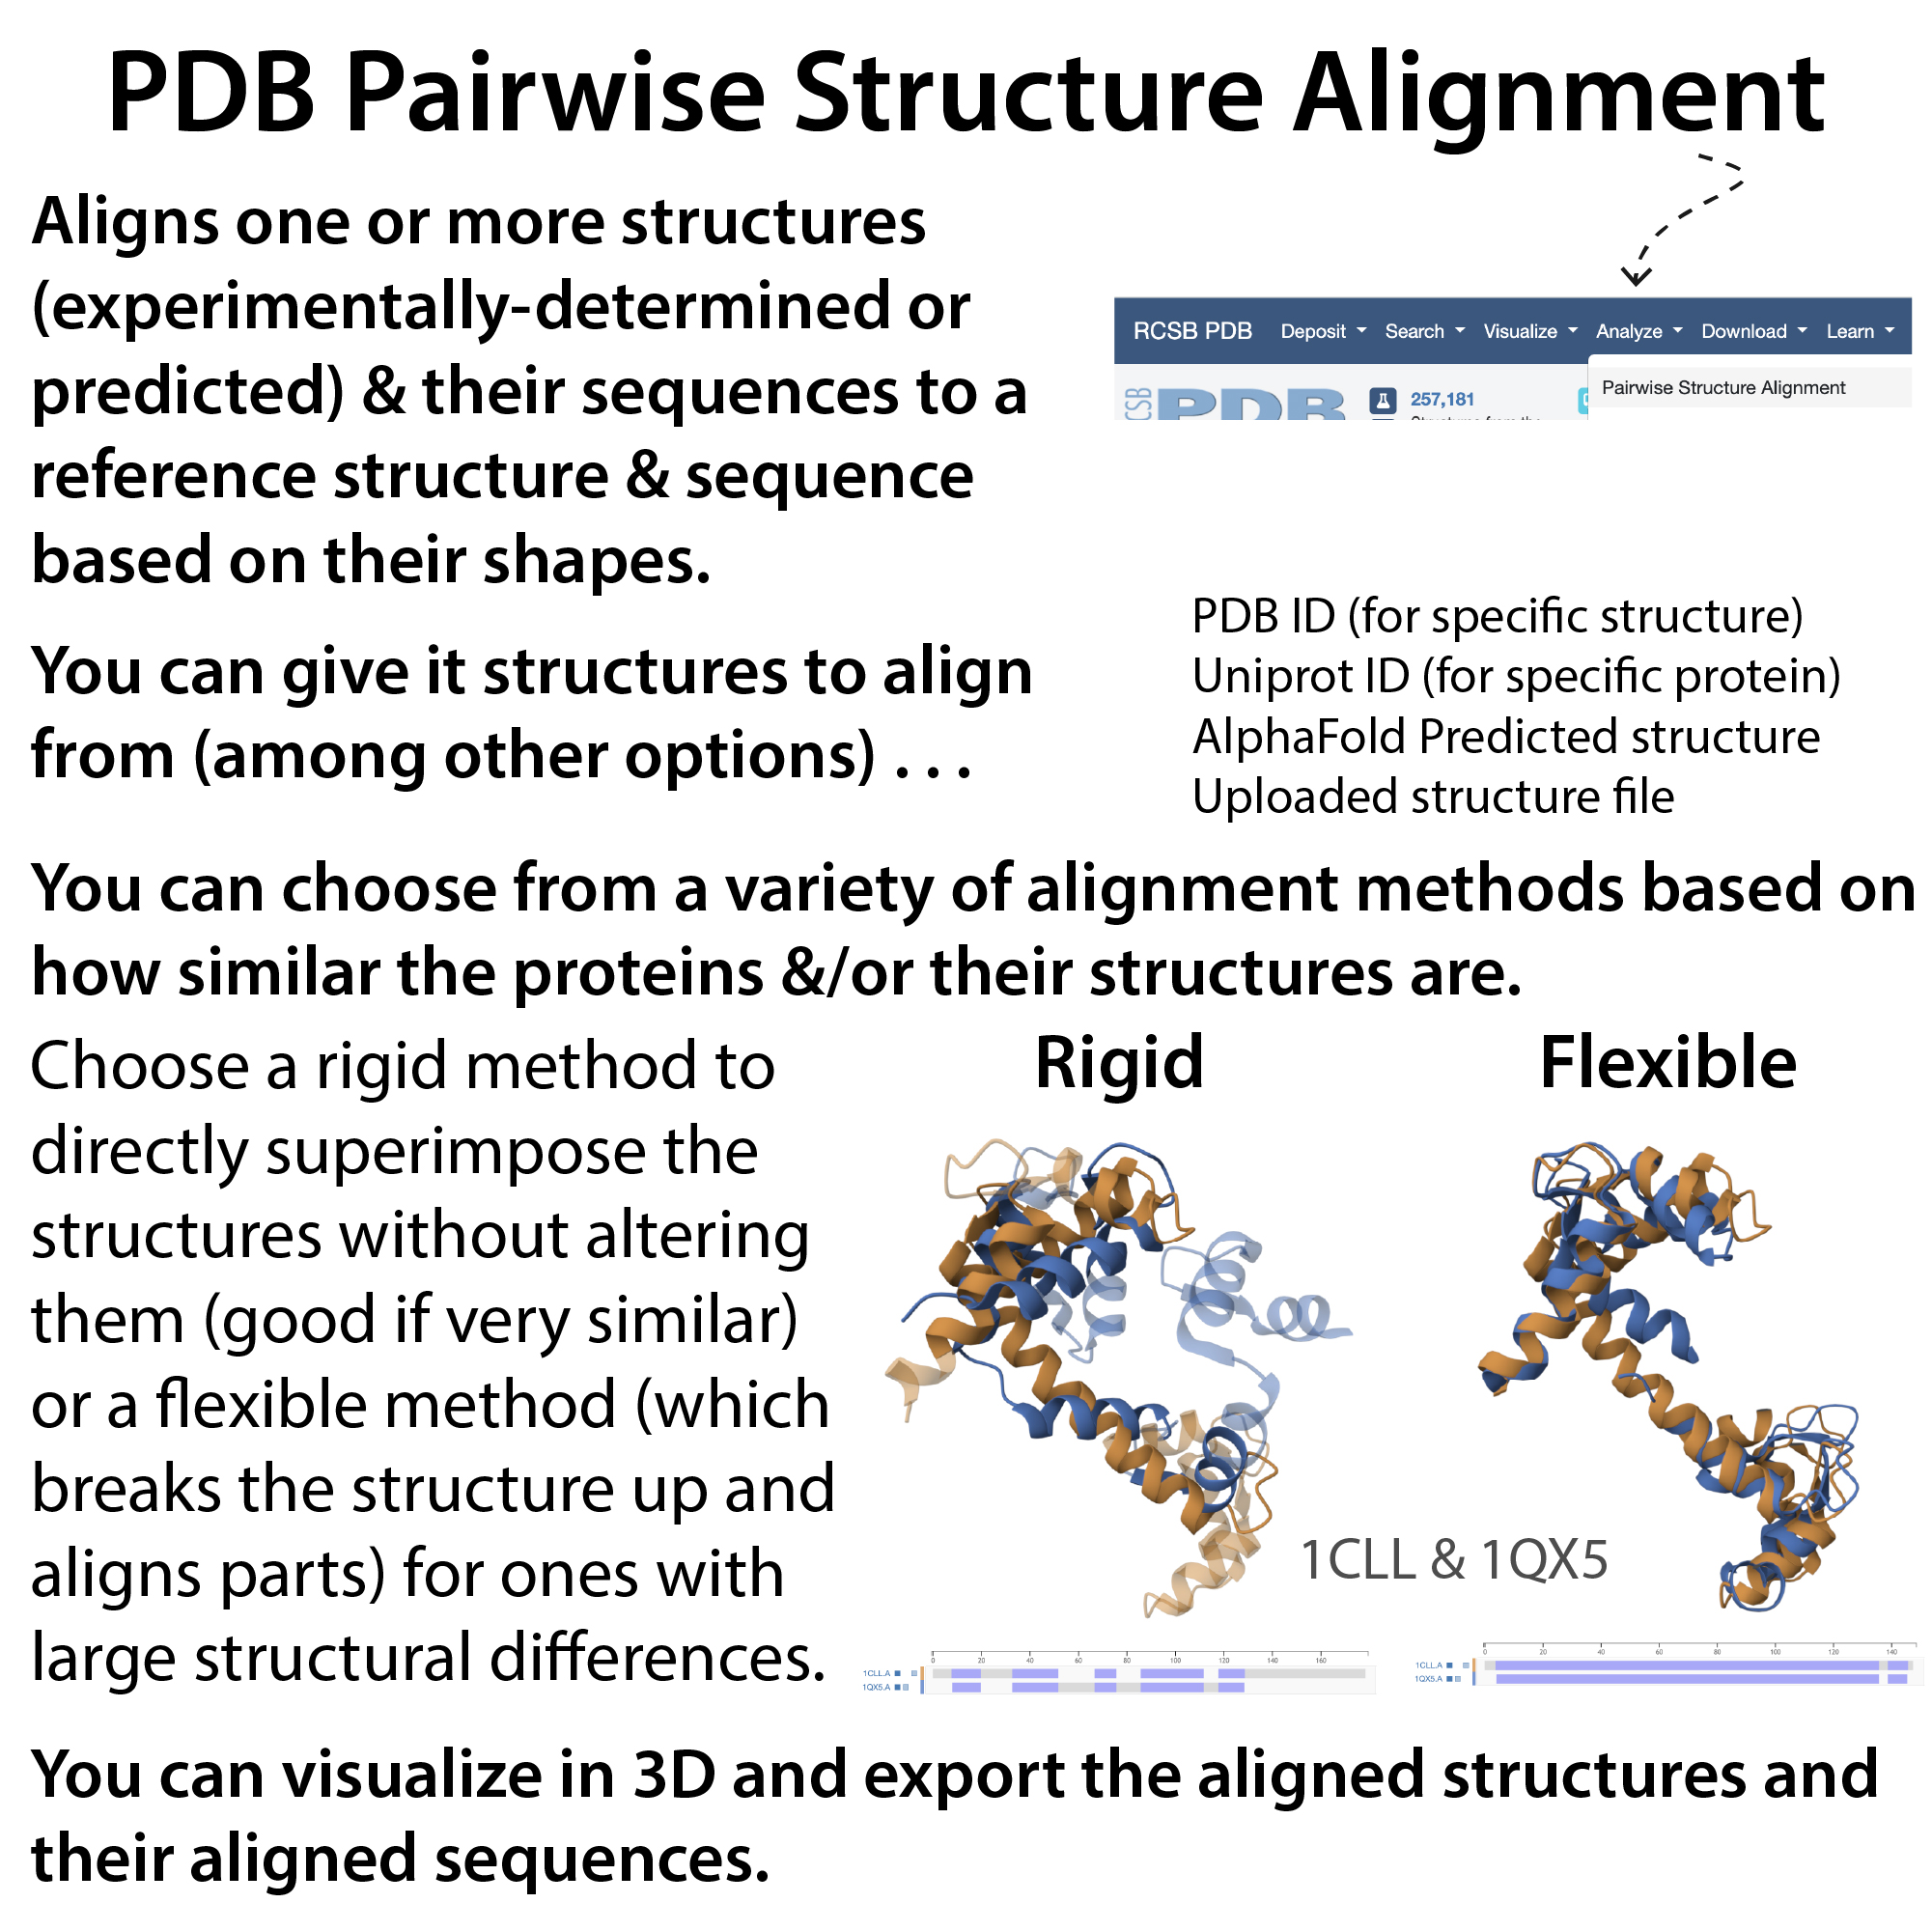
- Pairwise Structure Alignment – compare structures based on their shapes – Unlike Clustal, which aligns protein sequences based on their sequences, the PDB Pairwise Structure Alignment tool aligns one or more structures (experimentally-determined or predicted) and their sequences to a reference structure and sequence based on their shapes. More here: https://youtu.be/MOBMBuAIAKo
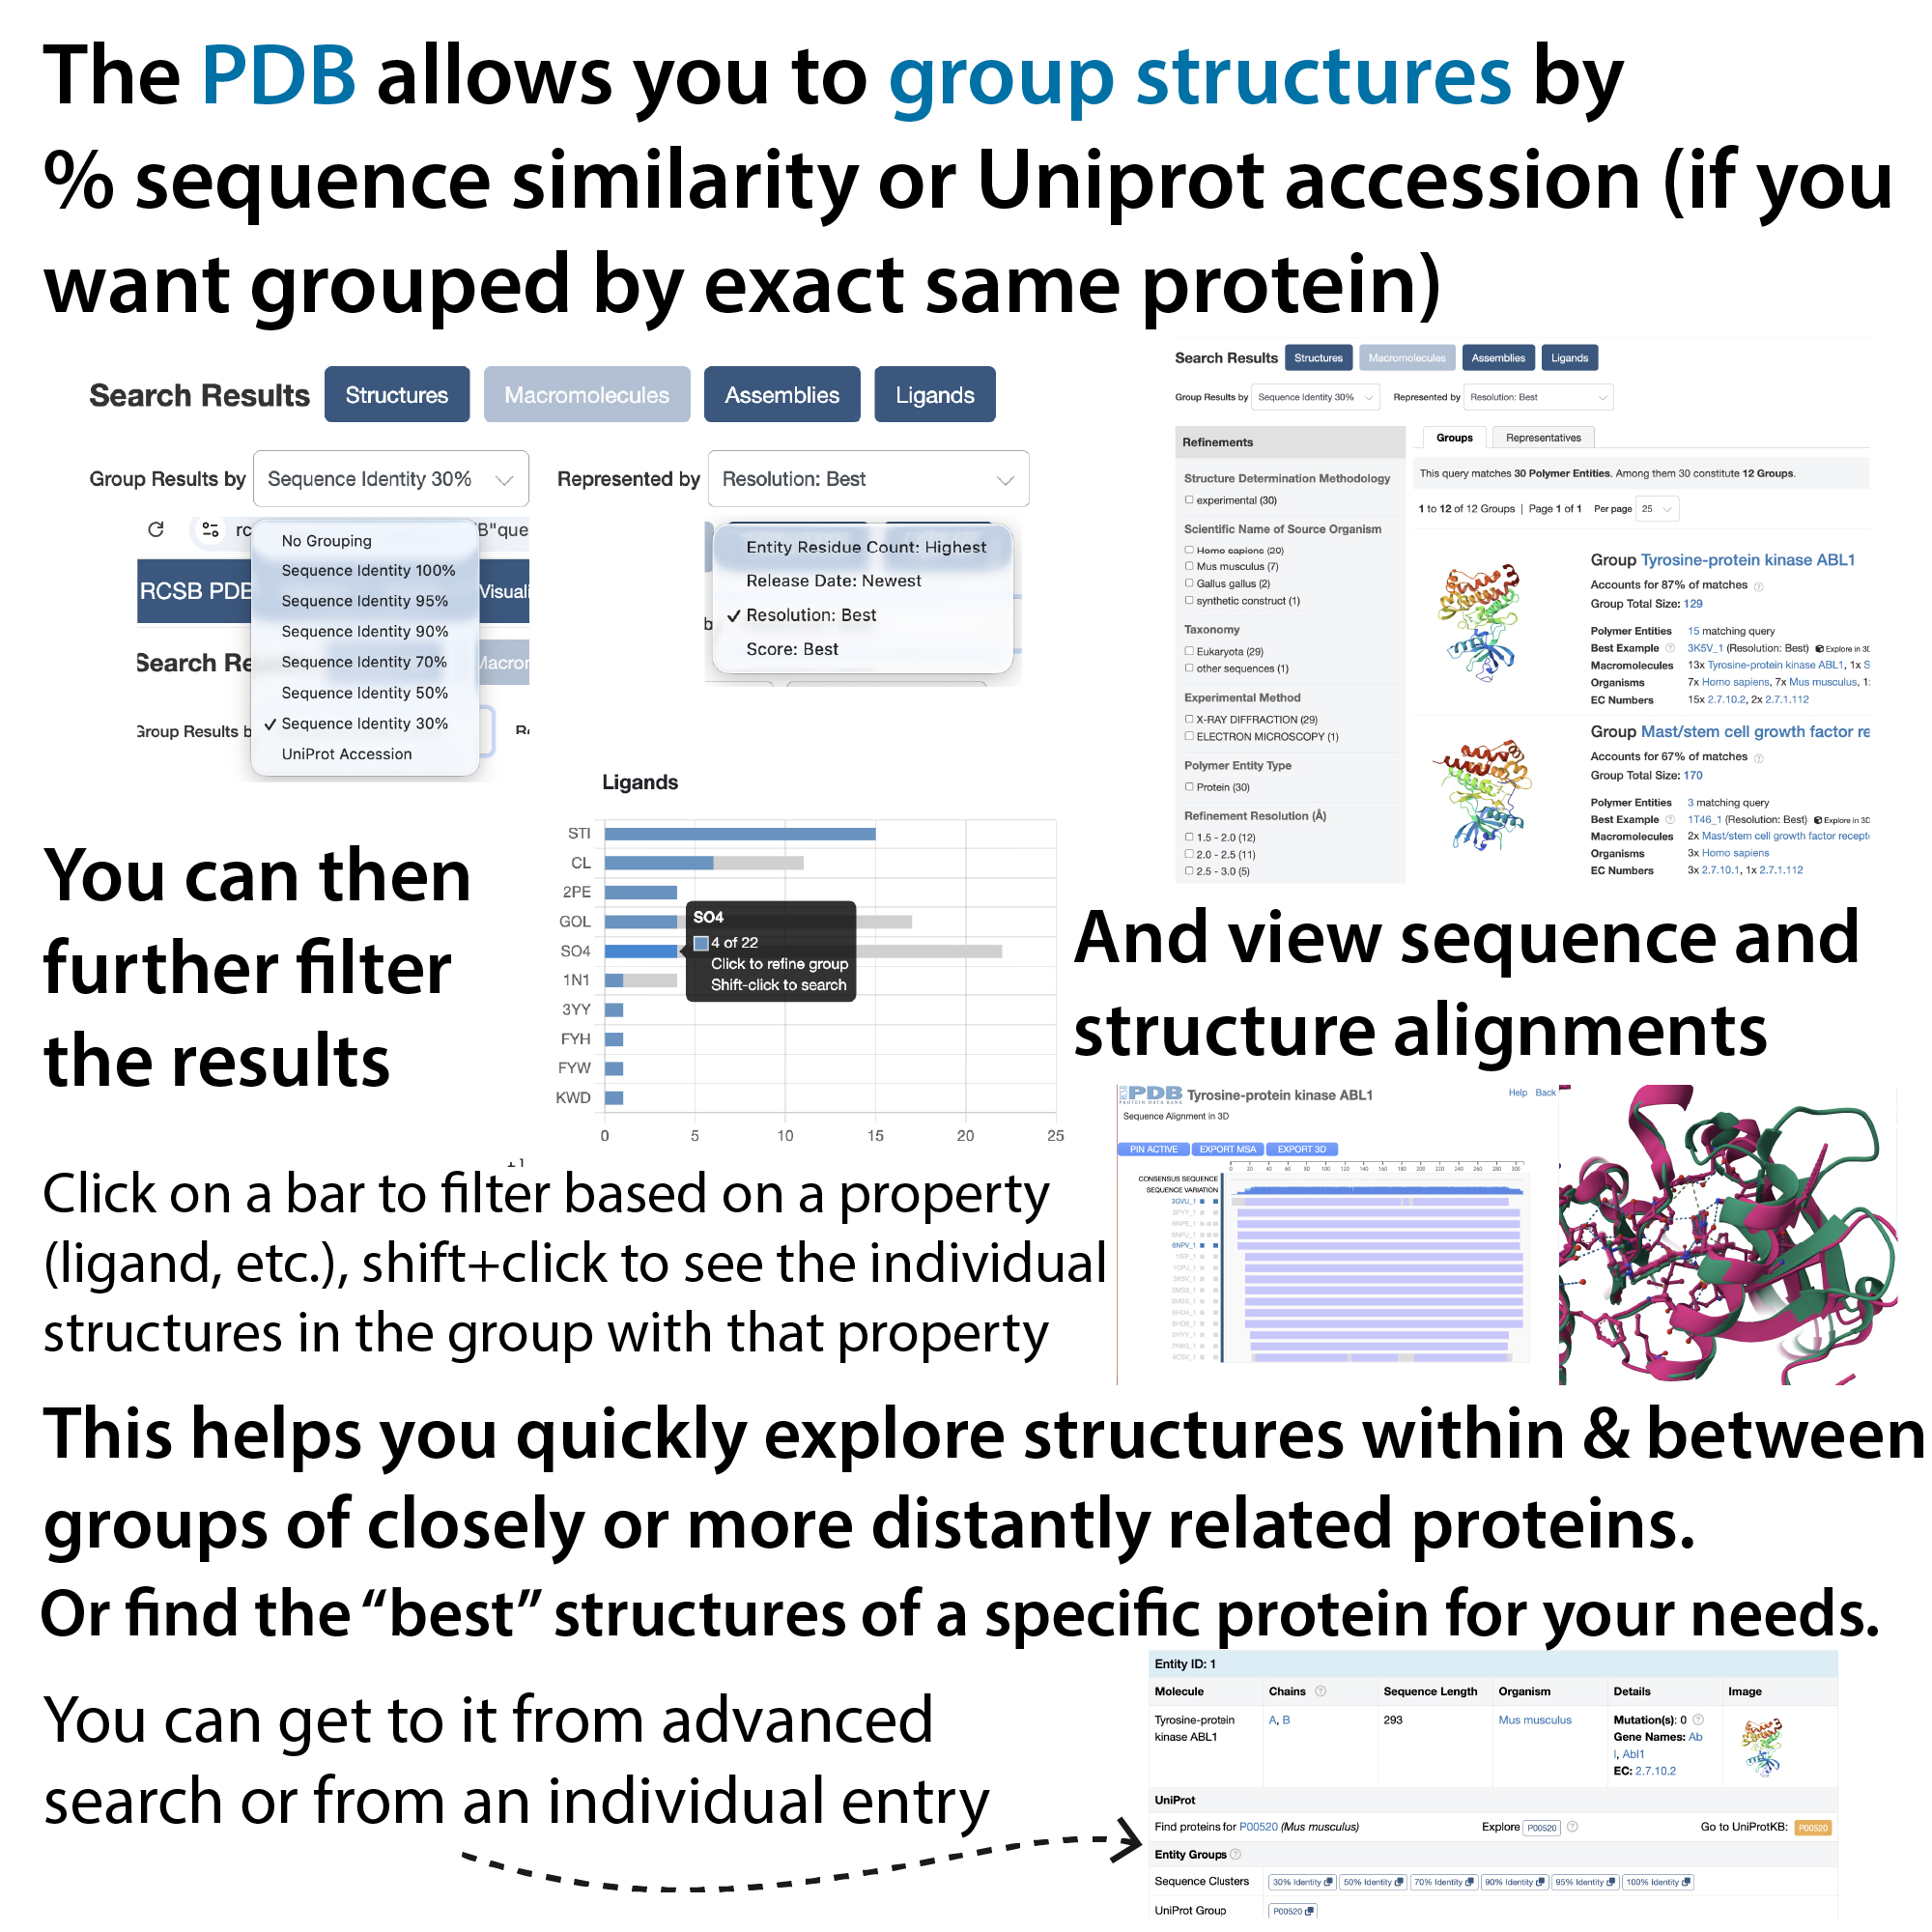
- Structure grouping – group structures by % sequence similarity or Uniprot accession (if you want grouped by exact same protein). You can then further filter the results (Click on a bar to filter based on a property (ligand, etc.), shift+click to see the individual structures in the group with that property). And view &/or export sequence and structure alignments. This helps you quickly explore structures within & between groups of closely or more distantly related proteins. Or find the “best” structures of a specific protein for your needs. You can get to it from advanced search or directly from an entry. More here: https://youtu.be/07gRZXI5uCU
- RCSB Help Guide – super detailed guide to all things PDB, with hyperlinked examples, etc. https://www.rcsb.org/docs/tools/pairwise-structure-alignment
- PDB 101: Great educational and teaching resources, as well as a fun molecule of the month feature: If you go to this page in the “learn” tab, you’ll find this Introduction to PDB Data: http://pdb101.rcsb.org/learn/guide-to-understanding-pdb-data/introduction
Expasy ProtParam
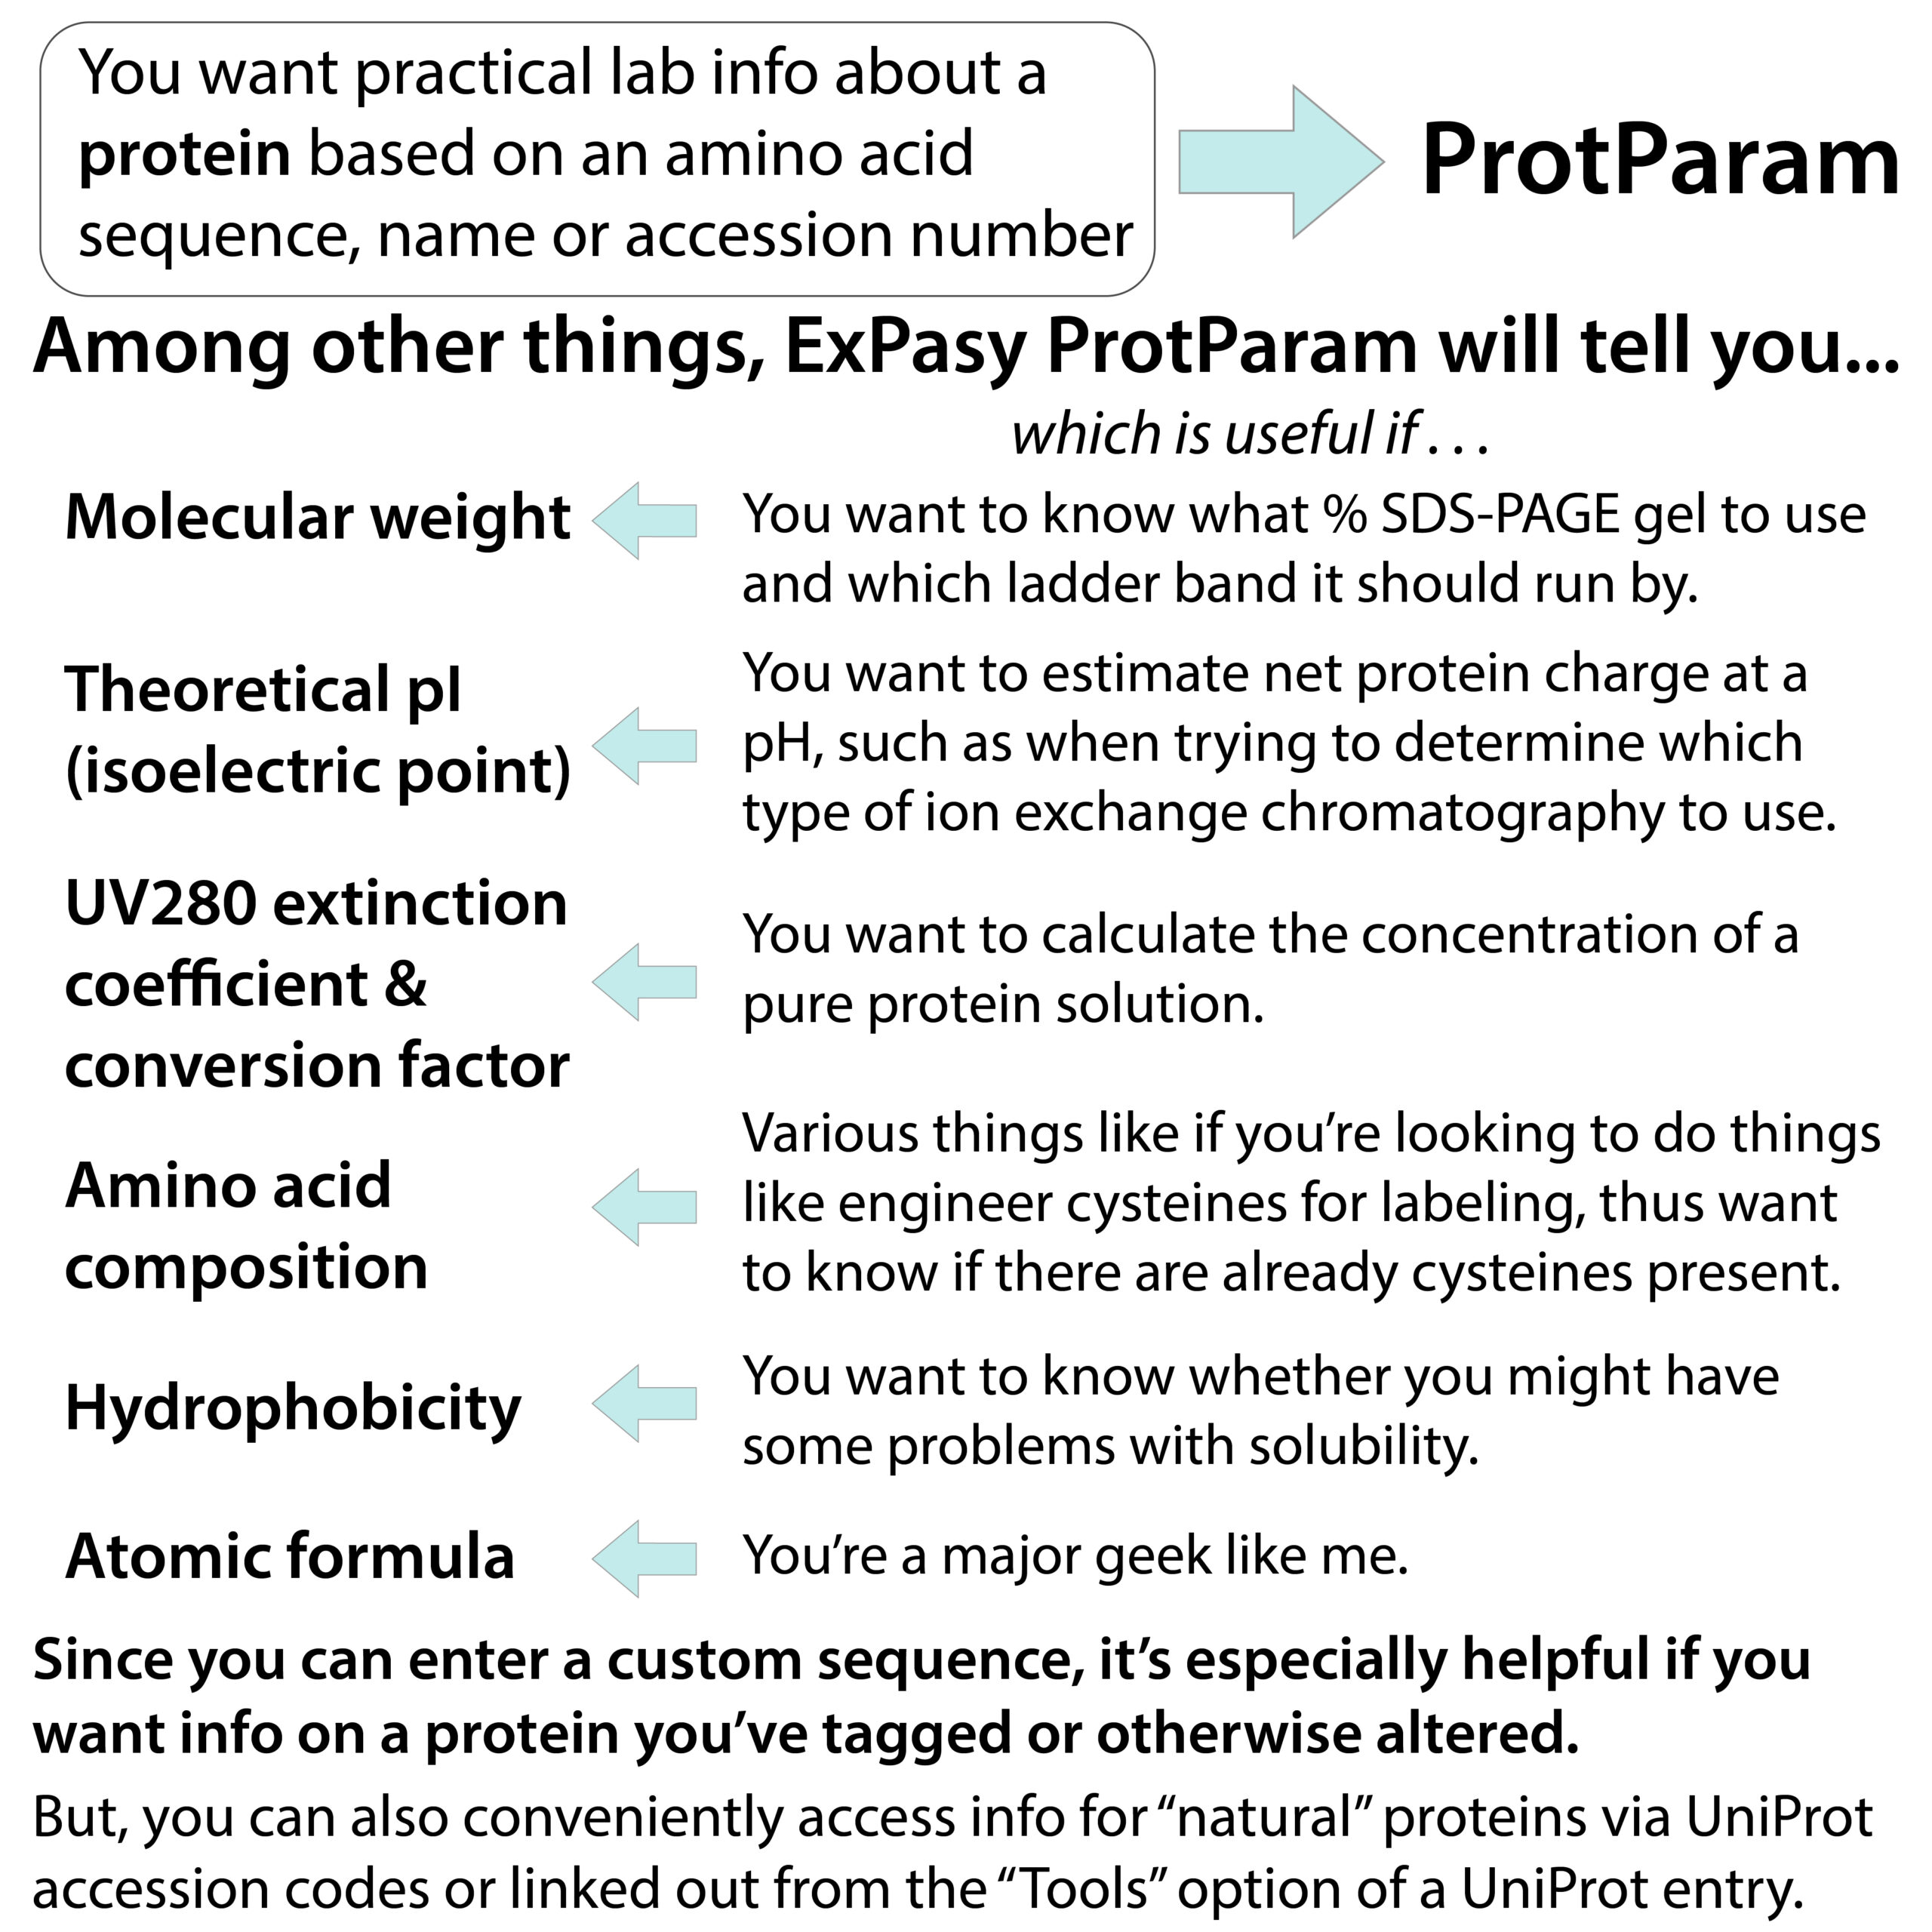
ExPasy ProtParam is the place to go if you want to know the nitty-gritty about a protein you’re studying. It lets you calculate pI, molecular weight, extinction coefficient, & more). And you can access “wild-type” (normal version of a protein) info or you can paste in your own sequence, which is super helpful if you’re working with recombinant protein expression and have modified the protein to add an affinity tag for purification or removed a floppy part or something. So it’s a protein biochemist’s friend!
Here’s a link to it: https://web.expasy.org/protparam/
It tells you a bunch of info. “Basic” things like how long the protein is (# of amino acids) and how “big” it is (molecular weight, in Daltons (Da). It even tells you the number of atoms!
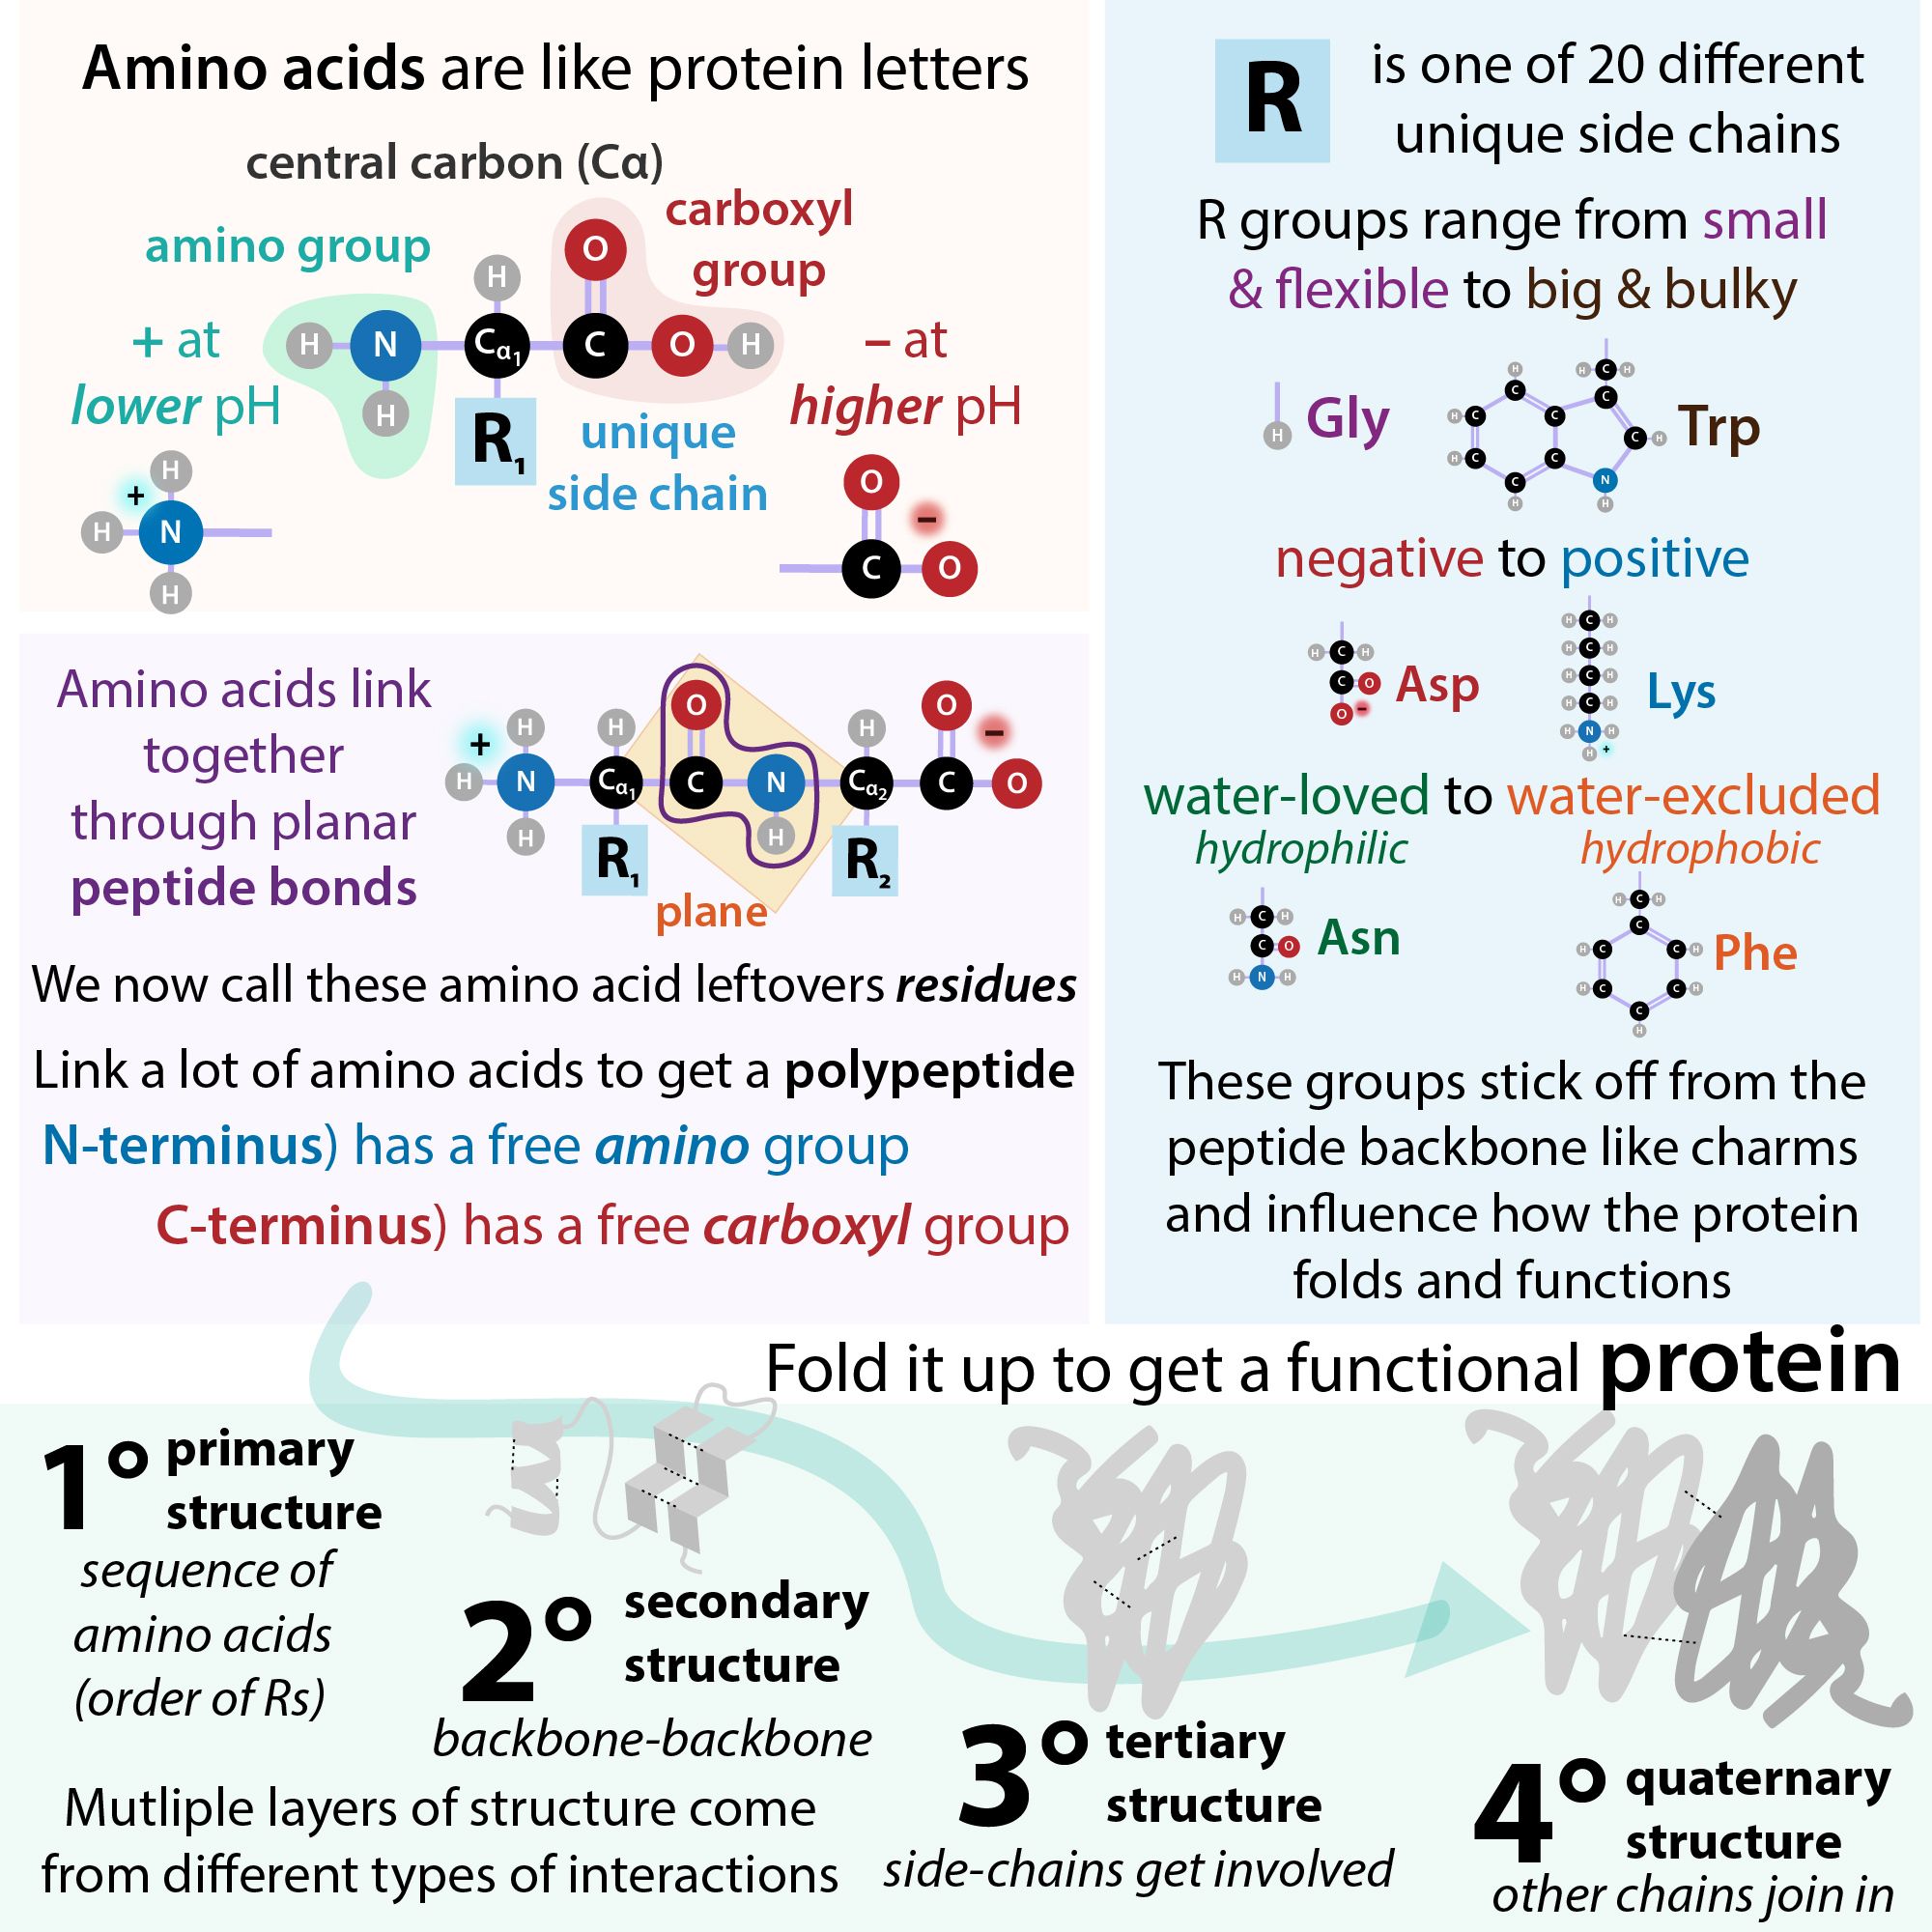
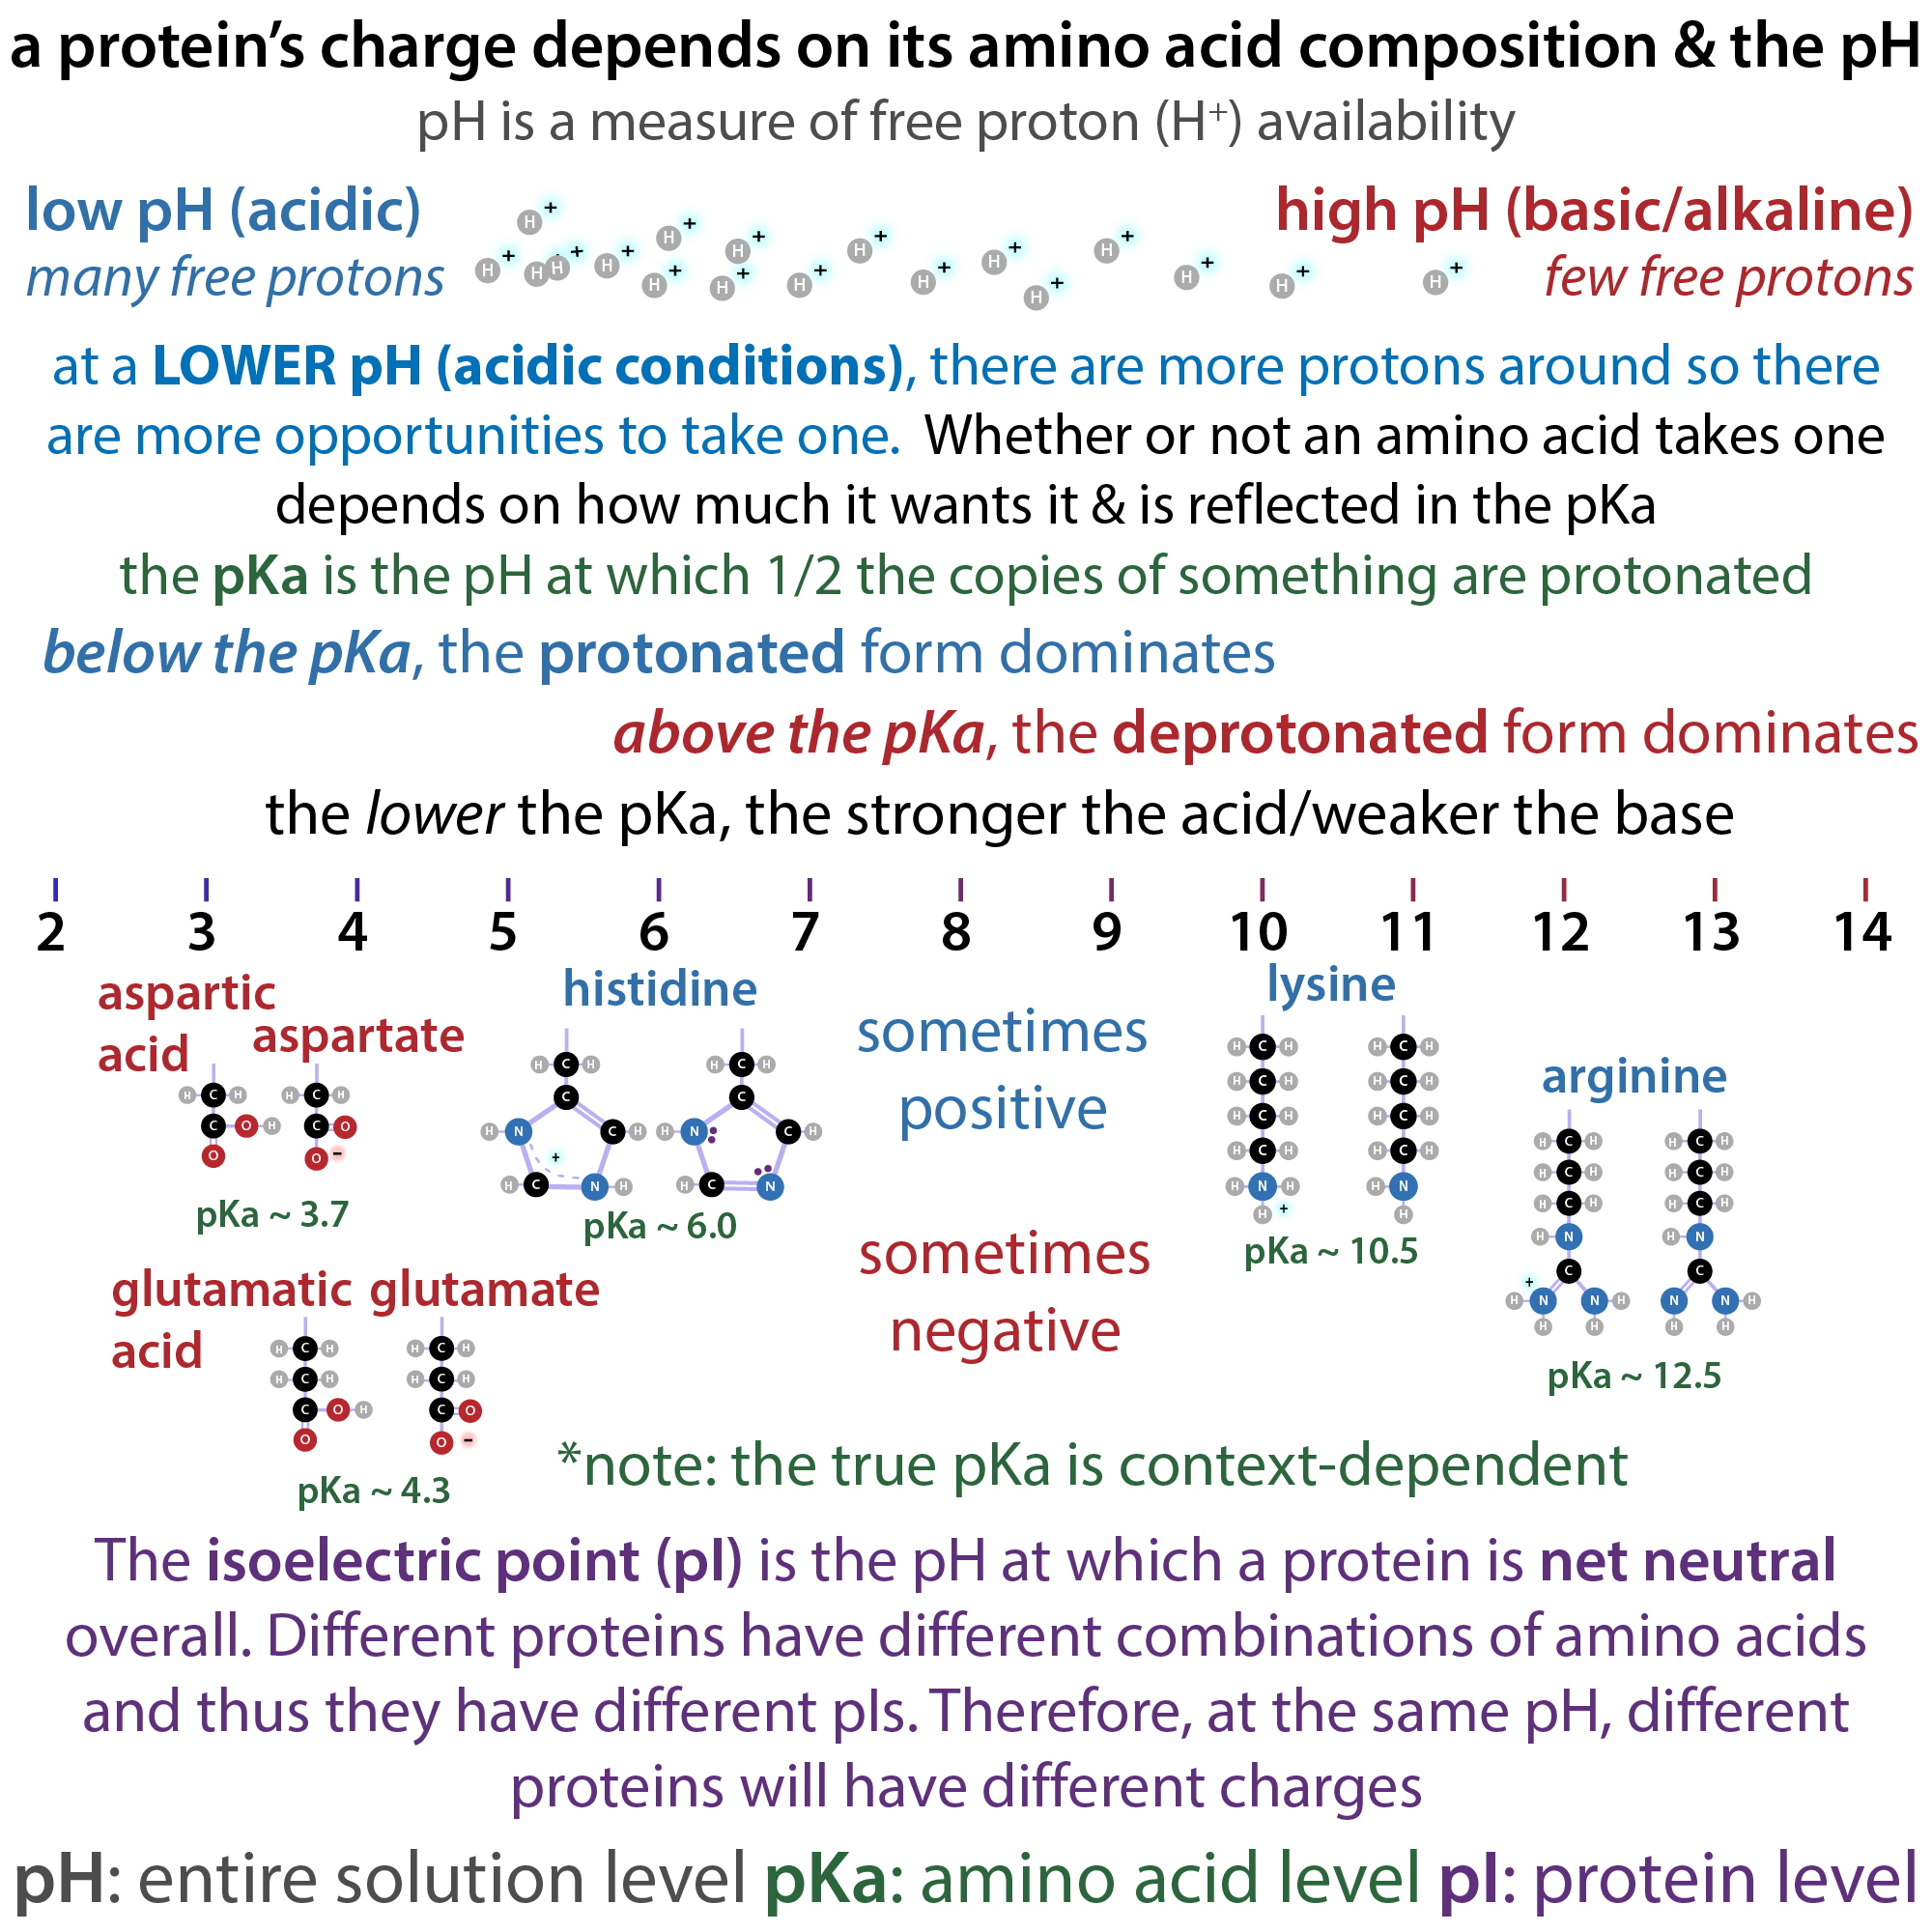
It also tells you about how “basic” the protein is – in terms of how many “basic” (i.e. usually positively-charged) amino acids a protein has.
This will impact the pI (isoelectric point) which is the pH at which the protein is neutral overall. Go below that pH and there are “excess” protons available, and the protein will be positively-charged on average. Go about that pH and there are “too few” protons available, so the protein will be negatively-charged. ProtParam tells you the theoretical pI which is super useful for doing charge-based protein purification (i.e. ion exchange chromatography). If your protein has a low pI, we say it’s “acidic” and usually use anion exchange. If your protein has a high pI, we say it’s “basic” and usually use cation exchange. more on all this here: https://bit.ly/isoelectricpoint & https://youtu.be/CLgzYBm_ymk and more ion exchange chromatography here: blog form: http://bit.ly/ionexchangechromatography ; YouTube: https://youtu.be/RGF1l572IZY
It also gives you the extinction coefficient. WAY more on this here: http://bit.ly/bradforduv & http://bit.ly/proteinmeasuring
but the key thing is it allows you to calculate a (pure) protein’s concentration based on how much UV light it absorbs.
Extinction coefficients tell you the absorbance value (A) that corresponds to 10 mg/mL (1%) or 1 mg/mL (0.1%). Those percentages come from the weight/volume percentage convention that a 1% solution corresponds to 1 g/100 mL – more on why here: http://bit.ly/weightvolume & https://youtu.be/uo0Lx_OmKBA
You can calculate the estimated extinction coefficient using free online software tools like Expasy ProtParam. I say estimated because context matters – the local environment around the absorbing part can influence how eager it is to absorb a photon
When I do this for BSA I see this:
Extinction coefficients:
Extinction coefficients are in units of M-1 cm-1, at 280 nm measured in water.
Ext. coefficient 42925
Abs 0.1% (=1 g/l) 0.638, assuming all pairs of Cys residues form cystines
Ext. coefficient 40800
Abs 0.1% (=1 g/l) 0.607, assuming all Cys residues are reduced
First it tells me the values under oxidizing conditions and below that it tells me the values under reducing conditions (the intracellular environment is reducing and we usually add reducing agents like DTT or β-mercaptoenthanol) to protein solutions to keep them happy outside the cell). It tells me this because cysteine crosslinks can also absorb, where applicable.
Then I can plug this into Beer’s law (or have the computer do it for me) if I measure the absorbance.
You measure this absorbance using something called a spectrophotometer. Basically it shines light through a solution and measures to what extent different wavelengths make it through (are transmitted) versus don’t make it through (are absorbed). This can be converted into concentration of solute (dissolved molecules) using Beer’s Law
The equation is: A = εcl
A = absorbance
ε = extinction coefficient (aka molar absorptivity coefficient) – specific for particular molecule & particular wavelength; units of L mol-1cm-1
c = concentration (in mol/L) – this is molarity – a mole is just a chemist’s “baker’s dozen” – it’s Avogadro’s number (6.022 x 10^23) of something – solute molecules or donuts, it’s just a number http://bit.ly/2r4RnrX
l = path length (in cm)
For Beer’s Law, you only need the absorbance at a single wavelength – but there’s much more to learn if you look at the whole spectrum (or at least a couple key values). Because molecules have overlapping spectra (e.g. both DNA & RNA absorb light of 260nm wavelength) you look to ratios.
Proteins absorb most strongly at 280, and this is where we typically calculate from. Proteins also absorb at 230nm and that absorbance is from the generic backbone part – corresponds to absorbance by the peptide bonds linking the letters. These peptide bonds also have resonance, but not as much as rings do, and they absorb ~190-230nm.
Because DNA absorbs so strongly at UV260, where protein doesn’t, it’s relatively easy to see if you have DNA in your protein prep, but it’s harder to tell if you have protein in your DNA prep – 260 will dominate the 260/280 ratio
Moral of the story: there’s no “one right way” to count your proteins & it’s important to carefully choose the one you use!
Looking for similar proteins?
If you want to find proteins that are similar:
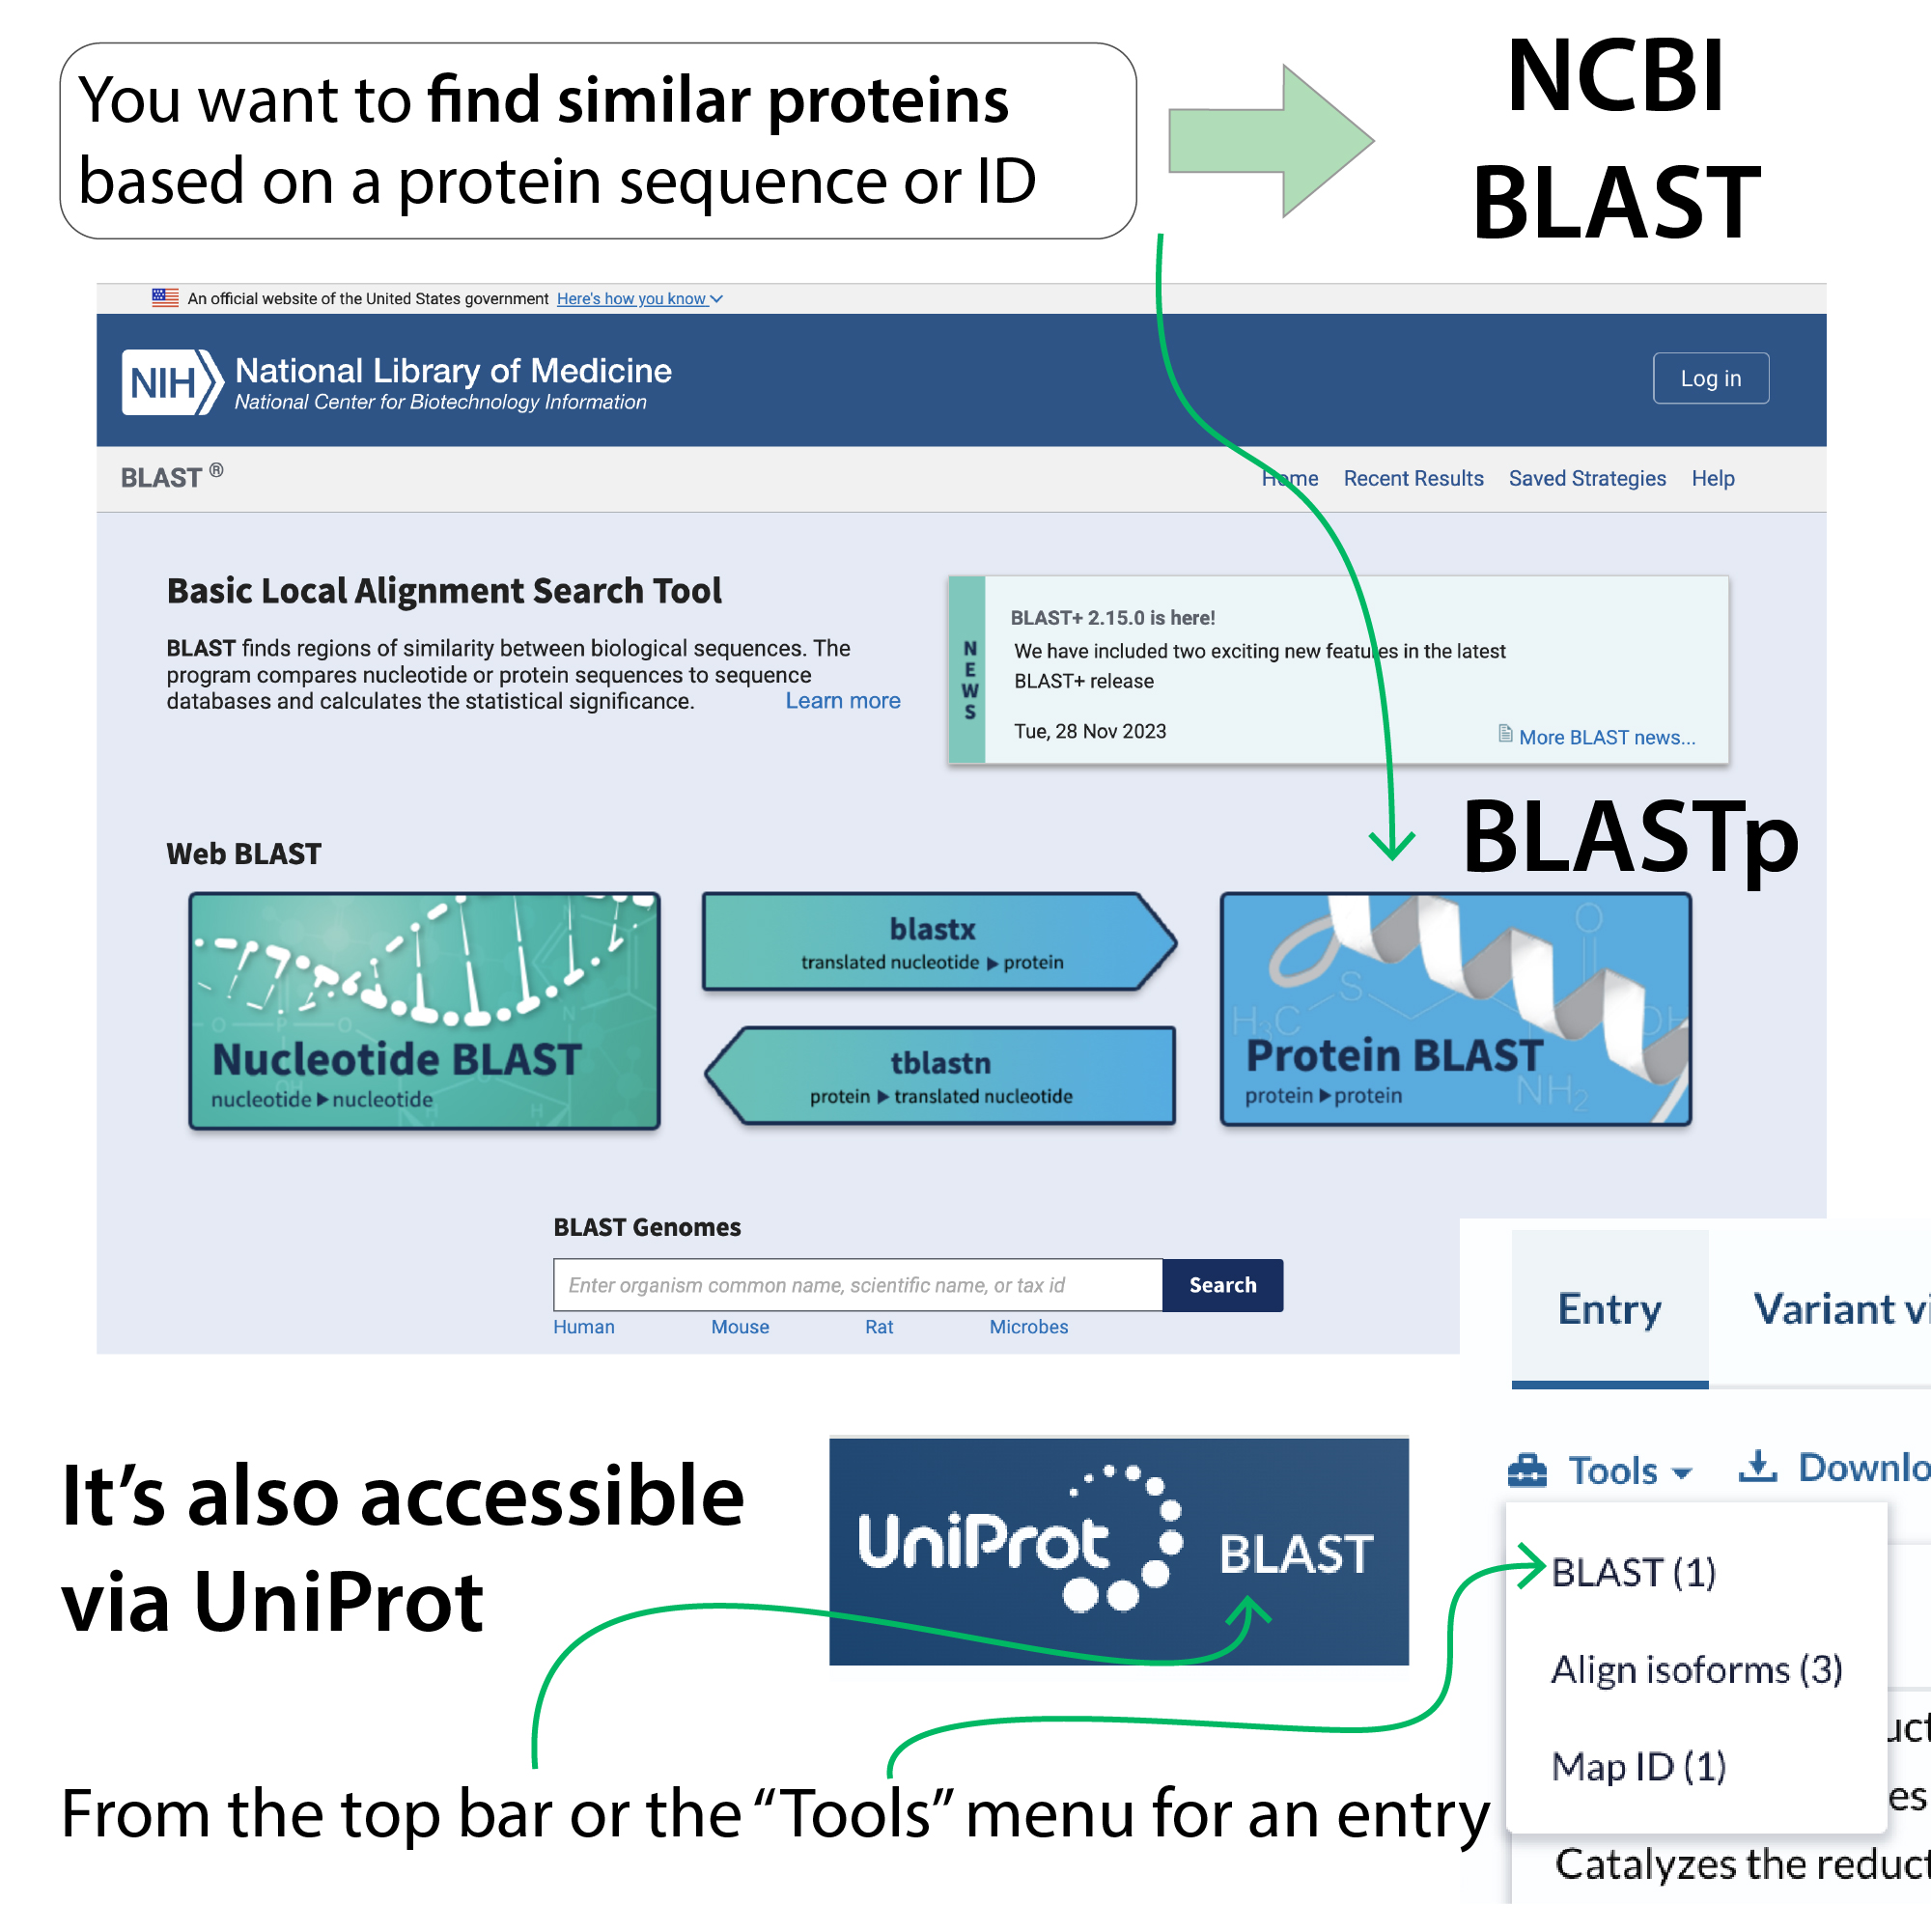
- In sequence: BLAST (specifically blastp): This searches protein databases for protein sequences. and takes into account both sequence identity (are the amino acids in the sequences identical at a given location) and similarity (are the amino acids in the sequences biochemically similar at a given location)
- You can access it directly or through UniProt https://blast.ncbi.nlm.nih.gov/Blast.cgi?PROGRAM=blastp&PAGE_TYPE=BlastSearch&LINK_LOC=blasthome
- In structure: Foldseek: Foldseek is really cool. It compares structures against one another to find similar ones. What’s even cooler is that it searches both experimentally-determined structures (housed in the PDB) and AI-predicted (AlphaFold Protein Structure DataBase (AFDB)) structures. And can even predict a structure from a sequence and then use that as input. It’s also integrated into the AlphaFold database so you can get results there too.
- You can access the web version of it here: https://search.foldseek.com/search
- Or the open-access code to run it in command line is here: https://github.com/steineggerlab/foldseek
- It’s also integrated into the AlphaFold database so you can get results there too https://alphafold.ebi.ac.uk/
NCBI BLAST
the US National Institute of Health (NIH) has a National Center for Biotechnology Information. And they host a website called Basic Local Alignment Search Tool which compares biological sequences you put in to all (or a selected subset) of the sequences in the database. https://blast.ncbi.nlm.nih.gov/Blast.cgi
You can think of it a bit like 23andMe/Ancestry.com for biological molecules. There are a number of different versions of it depending on what you want to compare – nucleotides (DNA or RNA), protein sequences, etc. – and you can choose how stringent you want the comparison to be (e.g. do you only want to find perfect matches, or are you looking for some more evolutionarily-distant relatives?) The NCBI has a BLAST Program Selection Guide you can look at if you want all the details https://www.ncbi.nlm.nih.gov/blast/BLAST_guide.pdf But here’s the gist and when they may be helpful
nucleotide blast (aka blastn): this is for searching for/comparing nucleotide (DNA or RNA) sequences. I use this sometimes when I get back sequencing results from some of my cloned plasmids and I have absolutely no clue what was amplified… I can search for the amplicon and figure out where that sequence came from (often from somewhere else on the plasmid or from some contaminating bacterial genomic DNA)
blastx: this is for if you want to put in “translated nucleotides” and figure out what protein they correspond to – remember “x” for “exons” or “expressed.” With blastn, you are often searching genomic DNA – so parts that have protein-making instructions (coding parts aka exons) and parts that “just” have regulatory instructions (non-coding parts – introns (parts between exons that get removed during mRNA processing) and intergenic regions (parts between genes)). But with blastx, you’re putting in just protein-coding parts. For example, the sequence might correspond to a messenger RNA (mRNA), which is the edited RNA copy of a gene that is used by ribosomes to make the encoded protein in a process called translation. What blastx does is it takes the sequence you enter and “pretends it’s a ribosome” – it (in make-believe-land) translates all 6 possible open reading frames (ORFs) and then compares the resultant amino acid sequences to the amino acid sequences of known proteins.
Why might it be useful? Many amino acids can be spelled by multiple codons. So the codons can change while the protein itself stays the same and thus two DNA sequences might not look very similar even though the proteins look very similar. If you just used blastn you wouldn’t pick up on the similarity but you would find it with blastx. Conversely, if a sequence looks kinda similar at the DNA level but is in an intron or an intergenic region or is in a different reading frame in its natural context or something you could get “false hits” if you used blastx to try to find proteins.
It’s also useful if you want to detect coding regions in a sequence (genes aren’t obvious!). So say you have a long DNA sequence and you want to see what part of it actually has protein-making instructions. You could stick it in blastx and the protein-instruction parts will give you hits.
tblastn: this is the opposite of blastx. Here you’re taking a protein sequence and trying to find genes that code for it (or similar proteins). Maybe, for instance, you want to find the genes for versions of that protein in other species (homologs). So, if you put in EGADS, what it would find open reading frames that would make it. Problem is, since there are multiple spellings for each letter, there are lots of possible open reading frames, so what it does is, instead of trying to generate all the “what ifs” it generates the “whats” – it searches through a database of translated nucleic acids.
tblastx: search translated nucleotides for translated nucleotides
protein blast (blastp): this searches protein databases for protein sequences
Foldseek
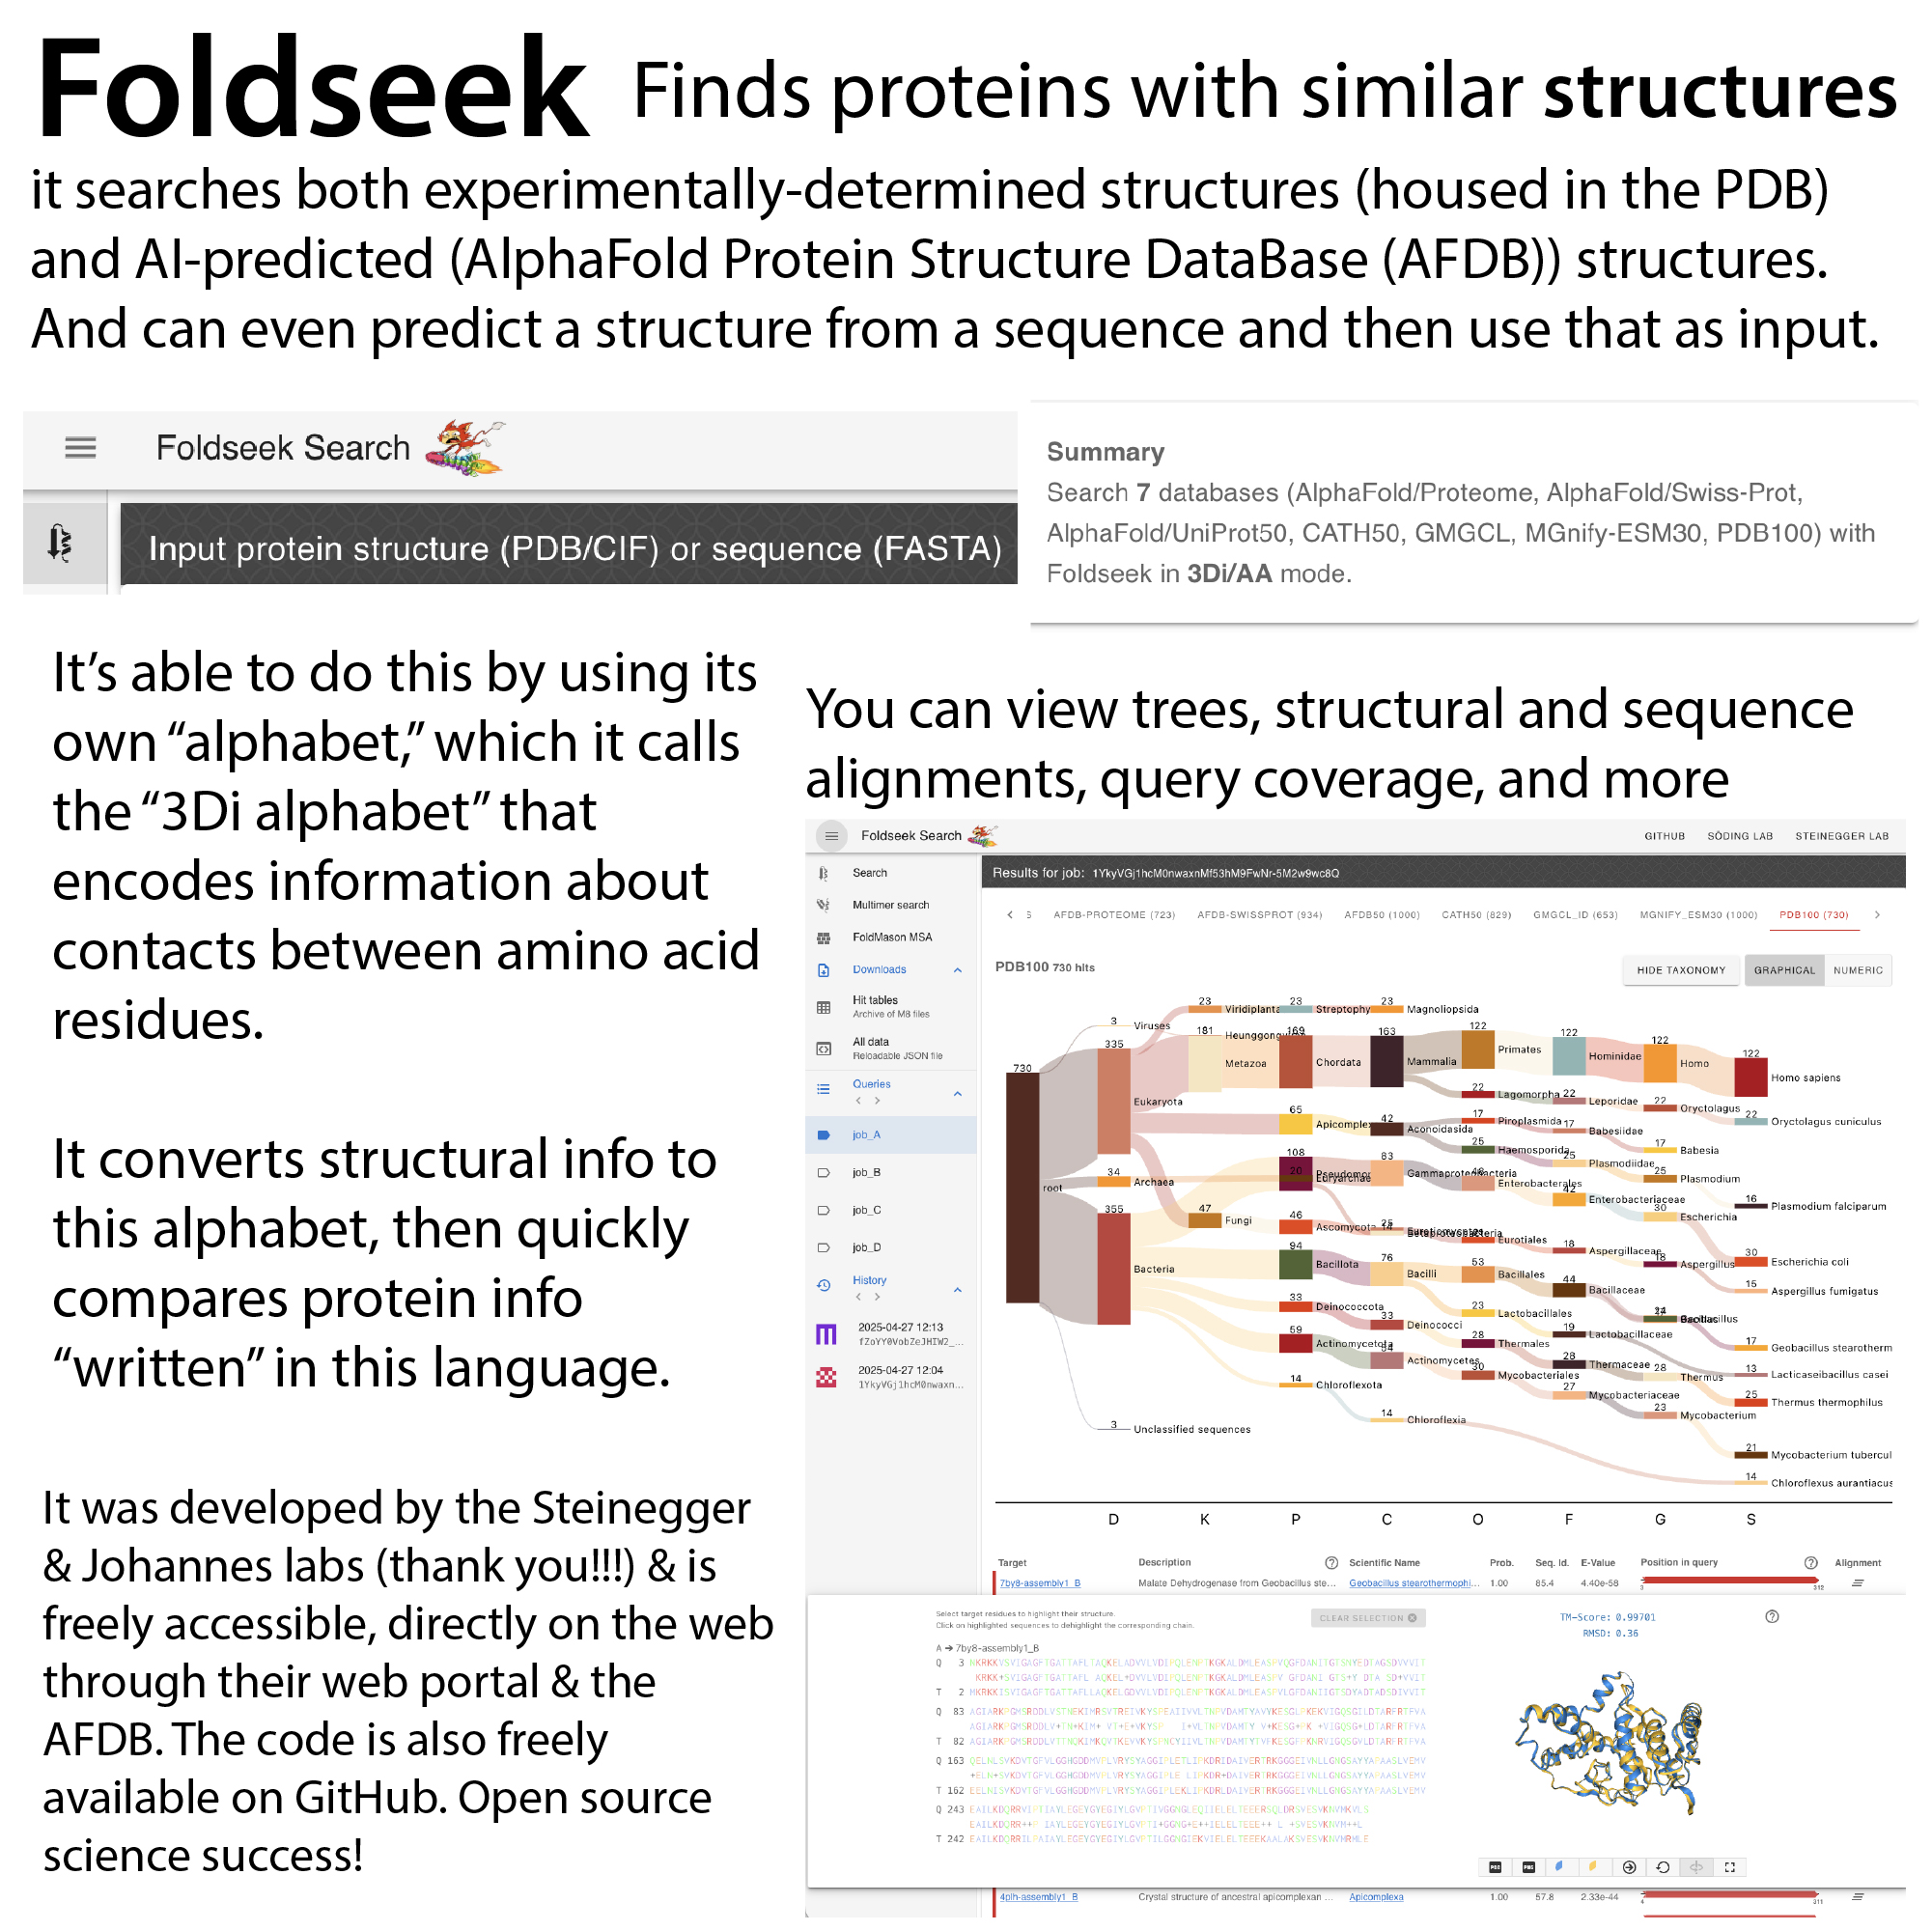
Foldseek is really cool. It compares structures against one another to find similar ones. What’s even cooler is that it searches both experimentally-determined structures (housed in the PDB) and AI-predicted (AlphaFold Protein Structure DataBase (AFDB)) structures. And can even predict a structure from a sequence and then use that as input. It’s also integrated into the AlphaFold database so you can get results there too.
It’s able to do this by using its own “alphabet,” which it calls the “3Di alphabet” that encodes information about contacts between amino acid residues.
It converts structural info to this alphabet, then quickly compares protein info “written” in this language.
It was developed by the Steinegger lab at Seoul National University in collaboration with the Johannes lab at the Max Planck Institute for Multidisciplinary Sciences. A great description of it was written up by the EBI: “AlphaFold database empowers researchers with enhanced structural search via Foldseek integration” https://www.ebi.ac.uk/about/news/updates-from-data-resources/alphafold-foldseek/
And the official citation is here: Kempen, M. v., Kim, S., Tumescheit, C., Mirdita, M., Lee, J., Gilchrist, C. L. M., … & Steinegger, M. (2023). Fast and accurate protein structure search with foldseek. Nature Biotechnology, 42(2), 243-246. https://doi.org/10.1038/s41587-023-01773-0
You can access the web version of it here: https://search.foldseek.com/search
Or the open-access code to run it in command line is here: https://github.com/steineggerlab/foldseek
It’s also integrated into the AlphaFold database so you can get results there too. And here’s the AFDB: https://alphafold.ebi.ac.uk/
For more information…
For more practical protein-purification posts (and background/theory), check out the new page on my blog where I’ve collected some of my protein purification posts. http://bit.ly/proteinpurificationtech
- more about the PDB: https://bit.ly/pdbstructures
- more about using the extinction coefficient to find protein concentration based on UV absorbance: http://bit.ly/proteinmeasuring
- more about pI, protein charge, and ion exchange chromatography: http://bit.ly/ionexchangechromatography
- more about proteins & how they get their structure: https://bit.ly/proteinstructure
- more about PyMol: https://bit.ly/pymolintro & https://bit.ly/pymolmovies
- more about Ago: https://bit.ly/agostructurestuff
- more about x-ray crystallography: http://bit.ly/xraycrystallography2
- more about cryoEM: https://bit.ly/cryoEMbumblyintro
- more about Ago: https://bit.ly/agostructurestuff
- more about all sorts of things: #365DaysOfScience All (with topics listed) 👉 http://bit.ly/2OllAB0 or search blog: https://thebumblingbiochemist.com