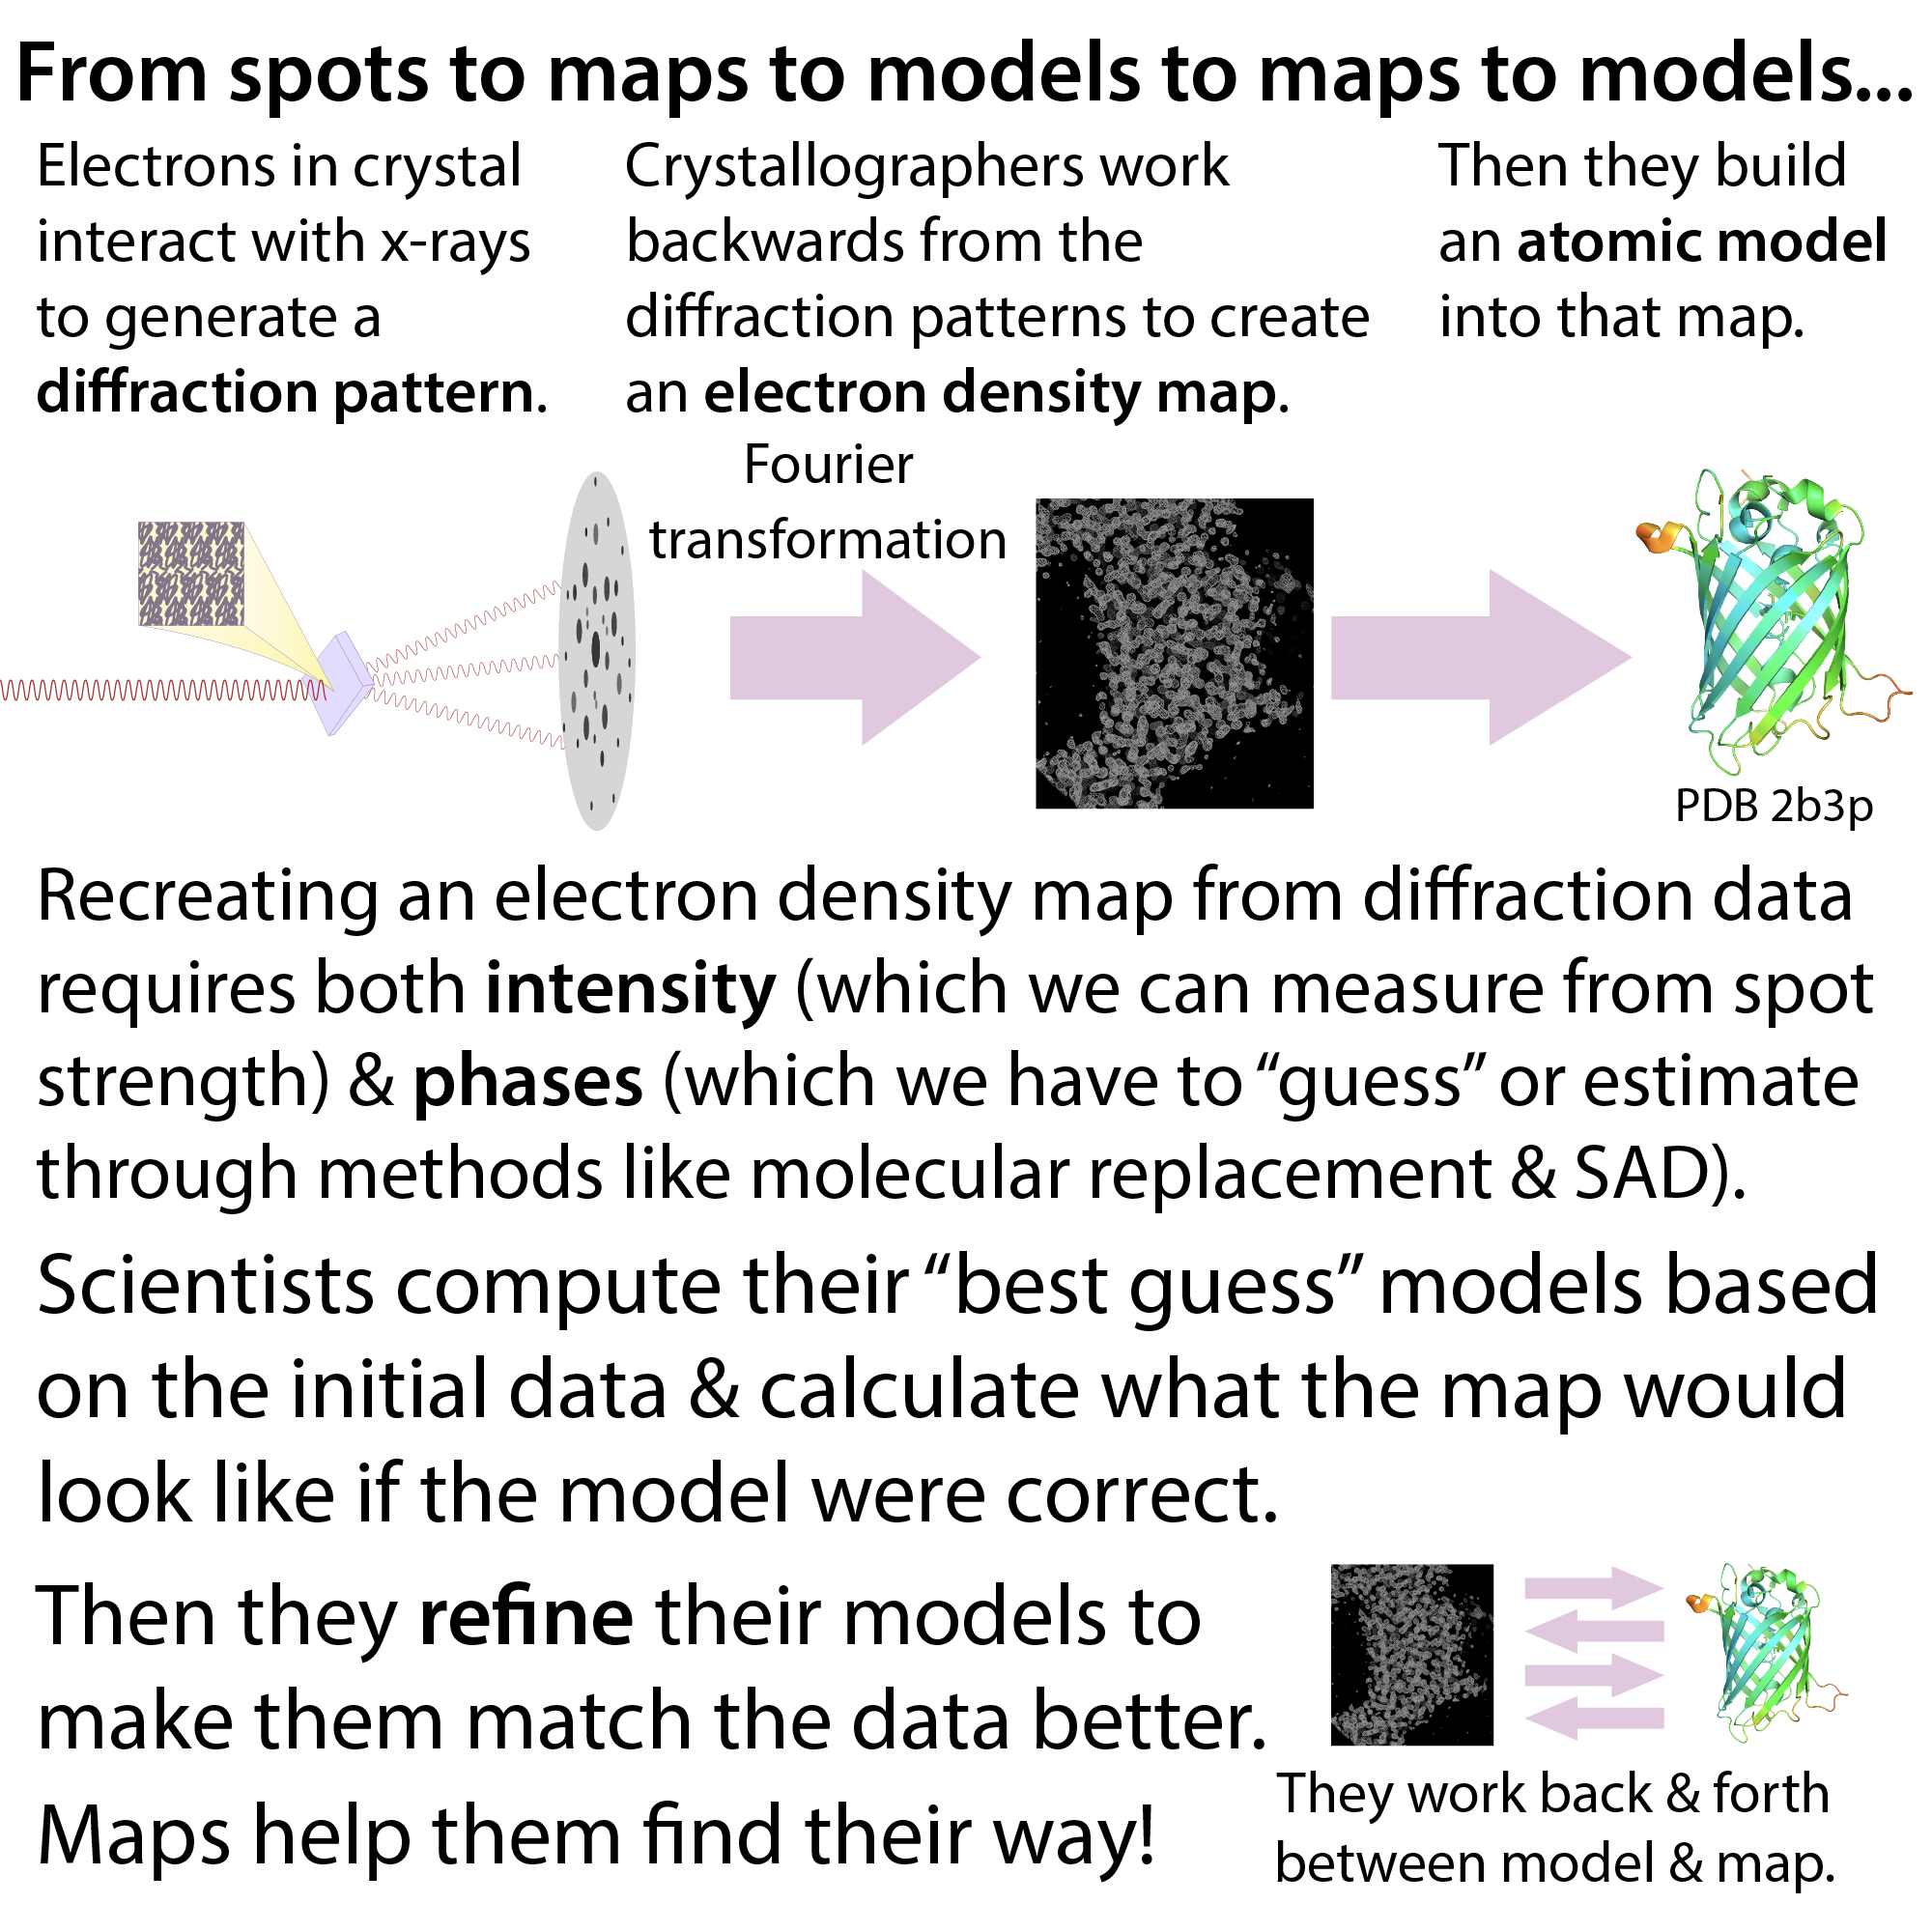
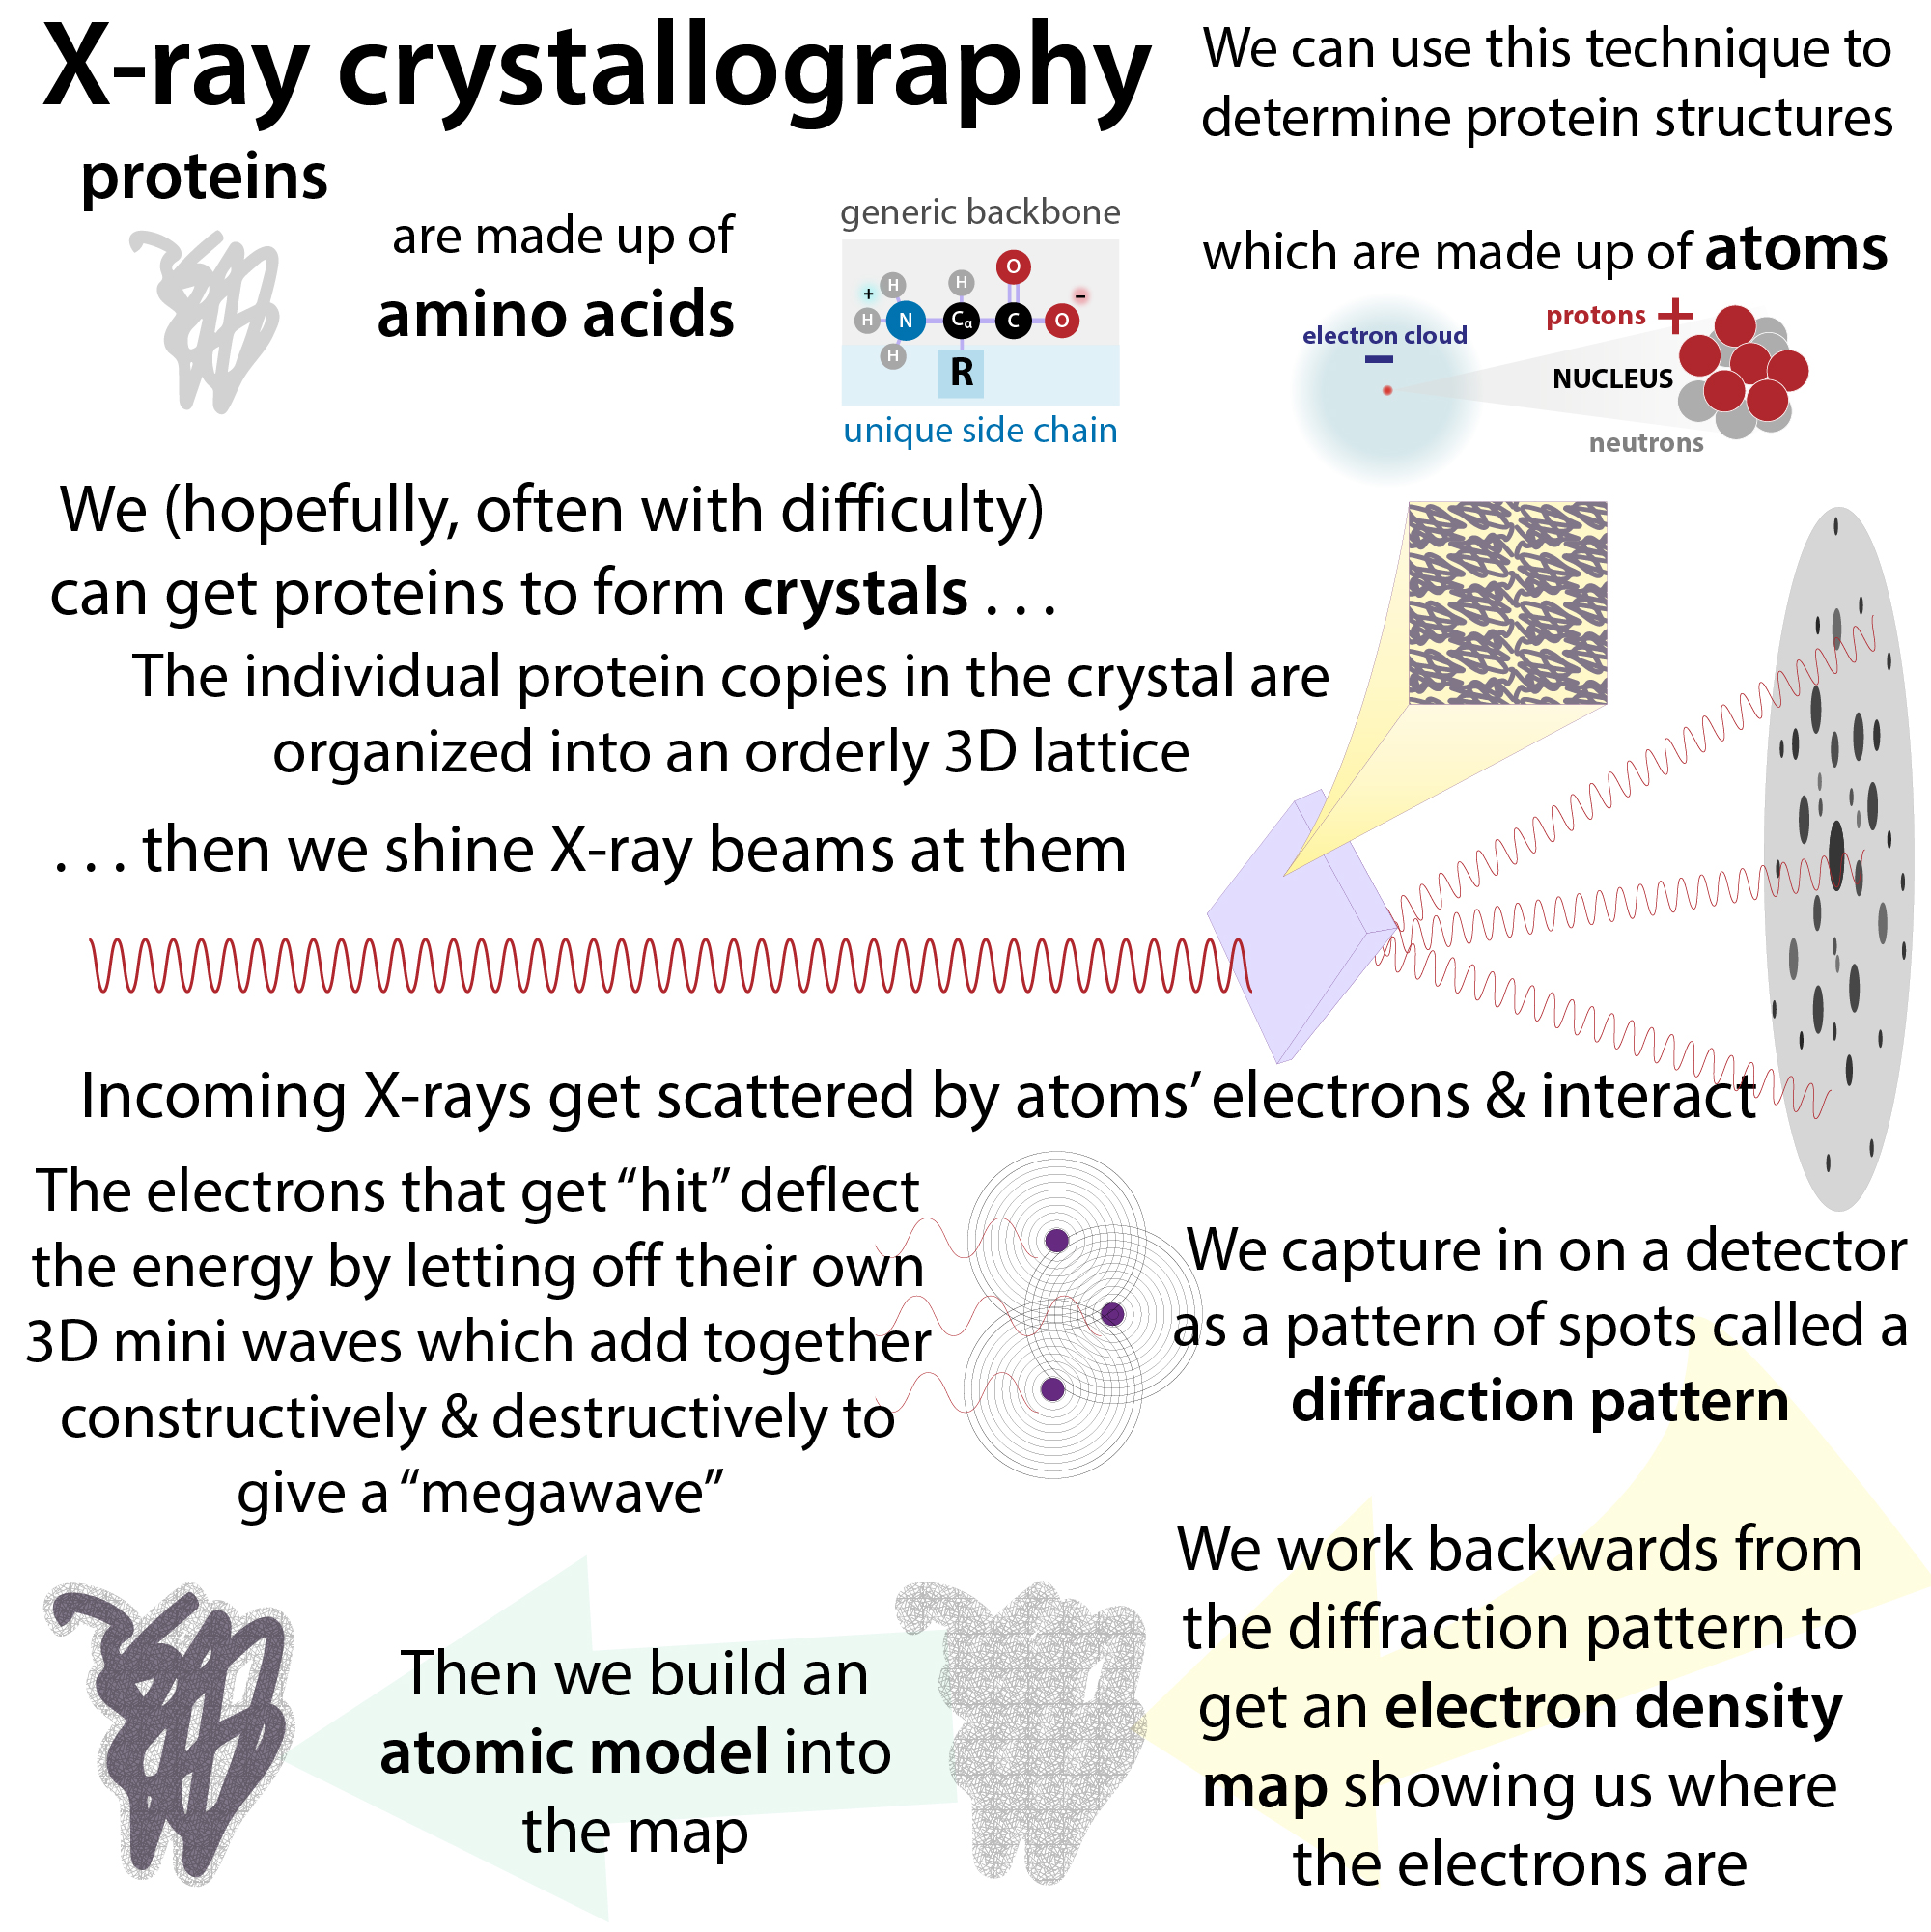
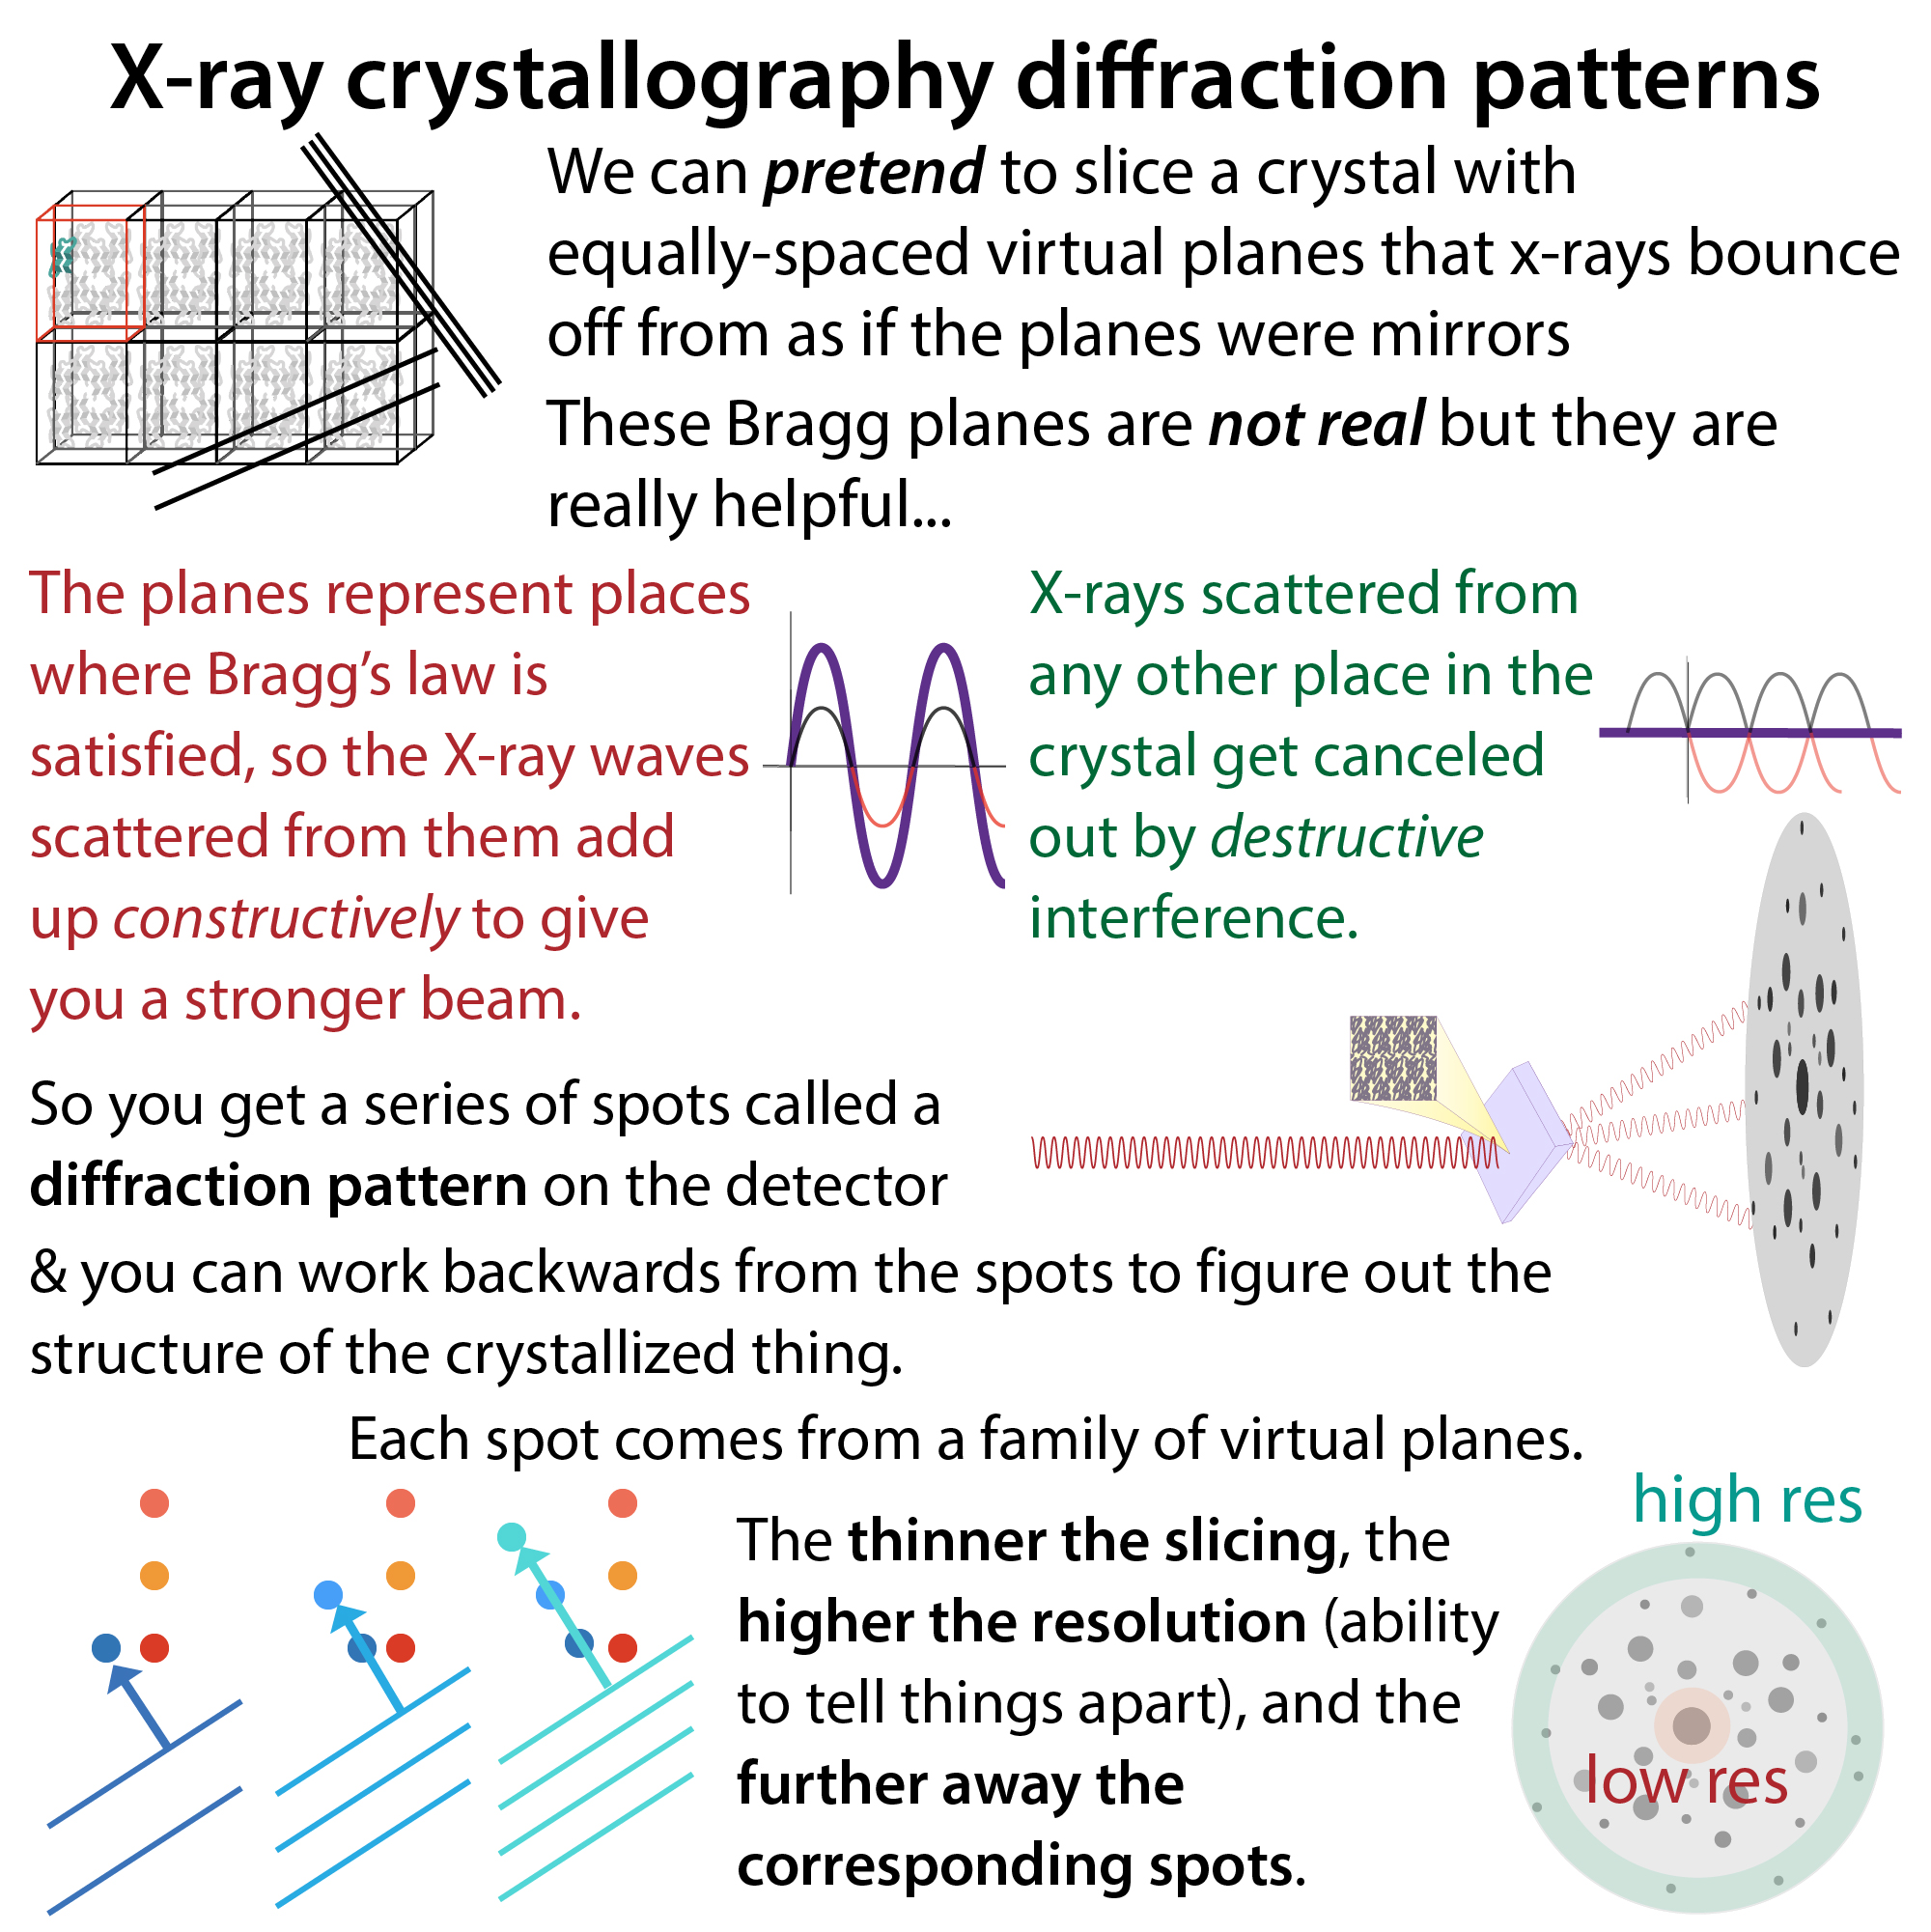
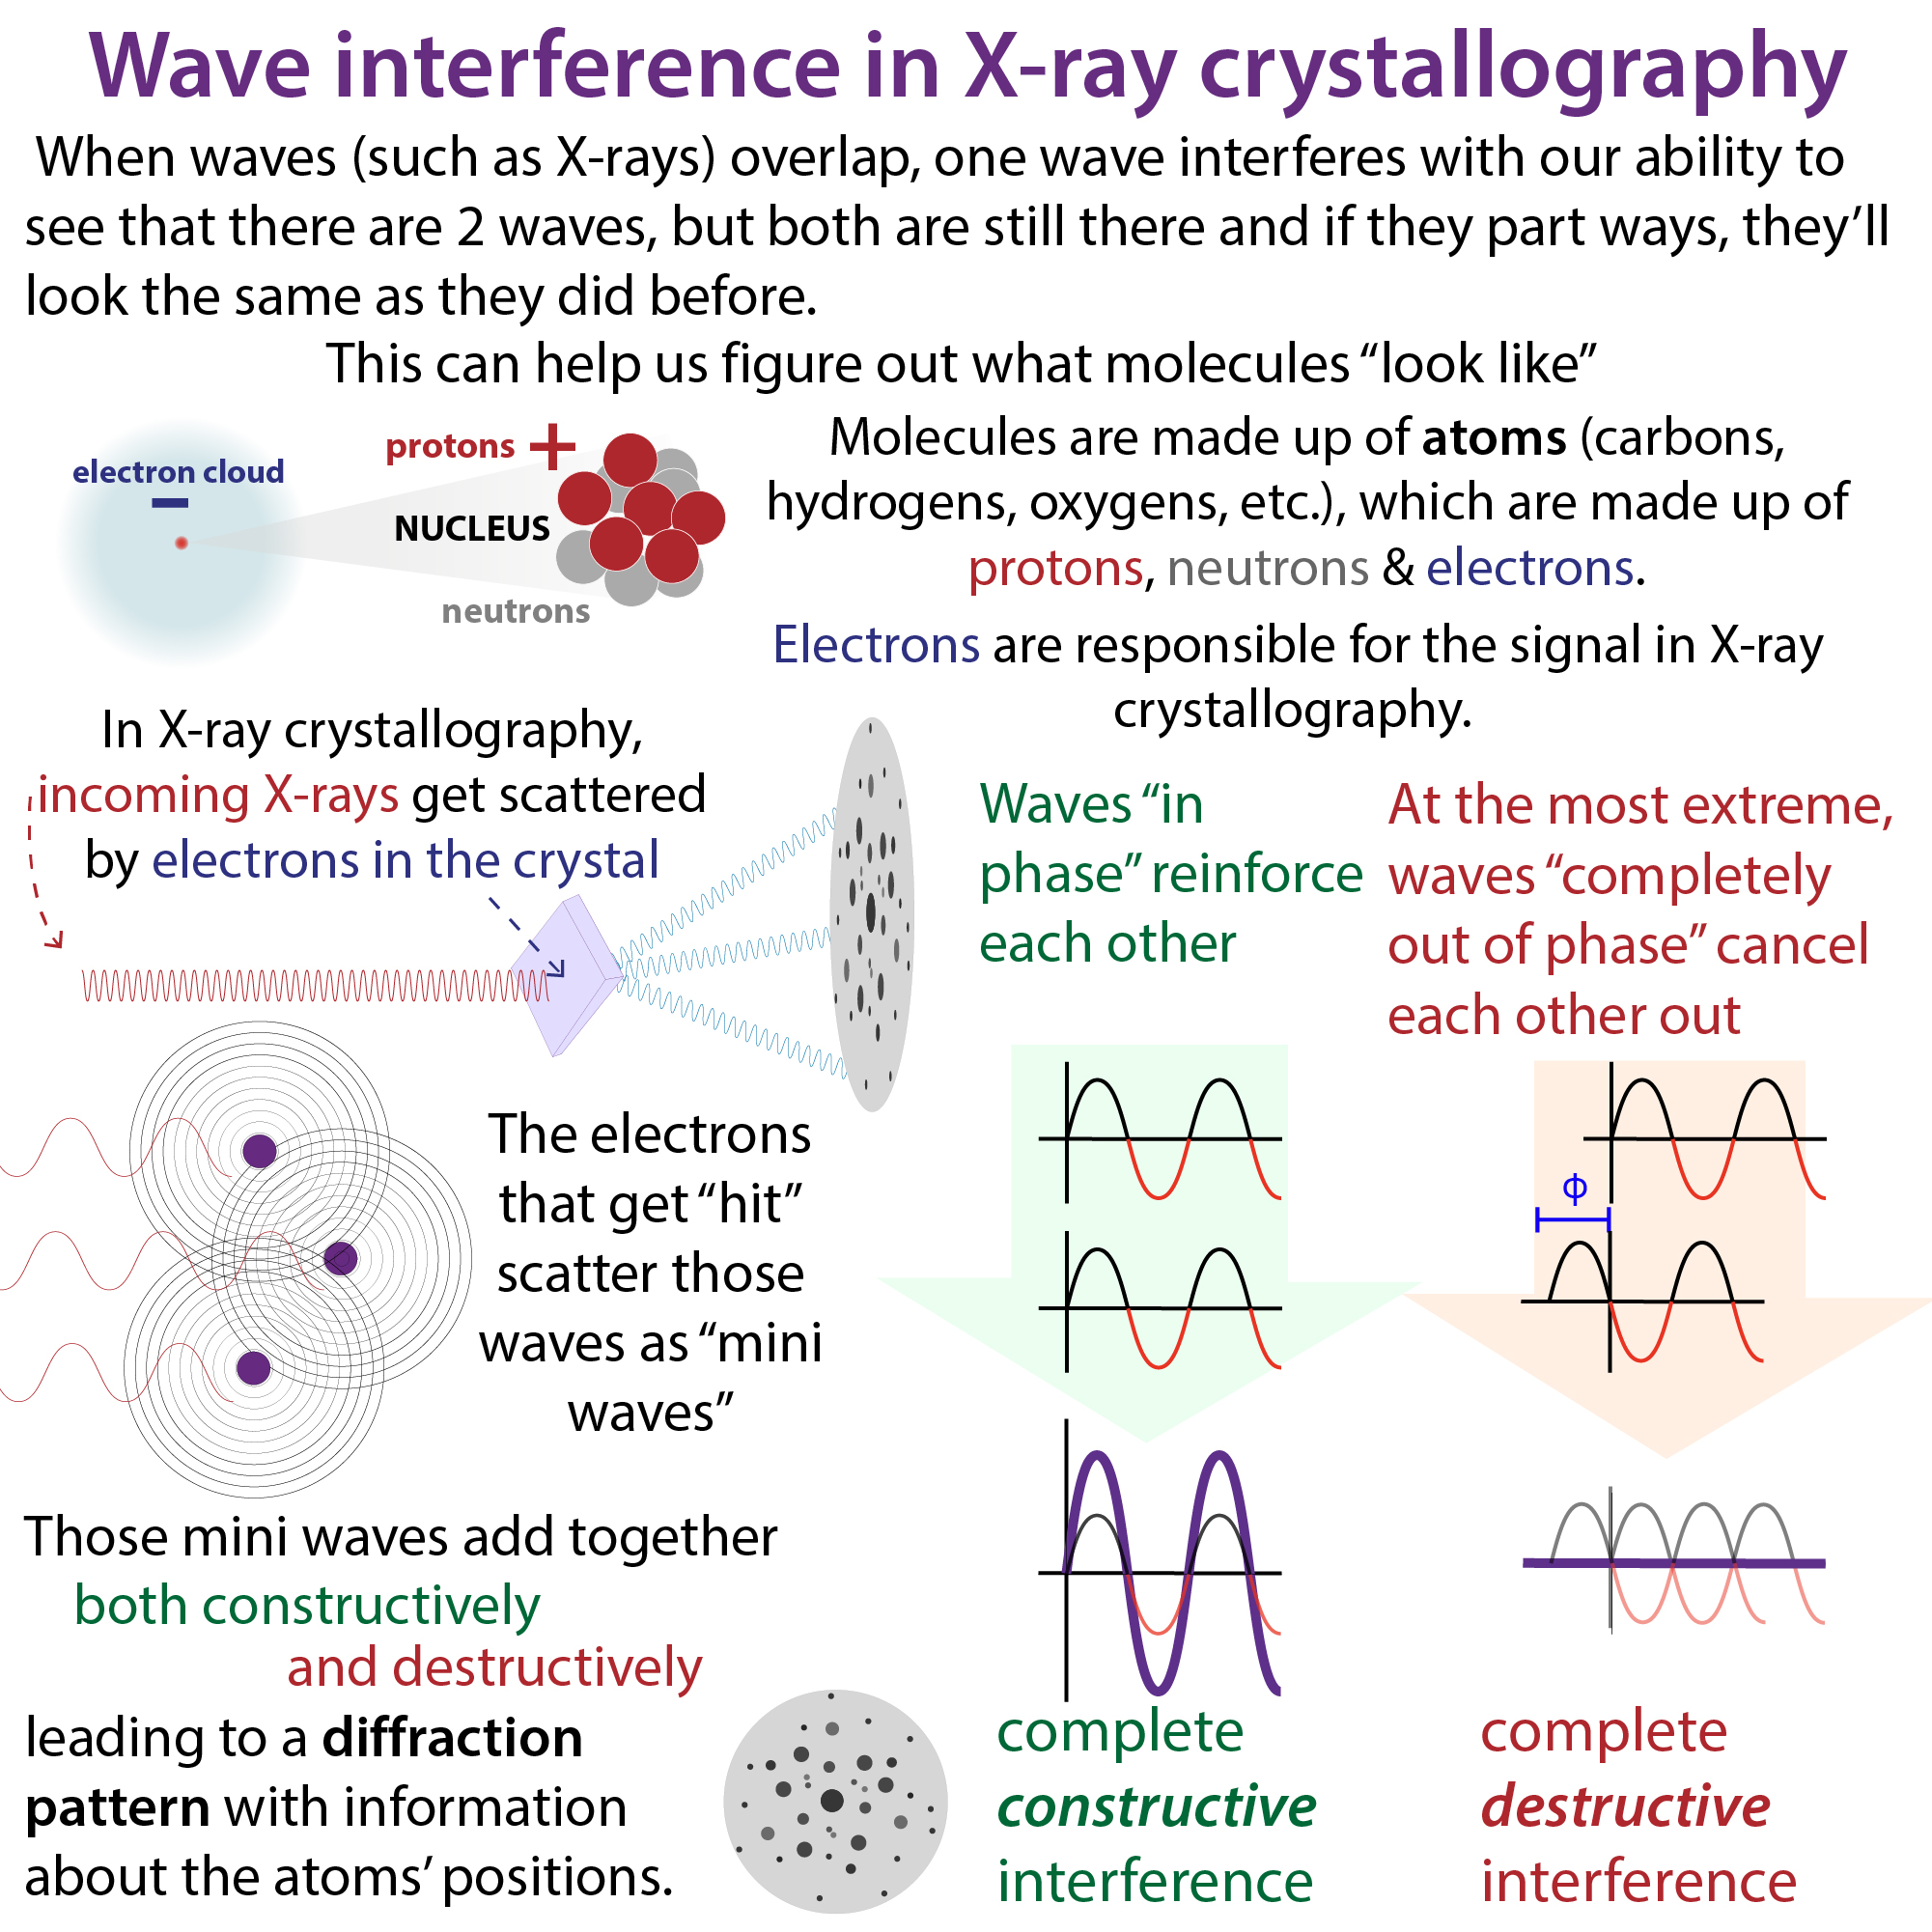
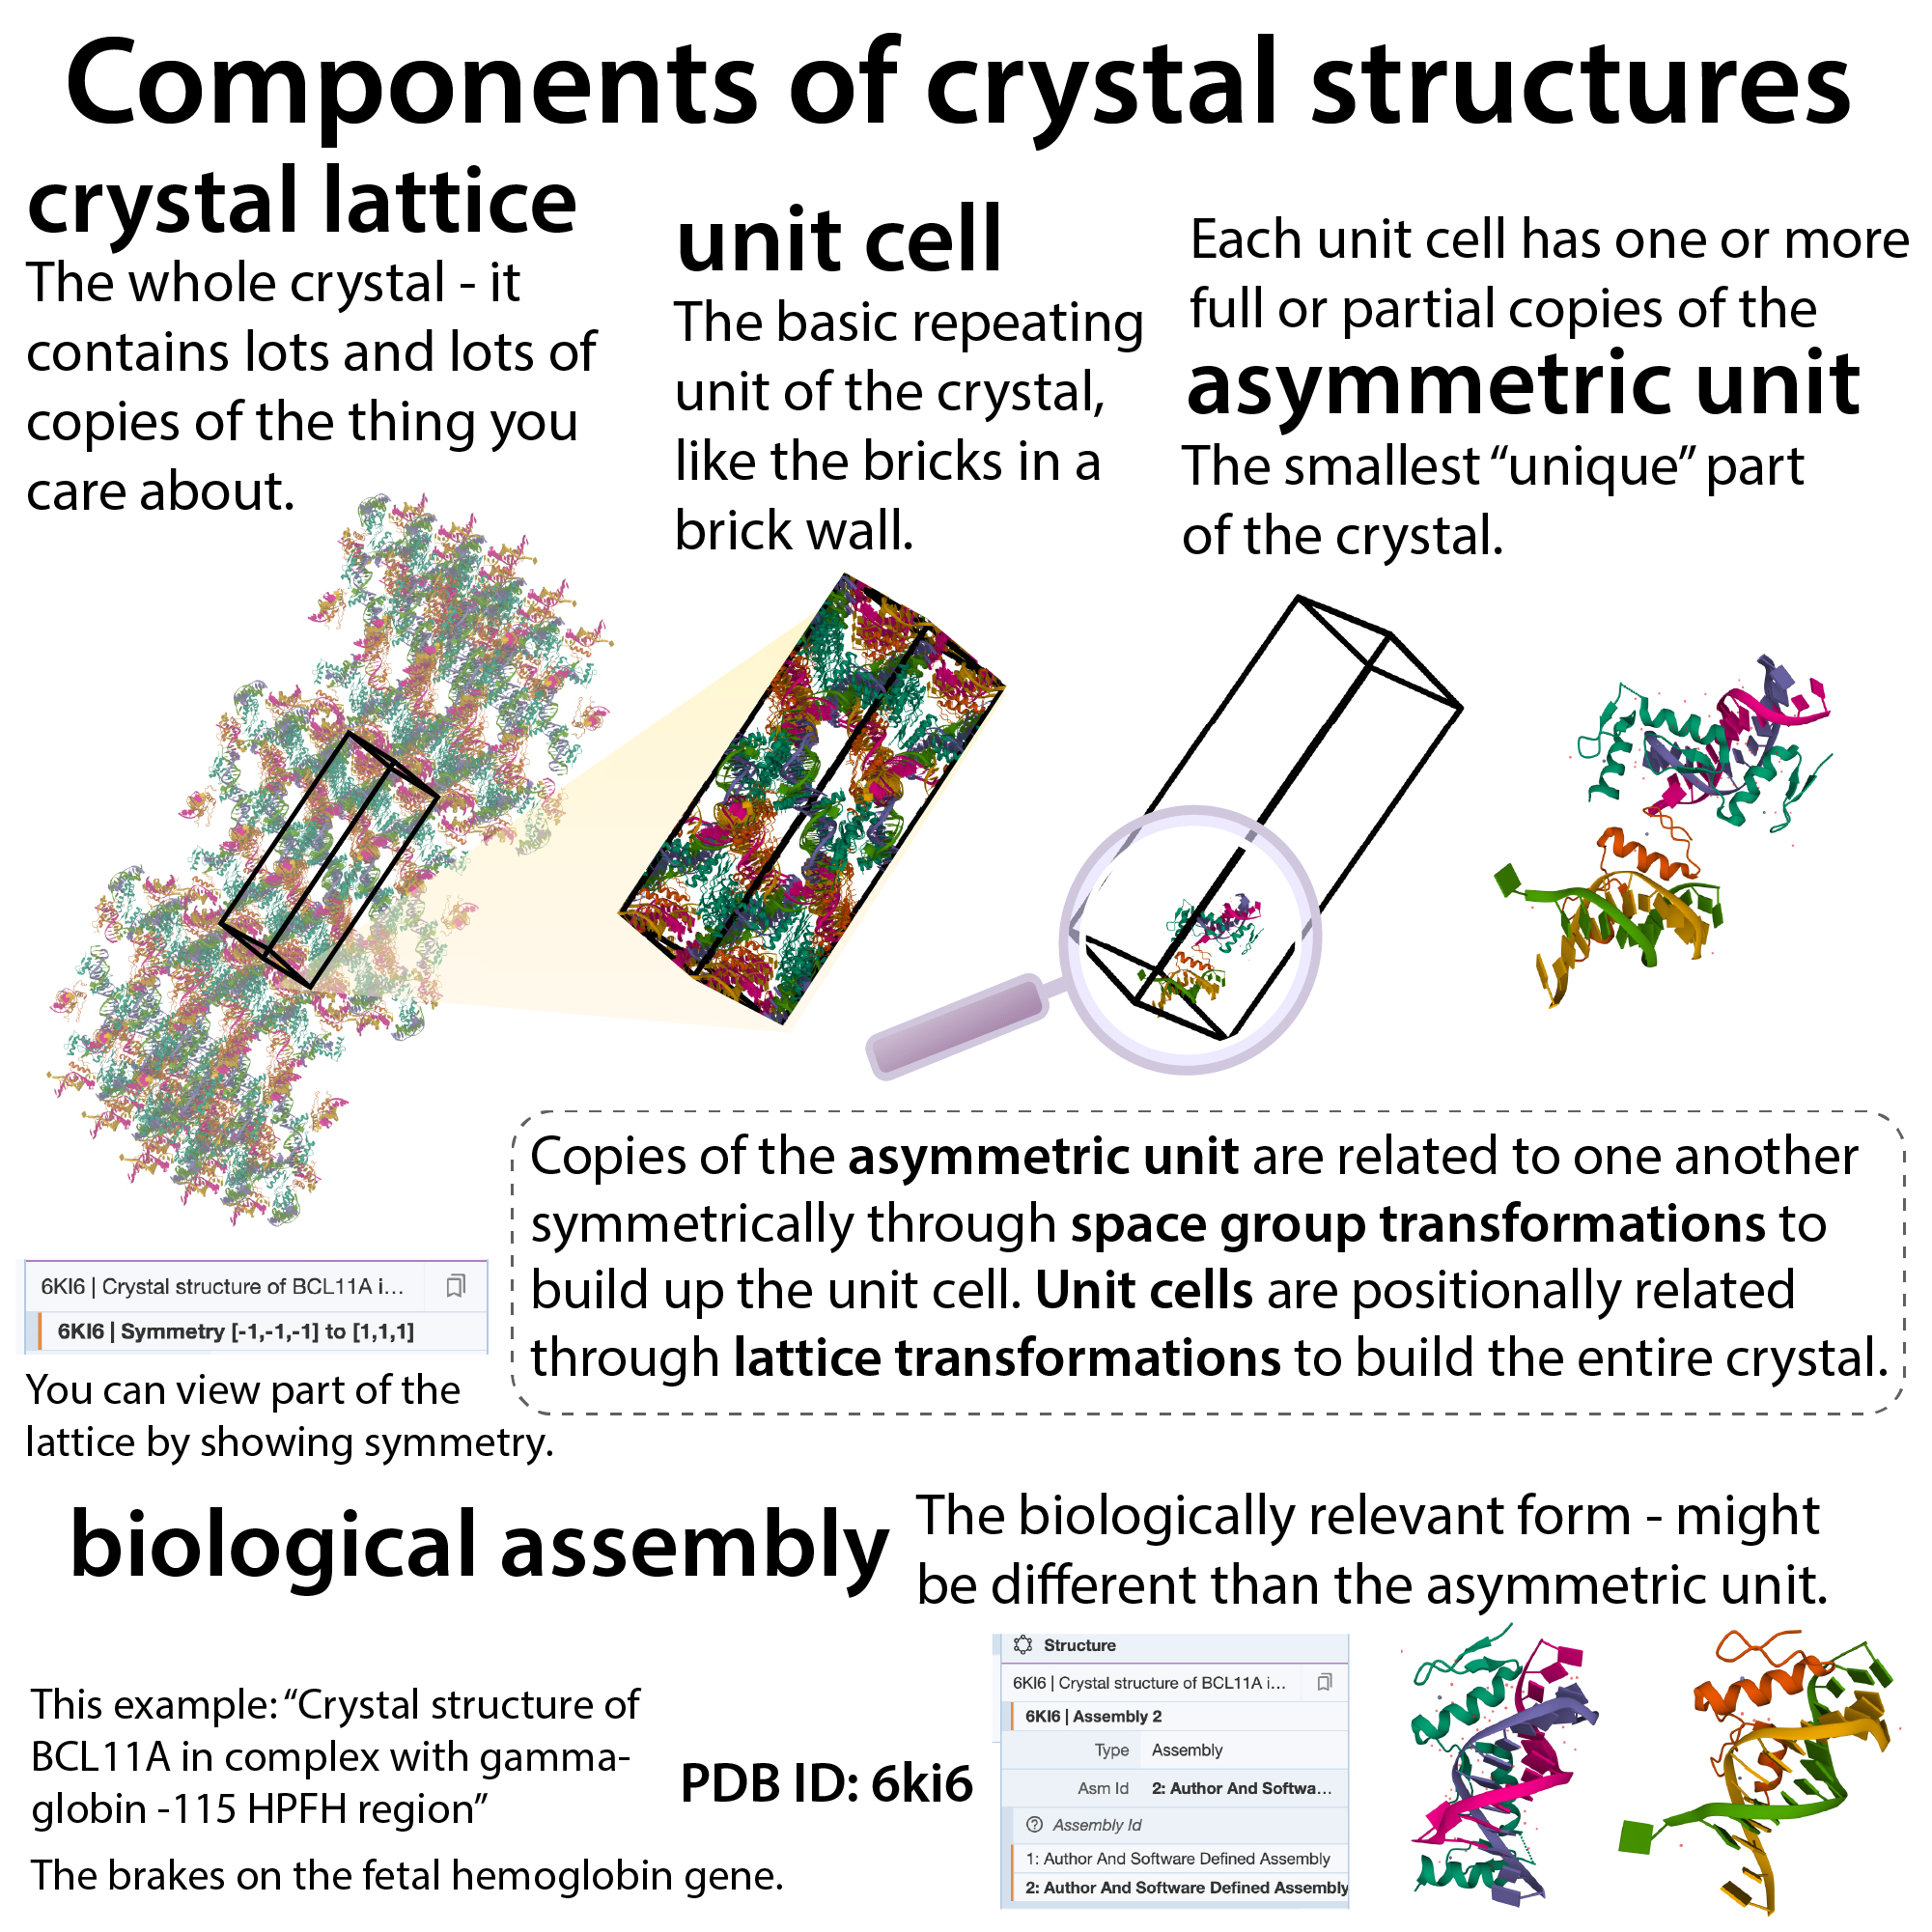
In X-ray crystallography, electrons in a crystal interact with x-rays to generate a diffraction pattern. Then crystallographers work backwards from the diffraction patterns to create an electron density map. Then they build an atomic model into that map.
Sounds straight forward right? Wrong! There’s a big problem. Recreating an electron density map from diffraction data basically involves reconstructing a complicated wave through a math-y thing called a Fourier transformation. And a wave equation describing that wave requires both intensity (which we can measure from spot strength) & phases. We only can detect the intensity. Leaving us with a big “phase problem.” So in order to actually create a typical map – even a pretty bad one – we have to “guess” the phases through various methods like molecular replacement (which is just computational, basing it on similarity to a known structure) or experimental determination with techniques like SAD and MAD or heavy metal soaking that give us only rough starting points.
Scientists then compute their “best guess” models based on the initial data & calculate what the map would look like if the model were correct. Then they refine their models to make them match the data better, working back and forth between map and model.
And maps help them find their way!
There are a few kinds…
Note: this post is more technical. If you need a refresher on X-ray crystallography, start here: http://bit.ly/xraycrystallography2
This post also doesn’t have much text, but I will provide links to great resources
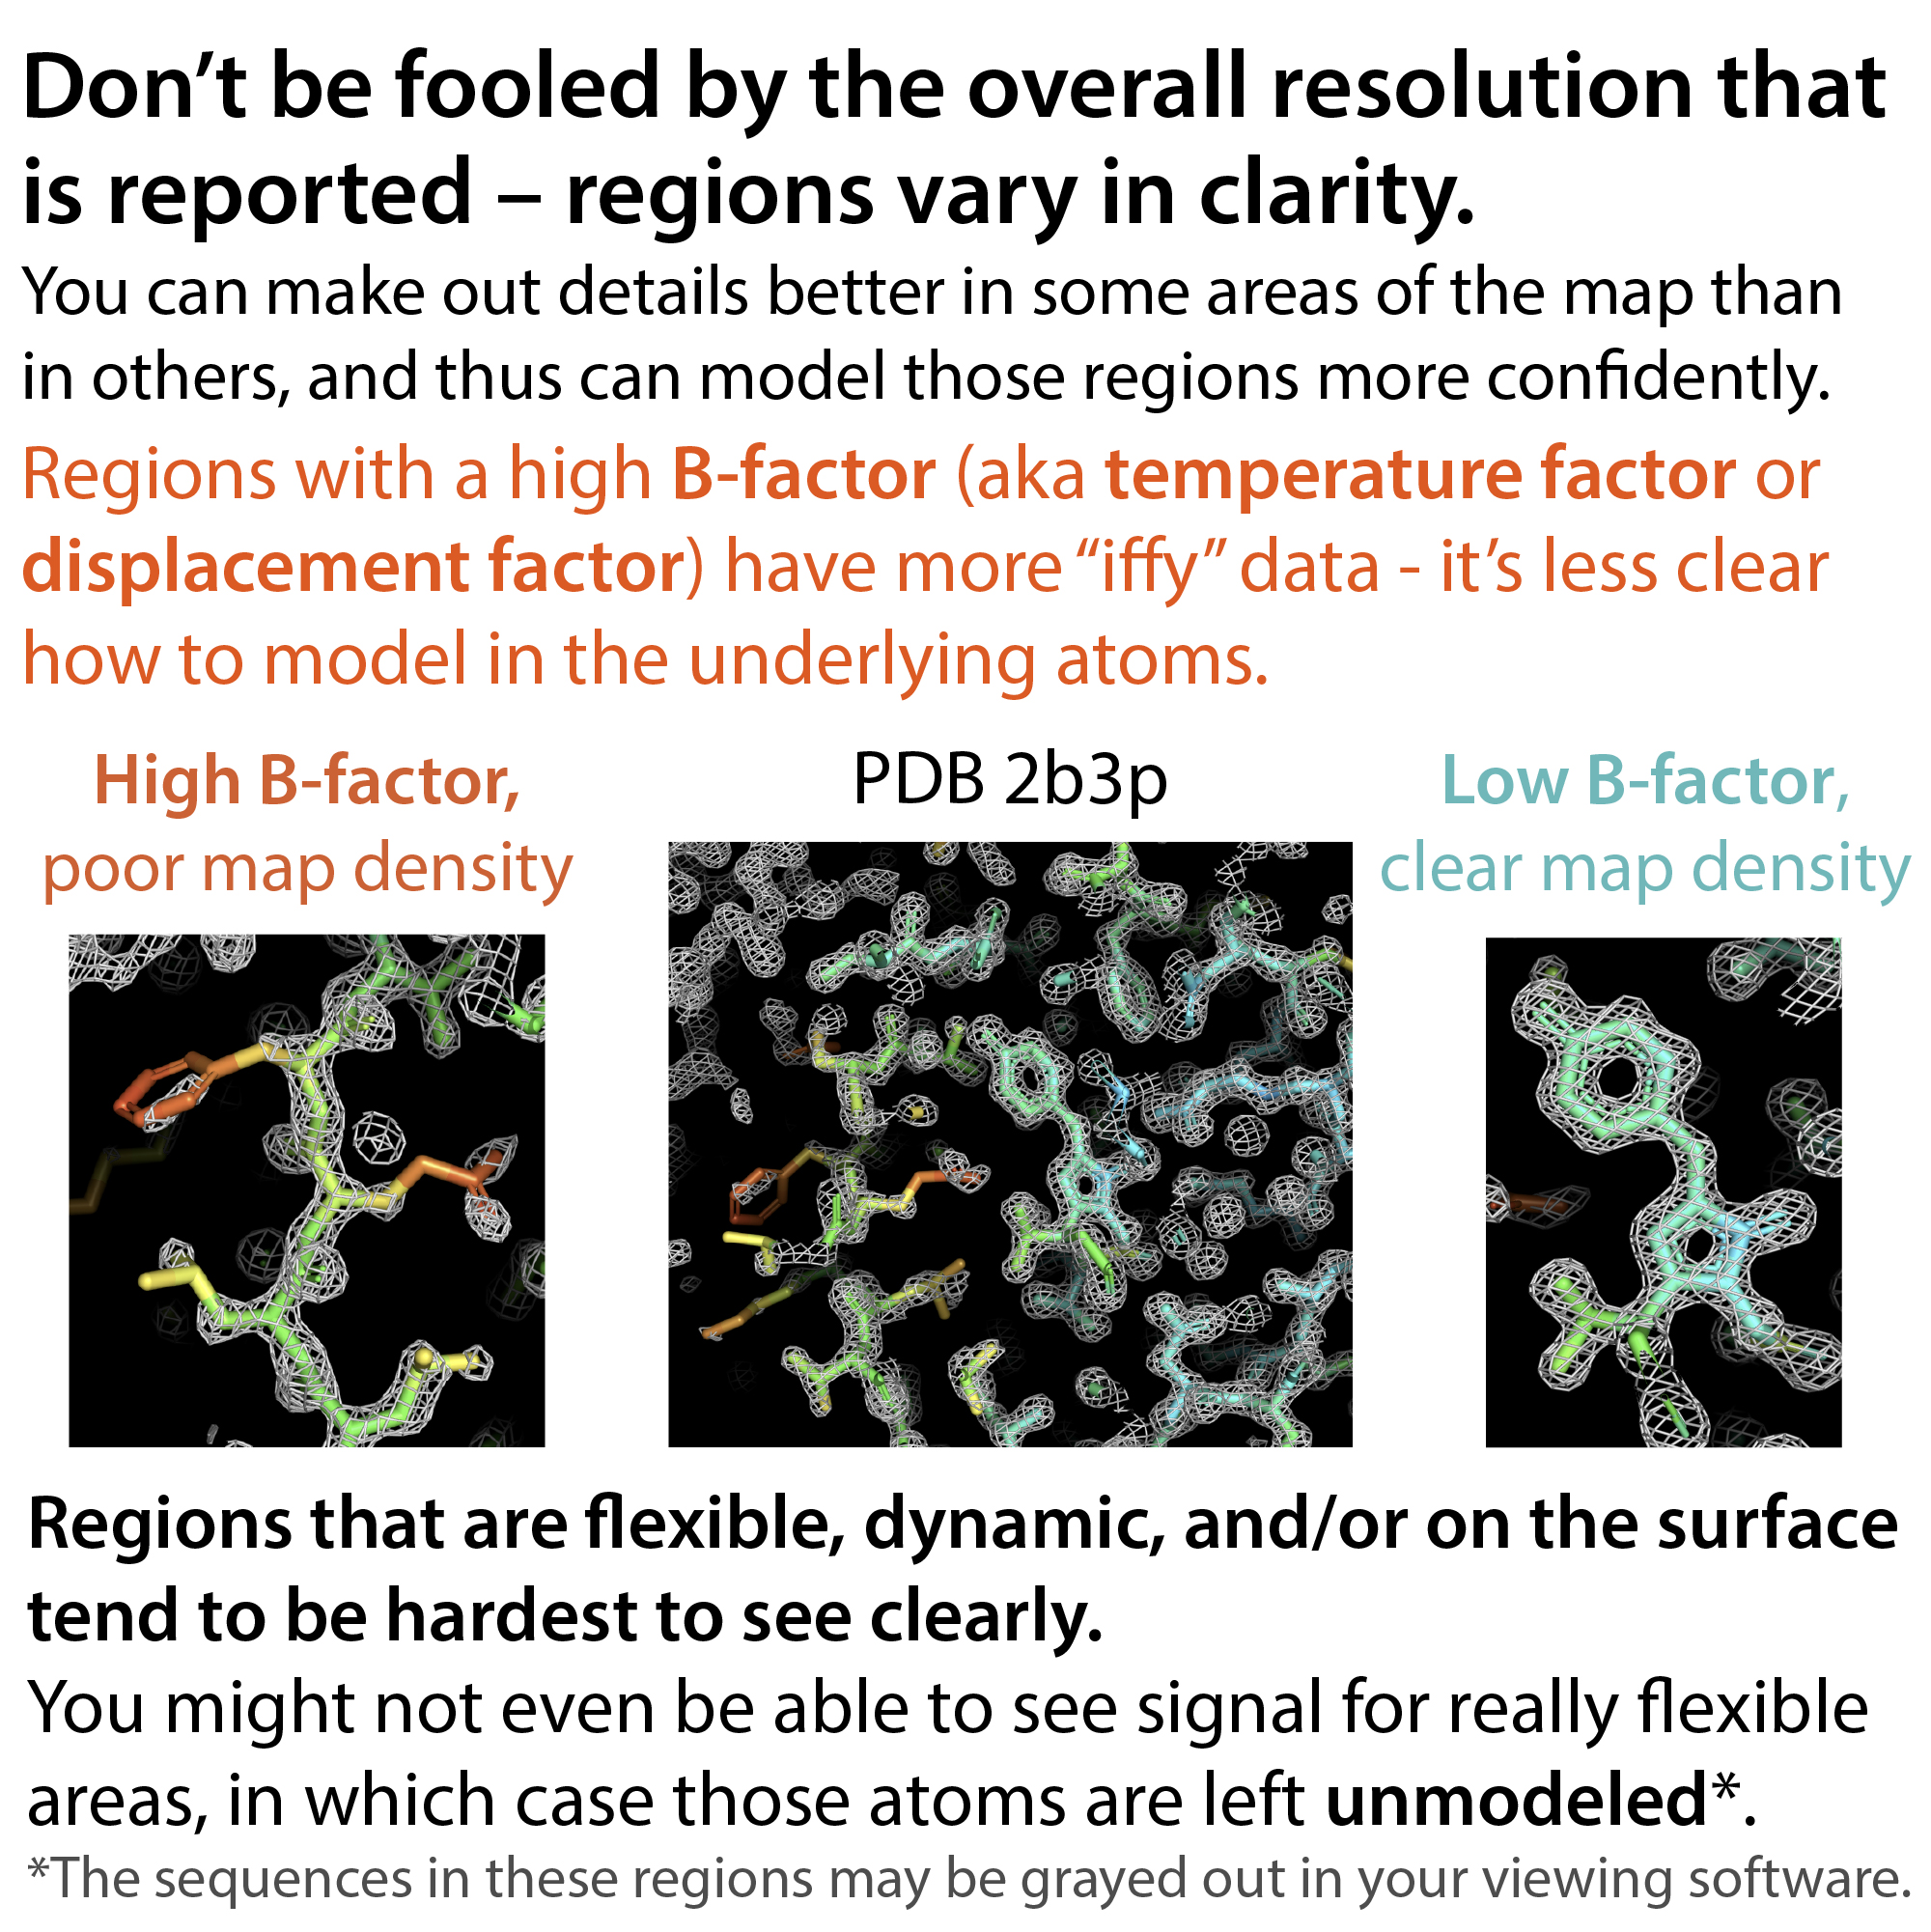
2Fo-Fc is a common way to view electron density. This map shows 2X observed signal (Fo) – modeled (calculated) signal (Fc) (so it weighs observed more highly) & you want to see continuous density. Density is typically clearest in the backbone and “stiff” areas of a protein and less clear (maybe even invisible) in side chains and flexible areas. These areas have a high “B factor” aka displacement factor.
You might see variations of this such as 2mFo-DFc which add some statistical weighting stuff to make more reliable, higher strength, data “count more.”
Fo-Fc shows you where things should or shouldn’t be! The Fo-Fc difference map highlights differences between the observed & the calculated-from-the-model signals. So, if they match completely, you’ll see nothing! but they won’t (at least not everywhere), so.… it’s typically displayed in red/green on top of the 2Fo-Fc map.
A negative (red) blob tells you you’ve modeled in something “extra” that’s not supported by the data. A positive (green) blob tells you the model is missing something – there’s still signal you need to account for
Note: there will have to be an equal amount of red and green in the map so lots of it will just be noise – the 2Fo-Fc can help you sort it out by tracing the continuous density
There are also “omit maps” where you calculate maps based on structures where you’ve left out (omitted) some part of the model (such as a bound ligand (binding partner)). This is often used to show that the density supporting the ligand in your other maps is real and not just the result of model bias. This is really important because scientists often have wishful thinking that something is bound so they model it on which then contributes to the normal map – but not the omit one. So there better be density still there!
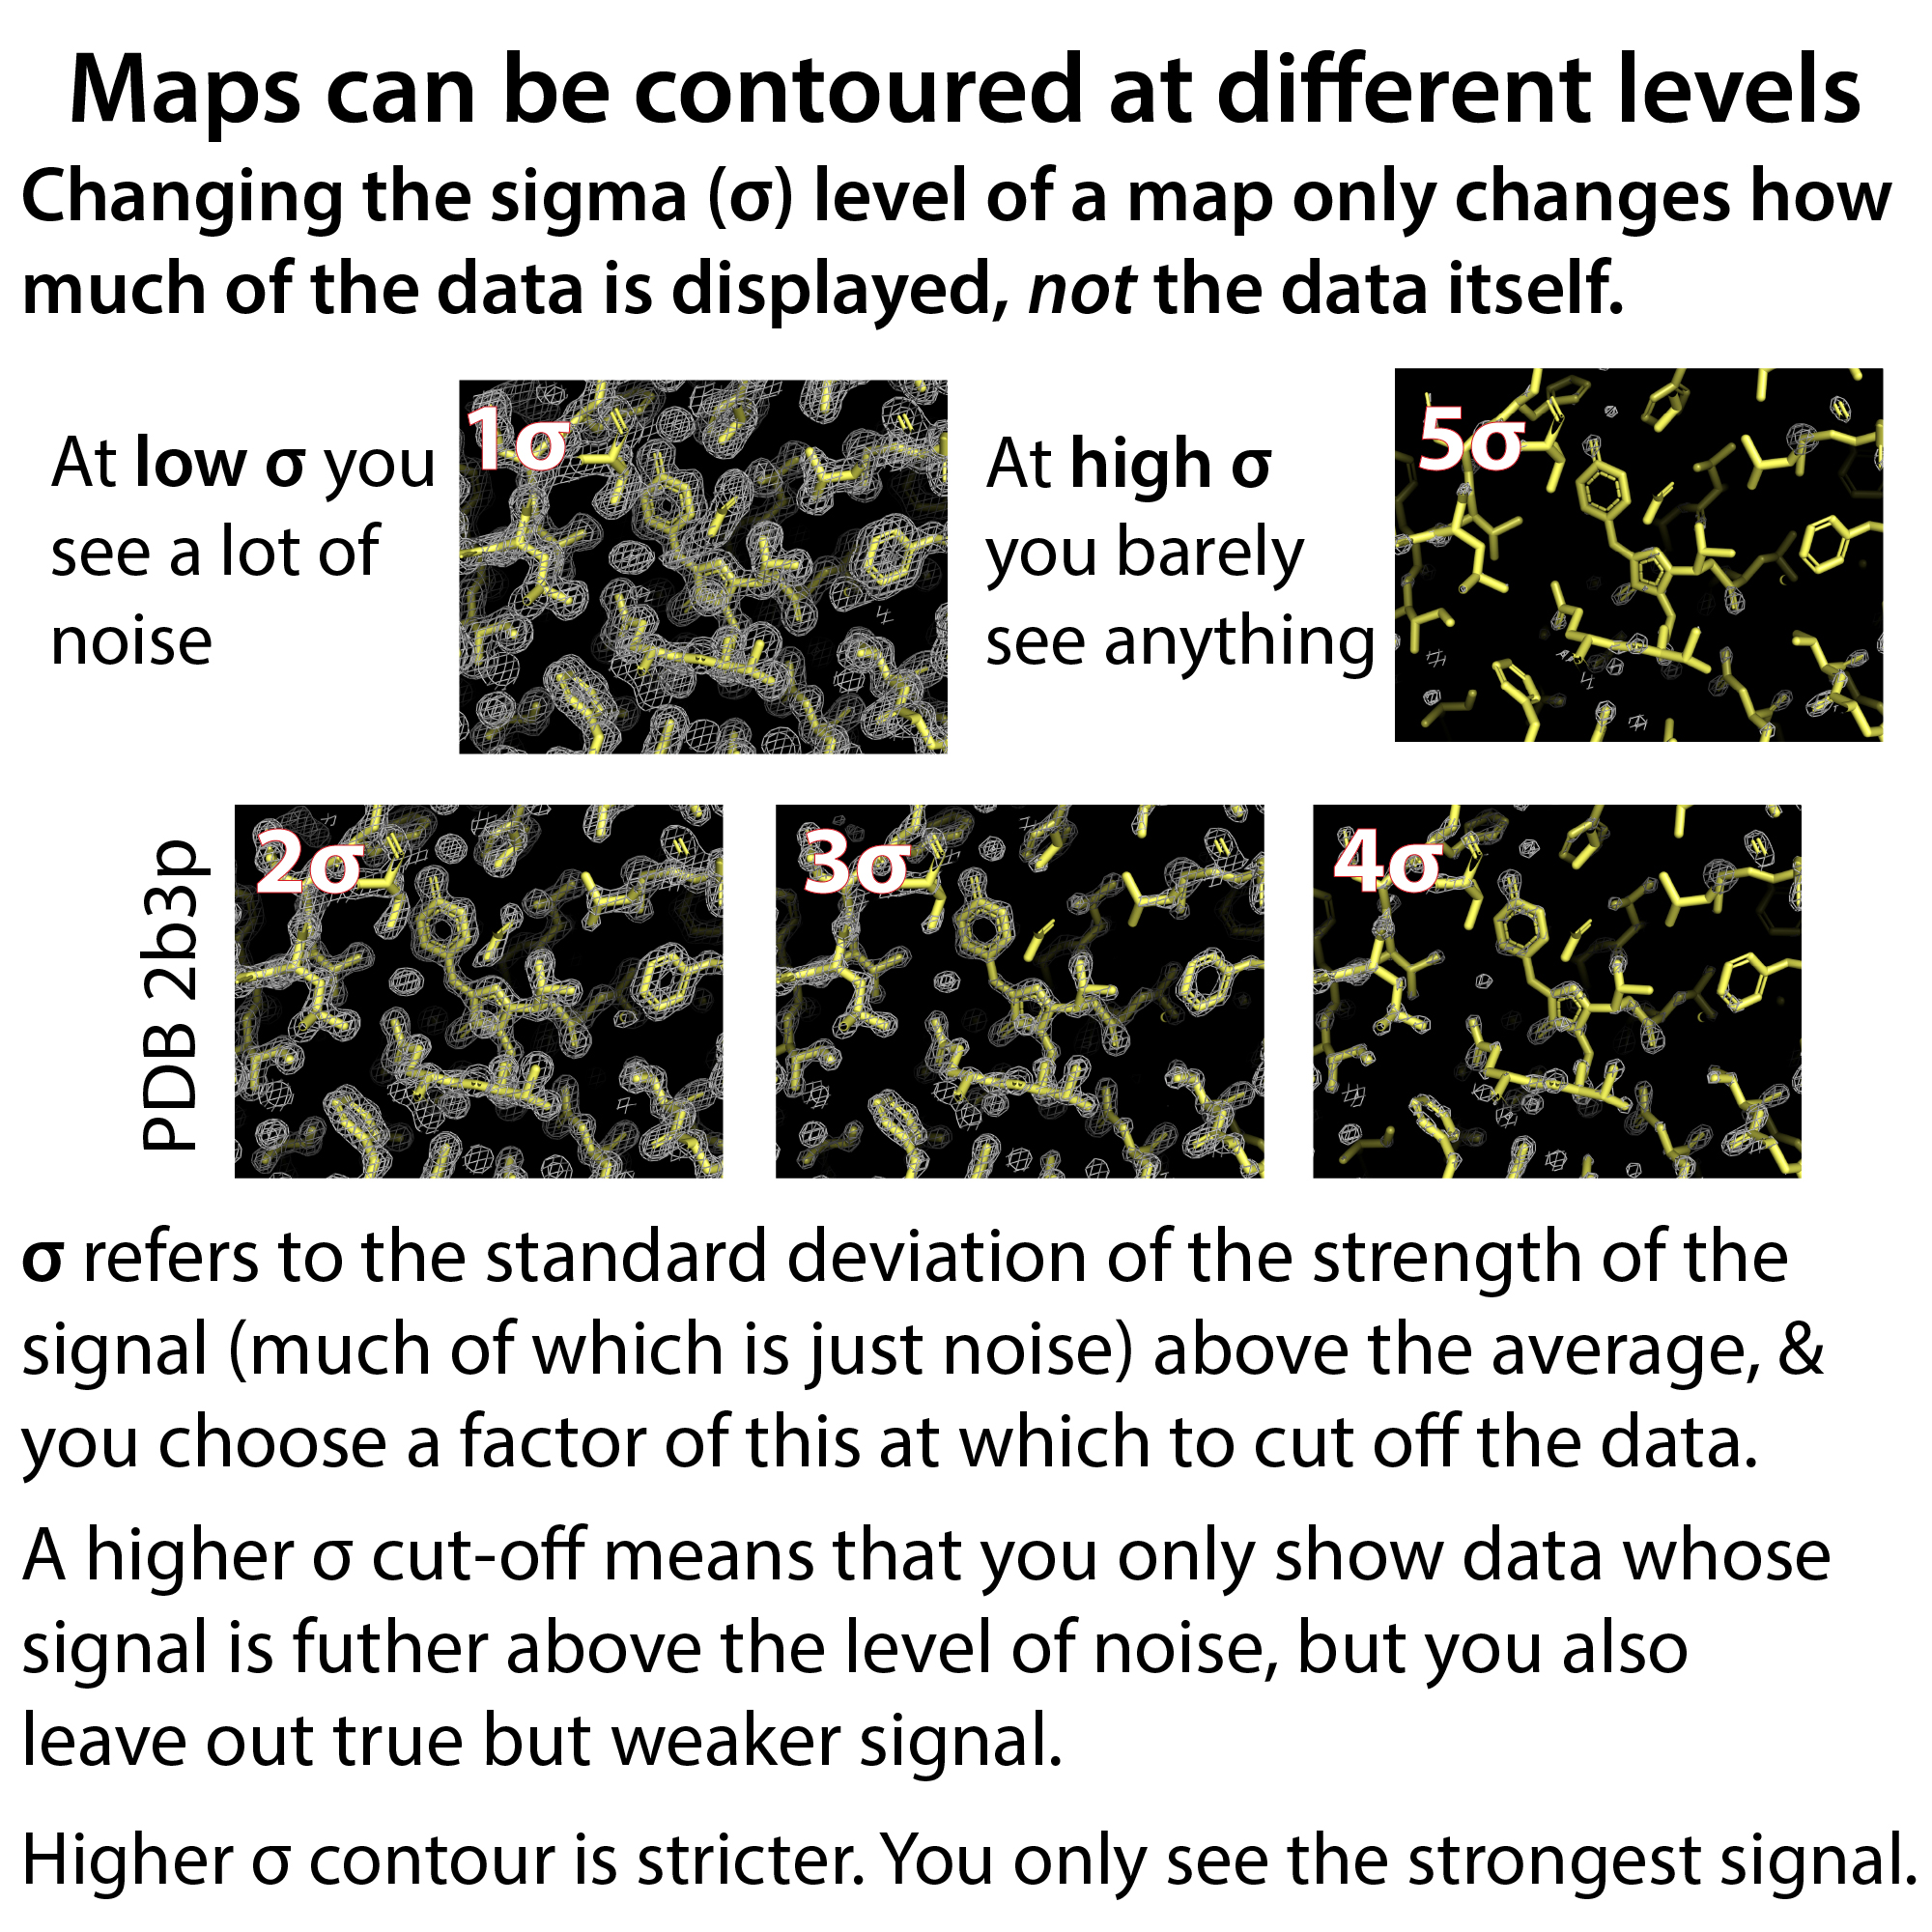
How much density you see on the screen depends in part on how you’ve set the contour level. Maps can be contoured at different levels and changing the sigma (o) level only changes how much of the data is displayed, not the data itself. o refers to the standard deviation of the strength of the signal (much of which is just noise) above the average, & you choose a factor of this at which to cut off the data. A higher o cut-off means that you only show data whose signal is futher above the level of noise, but you also leave out true but weaker signal. Higher o contour is stricter. You just see the strongest signal.
It’s important not to set your contour too low when building your model or you will end up building into a bunch of noise!
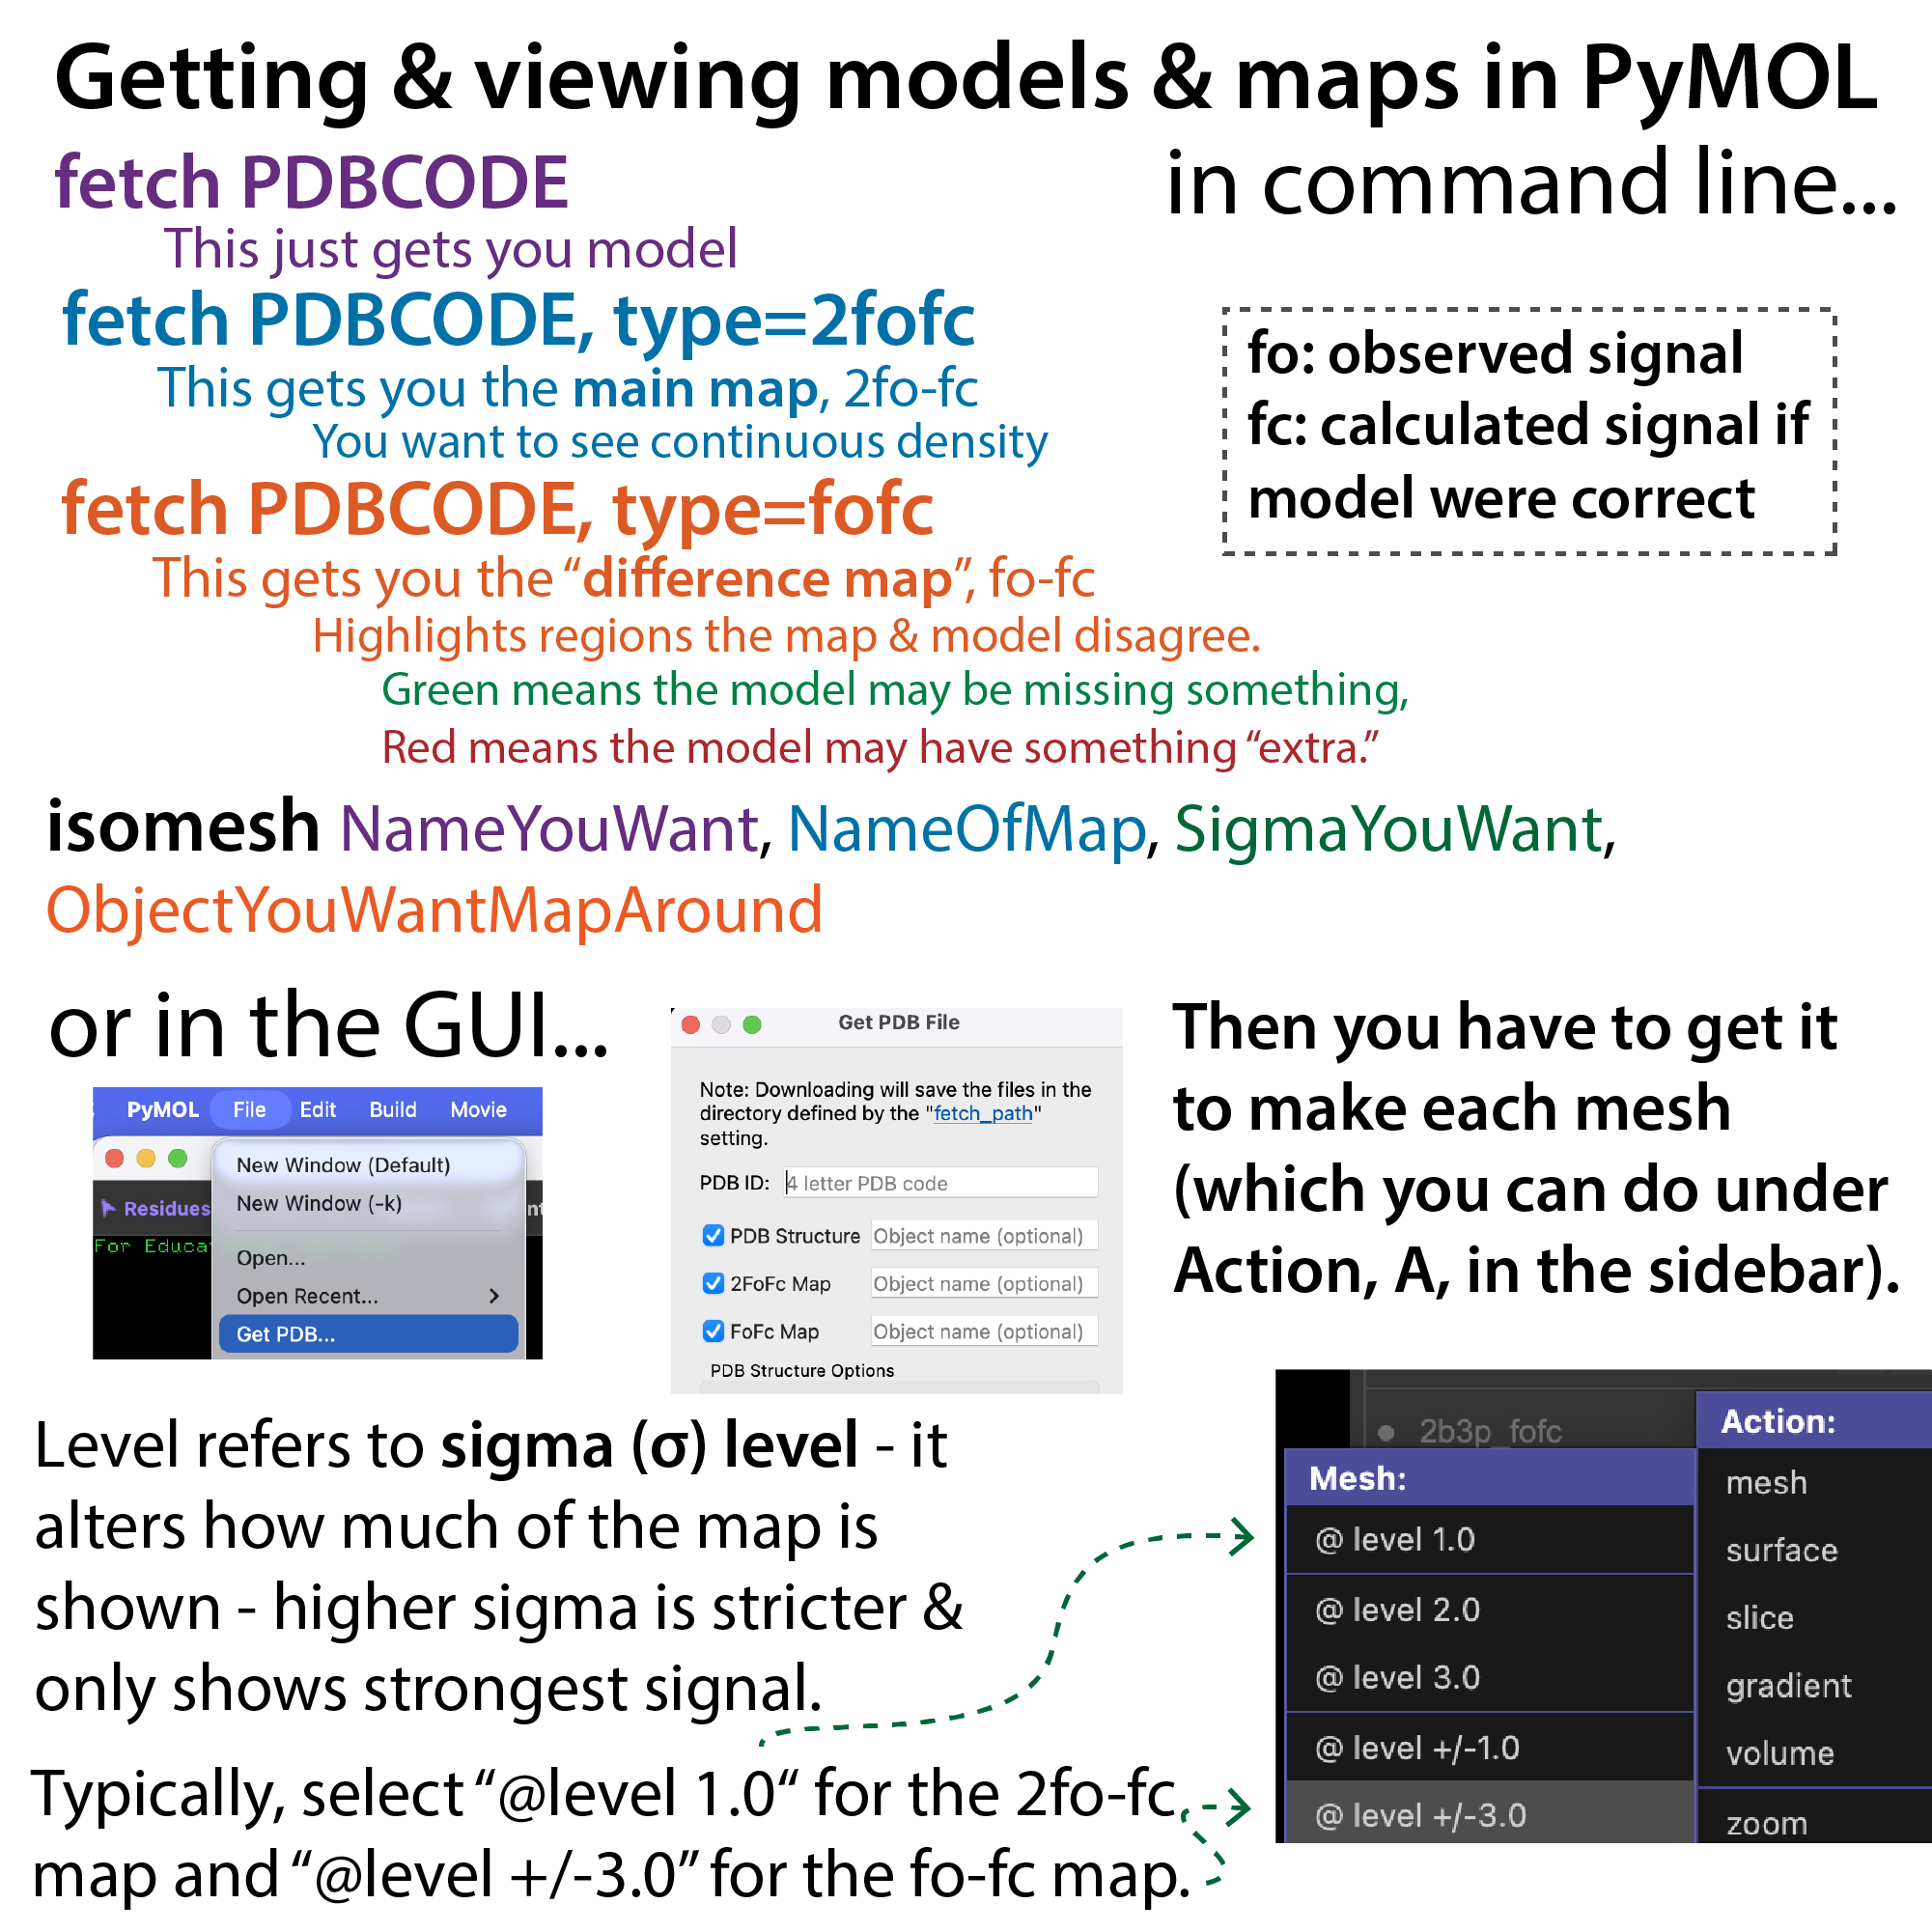
Getting & viewing models & maps in PyMOL:
In command line:
fetch PDBCODE
This just gets you model
fetch PDBCODE, type=2fofc
This gets you the main map, 2fo-fc. You want to see continuous density
fetch PDBCODE, type=fofc
This gets you the “difference map”, fo-fc. It highlights regions the map & model disagree: Green means the model may be missing something, Red means the model may have something “extra.”
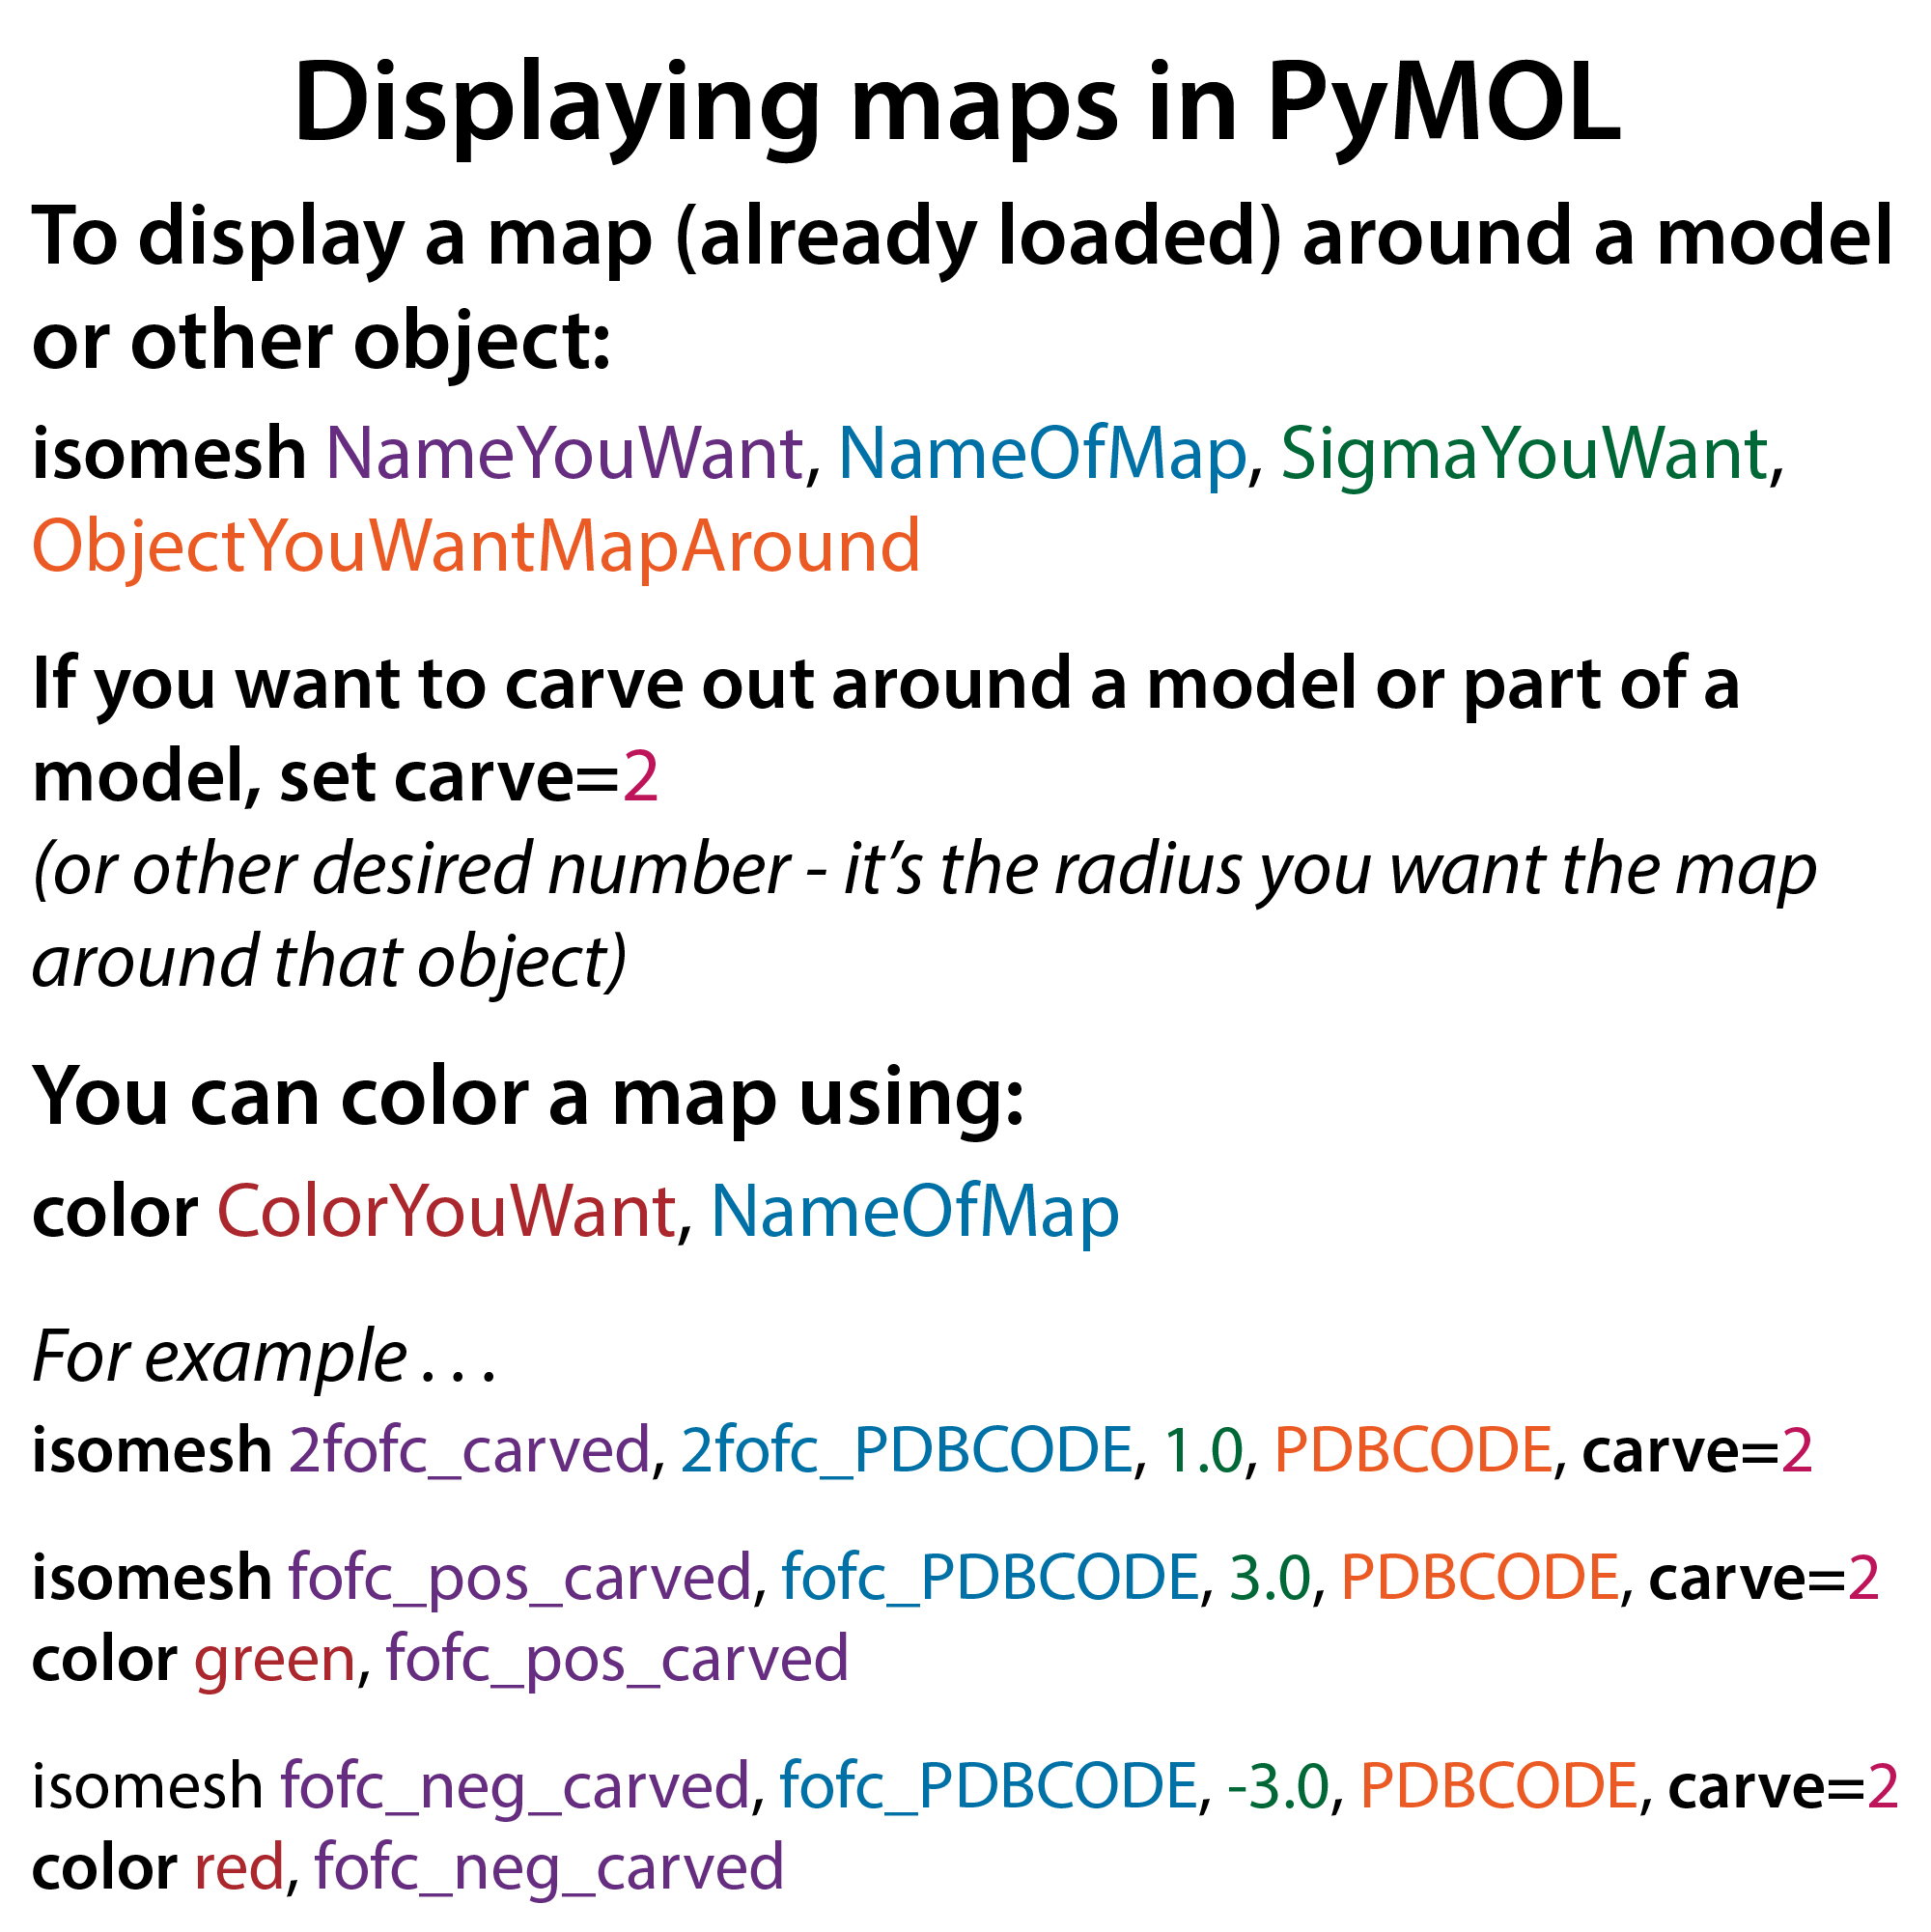
To then actually display the map:
isomesh NameYouWant, NameOfMap, SigmaYouWant, ObjectYouWantMapAround
If you want to carve out around a model or part of a model, set carve=2
(or other desired number – it’s the radius you want the map around that object)
You can color a map using: color ColorYouWant, NameOfMap
For example…
isomesh 2fofc_carved, 2fofc_PDBCODE, 1.0, PDBCODE, carve=2
isomesh fofc_pos_carved, fofc_PDBCODE, 3.0, PDBCODE, carve=2
color green, fofc_pos_carved
isomesh fof_neg_carved, fofc_PDBCODE, -3.0, PDBCODE, carve=2
color red, fofc_neg_carved
In the GUl…
File → Get PDB . . .
Check the boxes next to: PDB Structure, 2FoFc map, and FoFc map
Then you have to get it to make each mesh (which you can do under action, A, in sidebar).
Note: Level refers to sigma (o) level – it alters how much of the map is shown – higher sigma is stricter & only shows strongest signal. Typically, select”@level 1.0″ for the 2fo-fc, -> map and”@level +/-3.0″ for the fo-fc map.
With crystallography, things get really complicated really quickly. Here are some great resources to help you make sense of it… Full list here: Structural biology
Books:
Introduction to Macromolecular Crystallography, Second Edition, Alexander McPherson. First published:11 March 2008.Print ISBN:9780470185902 |Online ISBN:9780470391518 |DOI:10.1002/9780470391518
I had the pleasure of sitting in on the CSHL crystallography course twice and learning directly from Dr. McPherson (and a who’s who list of great crystallographers!). This book is really good and explains things in a comprehensive way that’s still comprehendible! It doesn’t get too into the math and instead helps you get a more intuitive sense of what’s going on. Highly recommend.
Crystallography Made Crystal Clear: A Guide for Users of Macromolecular Models, Gale Rhodes. ISBN 0080455549, 9780080455549 https://books.google.com/books/about/Crystallography_Made_Crystal_Clear.html?id=rwnR6qvaWgkC&source=kp_book_description
This is a more “meaty” book for those interested in really getting it down.
Articles:
“Protein crystallography for non‐crystallographers, or how to get the best (but not more) from published macromolecular structures” by Alexander Wlodawer, Wladek Minor, Zbigniew Dauter, and Mariusz Jaskolski. https://febs.onlinelibrary.wiley.com/doi/full/10.1111/j.1742-4658.2007.06178.x
This is probably one of my most-reread articles. It does a great job explaining the basics of how to go about critically interpreting the quality of protein crystal structures, what to keep an eye out for, and what the basic statistics mean.
Lamb, A. L.; Kappock, T. J.; Silvaggi, N. R. You Are Lost without a Map: Navigating the Sea of Protein Structures. Biochimica et Biophysica Acta (BBA) – Proteins and Proteomics 2015, 1854 (4), 258–268. https://doi.org/10.1016/j.bbapap.2014.12.021.
Shabalin, I. G.; Porebski, P. J.; Minor, W. Refining the Macromolecular Model – Achieving the Best Agreement with the Data from X-Ray Diffraction Experiment. Crystallogr Rev 2018, 24 (4), 236–262. https://doi.org/10.1080/0889311X.2018.1521805.
Websites:
Resources for Readers of Crystallography Made Crystal Clear https://spdbv.unil.ch/TheMolecularLevel/CMCC/index.html
This goes along with that book, but you don’t need the book to appreciate it. It has links to TONS of useful software programs and articles for learning about crystallography
Protein Crystallography Course, Randy Read. Clear visuals & explanations. https://www-structmed.cimr.cam.ac.uk/course.html
Lectures:
If you want to get hard-core into the nitty gritty of protein crystallography, Dr. Andrea Thorn has a great YouTube series of videos, “Basics of Macromolecular Crystallography”: https://youtube.com/playlist?