I’ve talked a lot about the theoretical basis for these techniques – using PCR to make lots of copies on a sequence, using fluorescence to measure the copies as they’re made (i.e in Real Time), and seeing how fast the fluorescence rises – but today I want to show you the practical aspects of using that rise in fluorescence to determine how many copies you started with.
And, before you get jumbled up in alphabet soup, note that RT can stand for real-time or reverse transcription. Because RT—RT-PCR is often used to measure “gene expression” by converting mRNA to complementary DNA (cDNA) then measuring levels of those copies.
link to video in case embed isn’t working: https://youtu.be/4WPkAMB_dPU
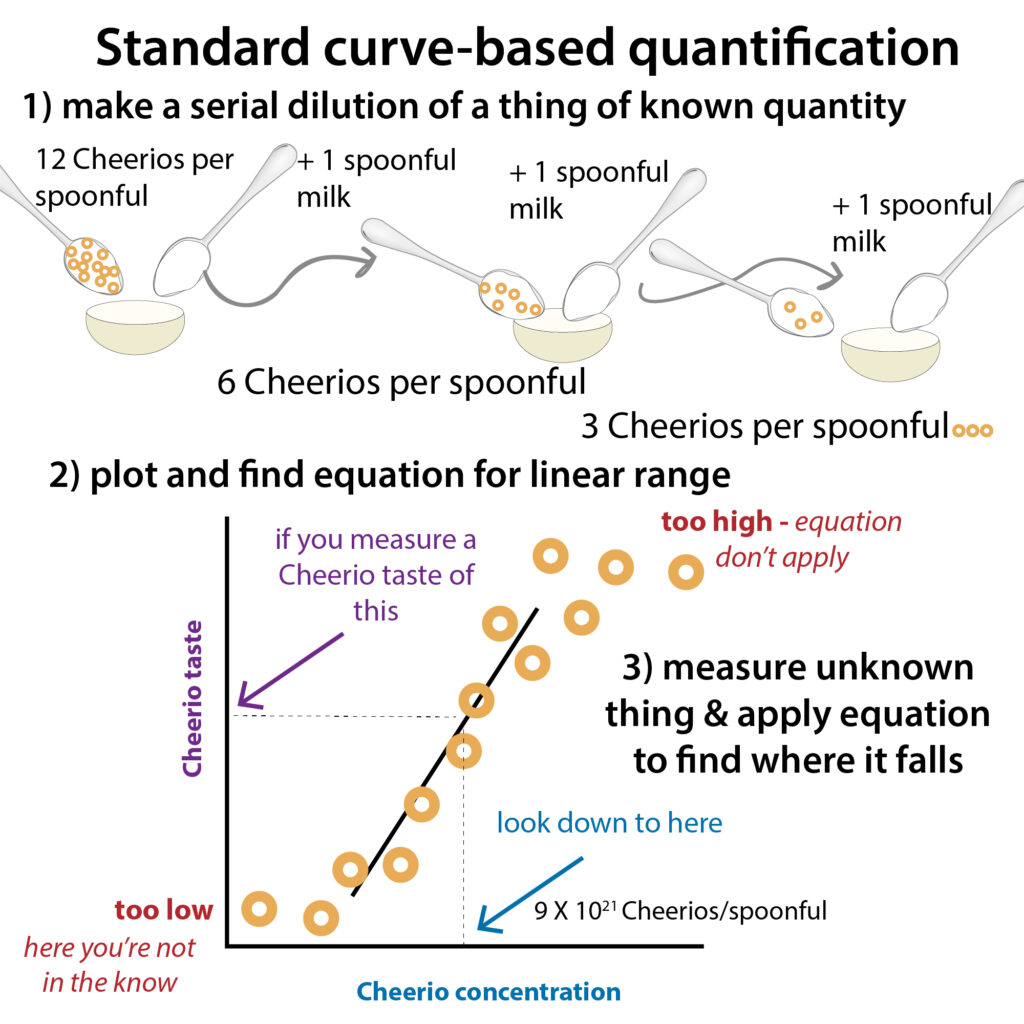
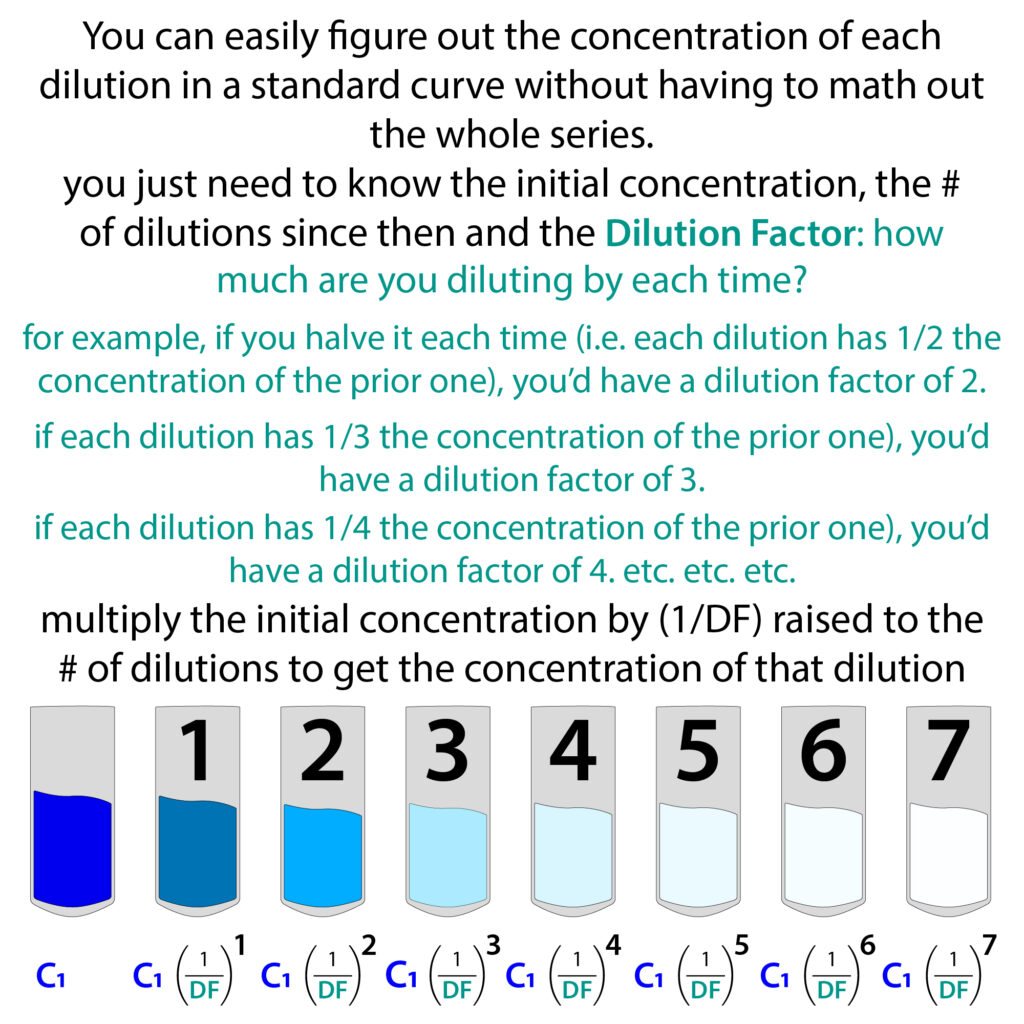
Another confusing thing is that real-time PCR isn’t always truly quantitative. If you want an absolute (as opposed to relative) concentration, you need to include a standard curve of known concentration of the product. Then you compare to that. In order to compare, you need to be in the linear range of detection. So you may need to dilute your sample before running (if you aren’t sure what how much you need to dilute it, test out a few different dilution factors). If you do dilute, be sure to take this into account when calculating the concentration you get from your standard curve equation. For example, if you did a 1:4 dilution, multiply the concentration you calculate by 4 to get your initial, “stock” concentration.
Yet another confusing thing is that the terms Cq and Ct are used interchangeably to refer to the cycle number at which the fluorescence increases above the “threshold” – the signal from background. With either, the lower the value, the higher the concentration.
Hopefully the video helps explain these things better and here is a link to the example if you wanted to follow along:
And if you want the background details, here’s a condensed/adapted version of a past post (which deals more with RT-RT-PCR). You can find that whole thing here: http://bit.ly/rtrtqpcrprimer & https://youtu.be/kp4ZX2lOr6w
Just like in normal PCR, qPCR is performed in cycles of temperature changes – melt (heat up to separate strands) → anneal (cool down to let primers bind & Pol latch on) → extend (let Pol lay down complementary DNA) → repeat.
So you need 2 primers – one for each strand – one will define the start & the other the stop for the region you want to copy. The first primer will bind the template DNA (at where you want to start) and Pol will start copying it 5’ to 3’ until it falls off the end of the cDNA or it runs out of steam, etc. And then in the next cycle that second strand needs a primer that bind it – and where it binds will define the start of where that strand starts. And it’ll go to where the 1st primer started because that’s as far as the strand it’s copying goes. So from then on you get same-length copies each time (of a defined region book-ended by the primers).
Each round of PCR, another copy can be made from each copy, so you increase exponentially. In the very beginning you can’t tell this though because the levels are so low you’re below the background & just see “noise.” But soon you’ll enter the exponential phase where you get measurable doubling each cycle – and since you start with way more supplies (primers, dNTPS, etc.) than you need, you don’t have to worry about running out. But later on you do start running out, so copy # stops growing exponentially, and your curve plateaus.
How do the copies get measured? Fluorescence – this is where a molecule absorbs a certain wavelength of light and release a different wavelength. More here: http://bit.ly/fluorescentstains
If you can directly couple the amount of light given off to the number of copies you make, and you use a special PCR machine with a fluorescence detector, you can read out – in “Real Time” – the number of copies you’re making. There are a couple of different ways of going about this.
“Generic” DNA-binding dyes like SYBR Green – it has a flat structure that can kinda wedge itself in between bases in DNA (intercalate). It fluoresces strongly when it’s zapped with a laser of the right wavelength of light AND it’s bound to double-stranded (ds) DNA, but not when bound to single-stranded (ss) DNA. So the more dsDNA is made (which happens when you make more copies) the more fluorescence you’ll see.
An alternative is to use specific reporter probes – a common such probe method is “TaqMan” -in some ways these probes are like specific primers – they’re short pieces of DNA (oligos) that you design to match specific sequences – but unlike primers, these aren’t designed to act as starting stations for Pol – they lack a 3’OH so can’t be build off of. And instead of the start of your thing, you design them to match somewhere in the middle of the thing you want copied.
The probe will bind and serve as a kind of “roadblock” – but instead of getting slowed down by it, the Pol chews it up because it has exonuclease activity (can chew up nucleic acids from the ends). And when the roadblock gets chewed up you get a fluorescent read-out. Why? Don’t FRET – let me explain!
On one end of the probe is a fluorophore (the reporter) and on the other end is a quencher. When the probe is uncut they’re close enough that the quencher can absorb the energy that the fluorophore would normally give off as light – it “quenches” the fluorescence that would given off by the fluorophore in a phenomenon known as FRET (Forster Resonance Energy Transfer (FRET)). More on FRET: http://bit.ly/fretandfluorescence
But when they get chewed up they separate so the quencher gets far away, the light doesn’t get stolen, & you can see it. And since the chewing occurs each time a copy gets made, you can use increase in fluorescence as an indicator of copy-making.
You can plot cycle # vs fluorescence and – in either type of measuring – what you’re looking for is a value called the Cq value (quantification cycle) which is the # of cycles it takes to pass a “threshold line” corresponding to the background fluorescence level – the more copies you start with, the fewer cycles it will take (lower Cq) and the more “left-shifted” your curve will be. This is the value also often referred to as Ct (cycle where you exceed the threshold).
To get actual quantification, use a standard curve, as detailed here: https://bit.ly/standardcurves ; YouTube: https://youtu.be/9ZAWm5xm6gc
I plot the Cq on the x axis and the log10 of the concentration (in pico molar, pM) on the the y axis. I use the log so I can span a wide range of values without them all being squished up in the corner of the graph. But then I have to take this into account when using the equation because what it will give me is the concentration in log10(pM)
conc (in log10(picomolar)) = Cq*slope + intercept
To get the non-logged number, I take the antilog:
pM = 10^(log pM)
Then to get the stock concentration, I multiply that by the dilution factor:
stock pM = pM of diluted * dilution factor
This article from Adriana Gallego, PhD, on the GoldBio website does a nice job of explaining things: “How to Interpret RT-qPCR Results” https://goldbio.com/articles/article/How-To-Interpret-RT-qPCR-Results
And if you want the nitty gritty about technical details when it comes to making comparisons (taking into account things like different “primer efficiencies” for different targets), here’s a paper you might find useful: Ruiz-Villalba, A., Ruijter, J. M., & van den Hoff, M. J. B. (2021). Use and Misuse of Cq in qPCR Data Analysis and Reporting. Life (Basel, Switzerland), 11(6), 496. https://doi.org/10.3390/life11060496
Sometimes you follow up your qPCR run with a melt curve analysis, which can tell you things like whether you have multiple products in your mix. This is especially a concern if you are using a generic dye like the SYBR Green. How the melt curve works is you gradually raise the temperature. At some point, it will get hot enough that the strands will melt. And then the dye won’t have dsDNA to bind and you’ll lose your fluorescence. How hot this is when it happens (the Tm) depends on how tightly the strands were stuck together, which will be different for different products. So if you see inflection points (which show up as peaks if you graph the slope), that could indicate multiple products. But there are also caveats like usual… Here are a couple helpful webinars that discuss some of them.
IDT webinar: Design considerations for qPCR assays https://youtu.be/C-aJ103lUwQ
IDT webinar: Technical Tips for qPCR—Sample and Experimental Considerations https://youtu.be/g9rqdtdYOg0
note: qPCR involves a lot of pipetting & it’s a real pain & easy to make stupid mistakes – I really hate it – especially since I have this bad habit of holding my breath when I concentrate – so I kept making myself light-headed setting all the reactions up! To save my head, I plan things out in detail beforehand, using a spreadsheet to show what to pipet where and when, and use a multichannel pipet to help.
more on these sorts of things, as well as mastermixes, here: http://bit.ly/mastermixesmultichannels