AlphaFold uses AI to, based on knowledge gained about the relationship between protein sequences and their corresponding structures (thanks to lots of work by structural biologists!), predict the structure of a protein based on their sequence. Many structures have been predicted already using this software and uploaded to the AlphaFold Protein Structure Database (AFDB) as well as UniProt and even the PDB, which is great (and time and resource-saving) if you only need a single chain modeled. BUT, if you want to model a multimeric complex or something, you’ll have to use AlphaFold directly. There are more powerful ways to do this, where you can model much more complex things and have more control over parameters, but for simple structures, the AlphaFold Server offers an easy cloud-based tool that you can use.
You can access it here: https://alphafoldserver.com/
Using it is fairly straight-forward, but interpreting the results can be trickier, so here’s a quick guide (and for more, I encourage you to check out EMBL-EBI’s online tutorial, “AlphaFold: A practical guide” by Paulyna Gabriela Magana Gomez and Oleg Kovalevskiy: https://www.ebi.ac.uk/training/online/courses/alphafold/
Interpreting the results of AlphaFold structure predictions
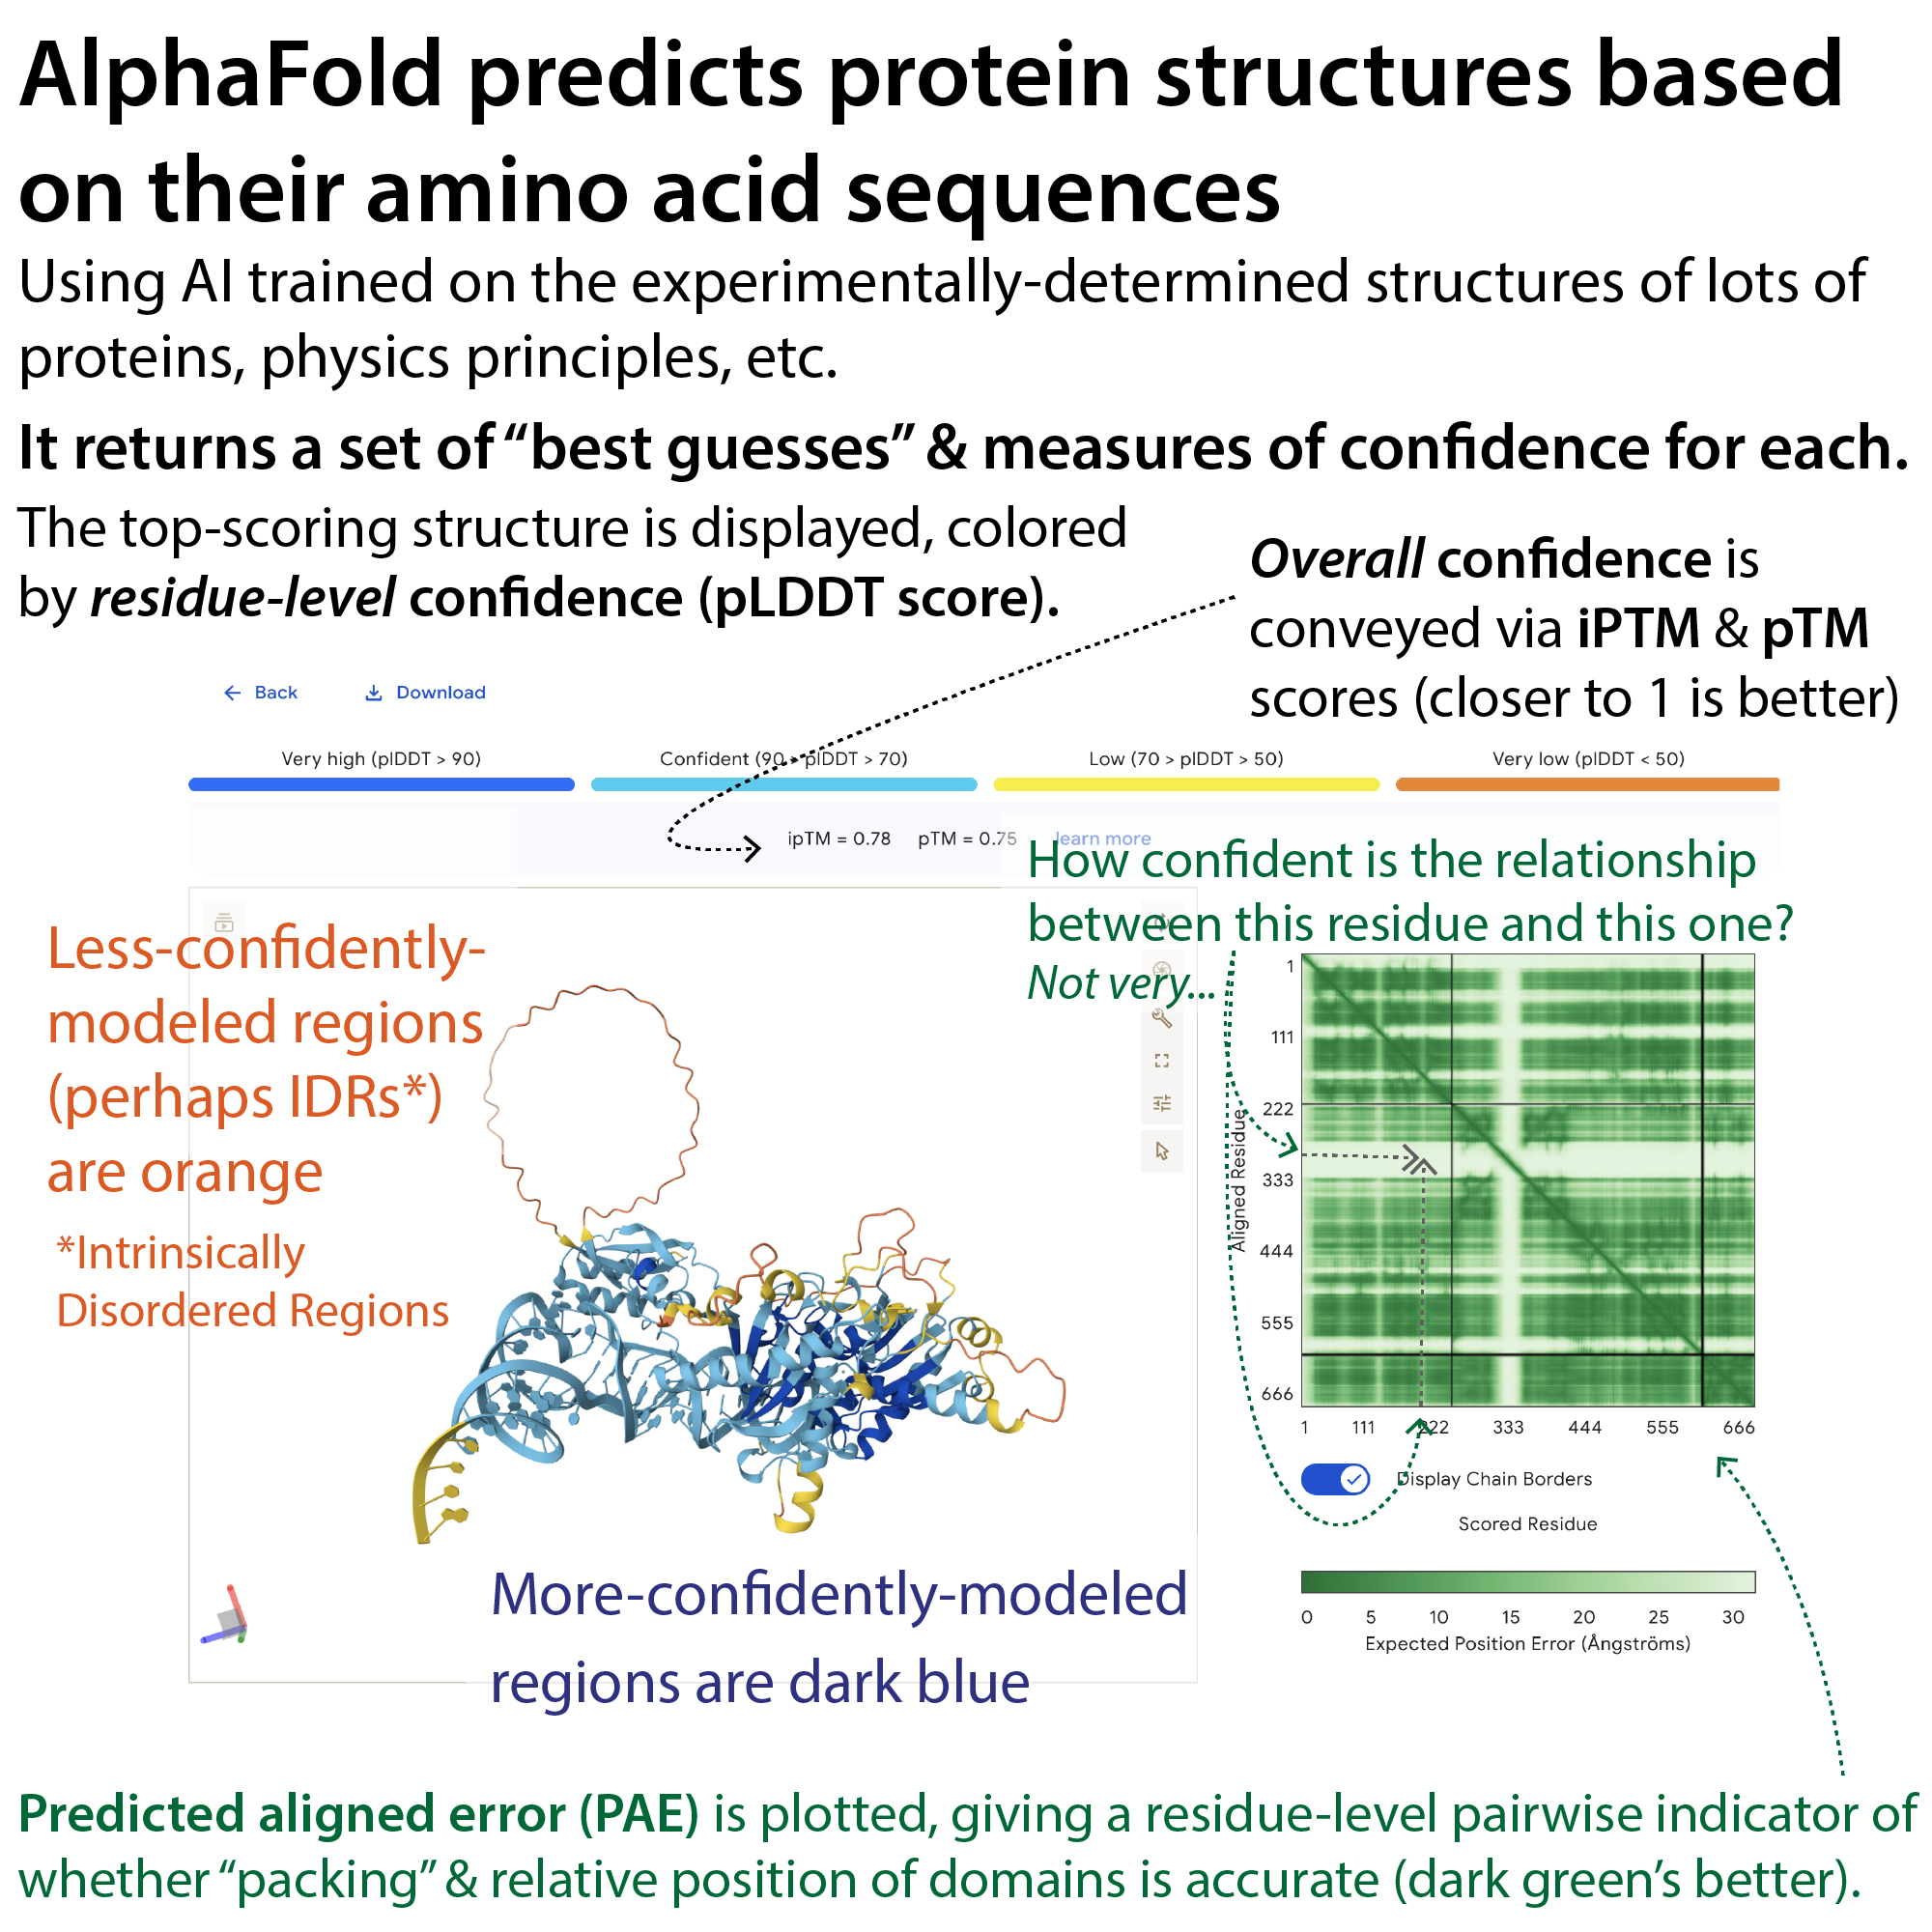
AlphaFold tests out a variety of potential structures and then returns the 5 that it deems “best” to you, along with indicators of how confident it is that the structure is accurate overall (TM, pTM, and/or ipTM scores) as well as at the level of individual residues (pLDDT scores) and pairs of residues (PAE scores).
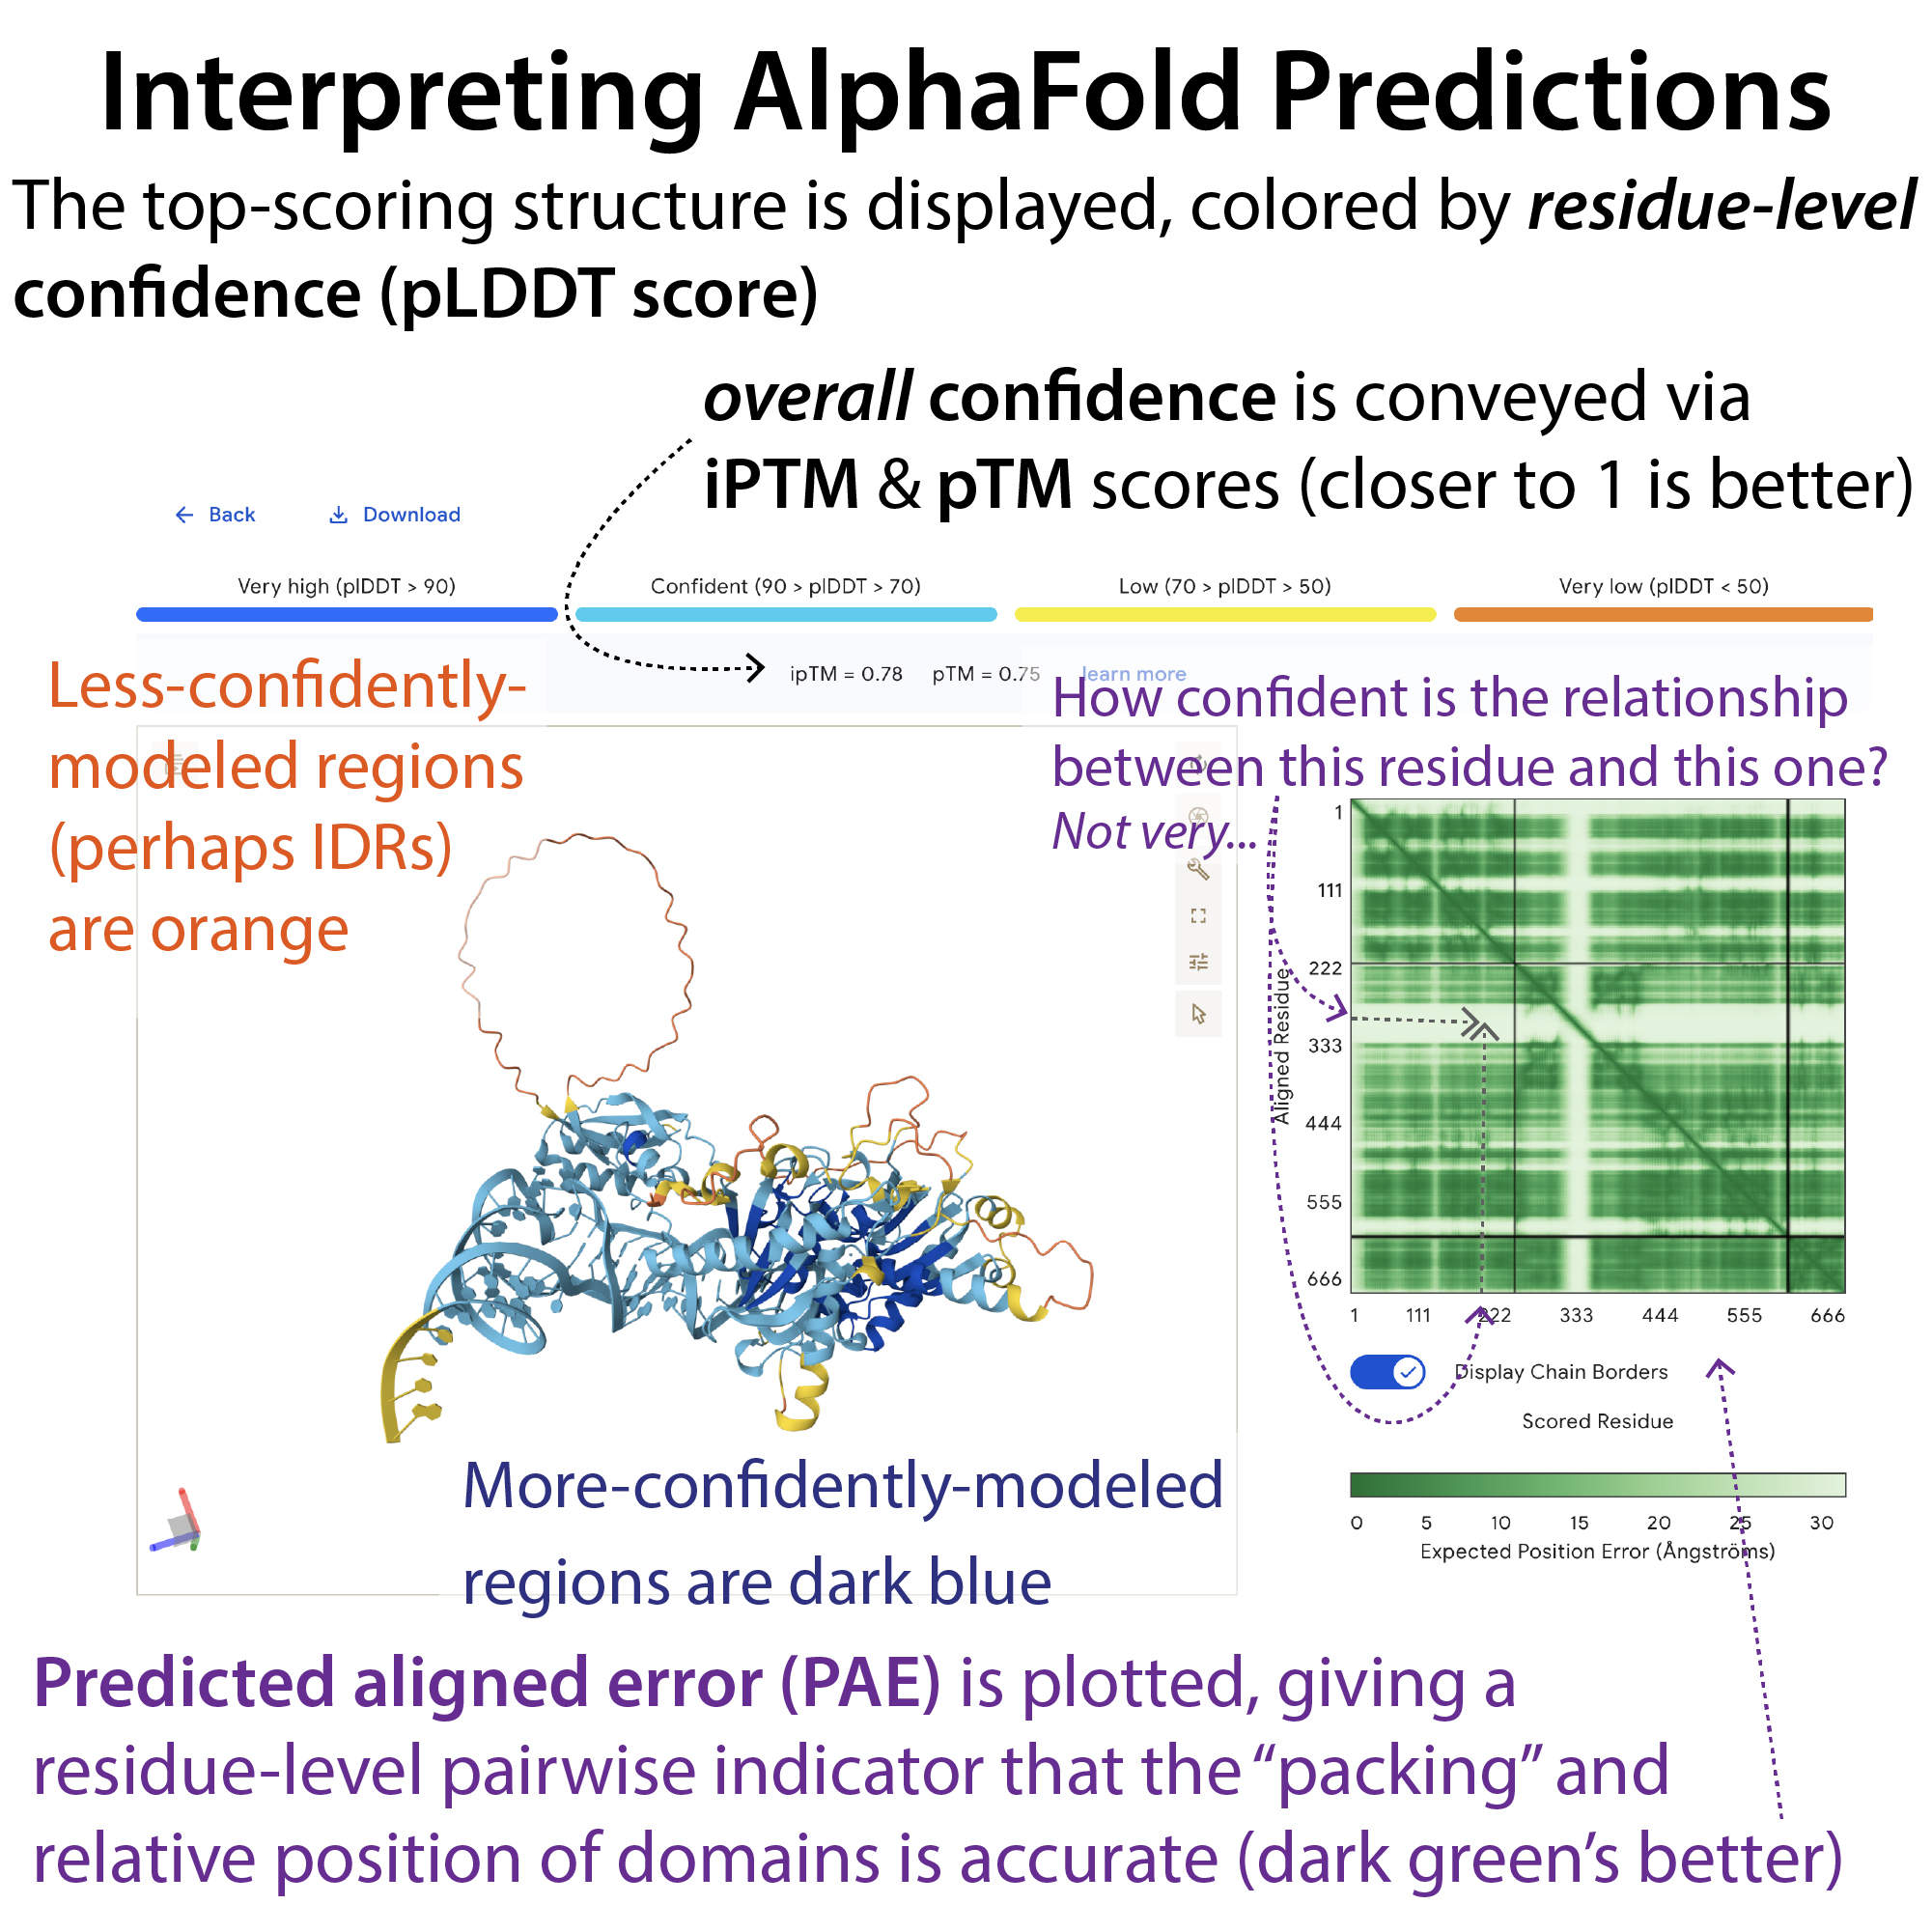
When you open the results, the AlphaFold Server will show you the top-scoring structure, colored by a per-residue confidence level called the pLDDT (predicted Local Distance Difference Test), described below.
pLDDT (predicted Local Distance Difference Test): residue-level confidence (includes both backbone and sidechain)
- Scaled from 0-100, with 100 being most confident
- This is what the structure is colored by, by default
- Very high (>90): dark blue
- High: (70-90): light blue (in this range, the backbone may be “correct,” but the sidechain not)
- Low (50-70): yellow
- Very low (<50): orange (this may indicate an intrinsically disordered region (IDR) or just a lack of information in the database)
- Saved in the B-factors field of PDB or mmCIF file – can use to color code in PyMOL, ChimeraX, etc.
- In PyMOL, enter “spectrum b, red blue” in the command line to correct the coloring scale (it’s inverse by default for some reason)
On the right-hand side of the screen, you’ll see a green plot. This is graphically depicting the Predicted Aligned Error (PAE) score, which indicates whether the “packing” and relative position of domains is likely accurate.
Predicted aligned error (PAE): a level of confidence in the relative position of 2 residues – indicator that the “packing” and relative position of domains is accurate
- It’s given in Angstrom (Å), with lower being better (smaller difference between the predicted structure and the hypothetical “true” structure)
- This is what’s depicted in the green plot thing
- X & Y axes are the residues in numerical order, and the PAE score for that pair of residues is displayed as a shade of green
- Darker green corresponds to lower error (better)
- Lighter green corresponding to higher error (worse)
- There will always be a diagonal line because that’s just comparing a residue to itself
- X & Y axes are the residues in numerical order, and the PAE score for that pair of residues is displayed as a shade of green
- On the website, the PAE plot is interactive–you can click and drag to select regions of the plot and see what residues they correspond to in the accompanying structure. These residues will also be highlighted in the displayed sequence below the graphics windows.
In addition to those fine-scale measures of confidence, there are measures of overall confidence, based on a value called the Template Modeling (TM) score. These include the Predicted template modeling (pTM) score and, in the case of multimeric complexes, the interface predicted template modeling (ipTM) score, described below
Predicted template modeling (pTM) score: integrated confidence measure for the structure overall
- How close is the predicted structure to the theoretical “true” structure?
- Want it to be at least 0.5
- Though it will likely be very low for short sequences, without indicating errors
interface predicted template modeling (ipTM) score: confidence in predicted relative positions of subunits in a multimeric complex
- > 0.8 is confident
- 0.6-0.8: use with caution
- < 0.6: “fail”
- Though it will likely be very low for short sequences, without indicating errors
You may also see Per chain pTM and per-chain pair ipTM.
Output files
When you download the results, rather than just a single mmCIF file (supplanter of the .pdb file, which is being phased out), you actually get a whole zipped file containing not just that file for the top hit, but also those for the next 4 “most confident” structures, as well as additional files containing confidence information, and other files that you don’t need to worry about.
As mentioned, the per-residue confidence score, pLDDT, is saved in the B-factors field of these files. In PyMOL, enter “spectrum b, red blue” in the command line to color by this (it’s inverse by default for some reason)
The files with the actual predicted structures are the mmCIF files, which are labeled with their relative confidence ranking, from 0-4, with 0 being what the software considers the “most accurate.” These files will be named in the format: jobname_rank.cif (e.g., my_job_0, my_job_1, my_job_2, my_job_3, my_job_4) and you can open them in PyMOL, ChimeraX, iCN3D, etc.
much more structural biology content: https://bit.ly/structural_biology & https://youtube.com/playlist?list=PLUWsCDtjESrGhwVxsRbTJdL-BEsN60RCs