The better the experimental data collected, the better the chances the scientists can build a well-fitting, geometrically-sound atomic model. But it’s not guaranteed that they’ll succeed! So it’s important to evaluate models for their soundness and there are parameters we can use to evaluate the quality of both the model and the underlying data. And the PDB (Protein Data Bank) collates it all for you in a “PDB Validation Report” and even lets you see problem areas in 3D.
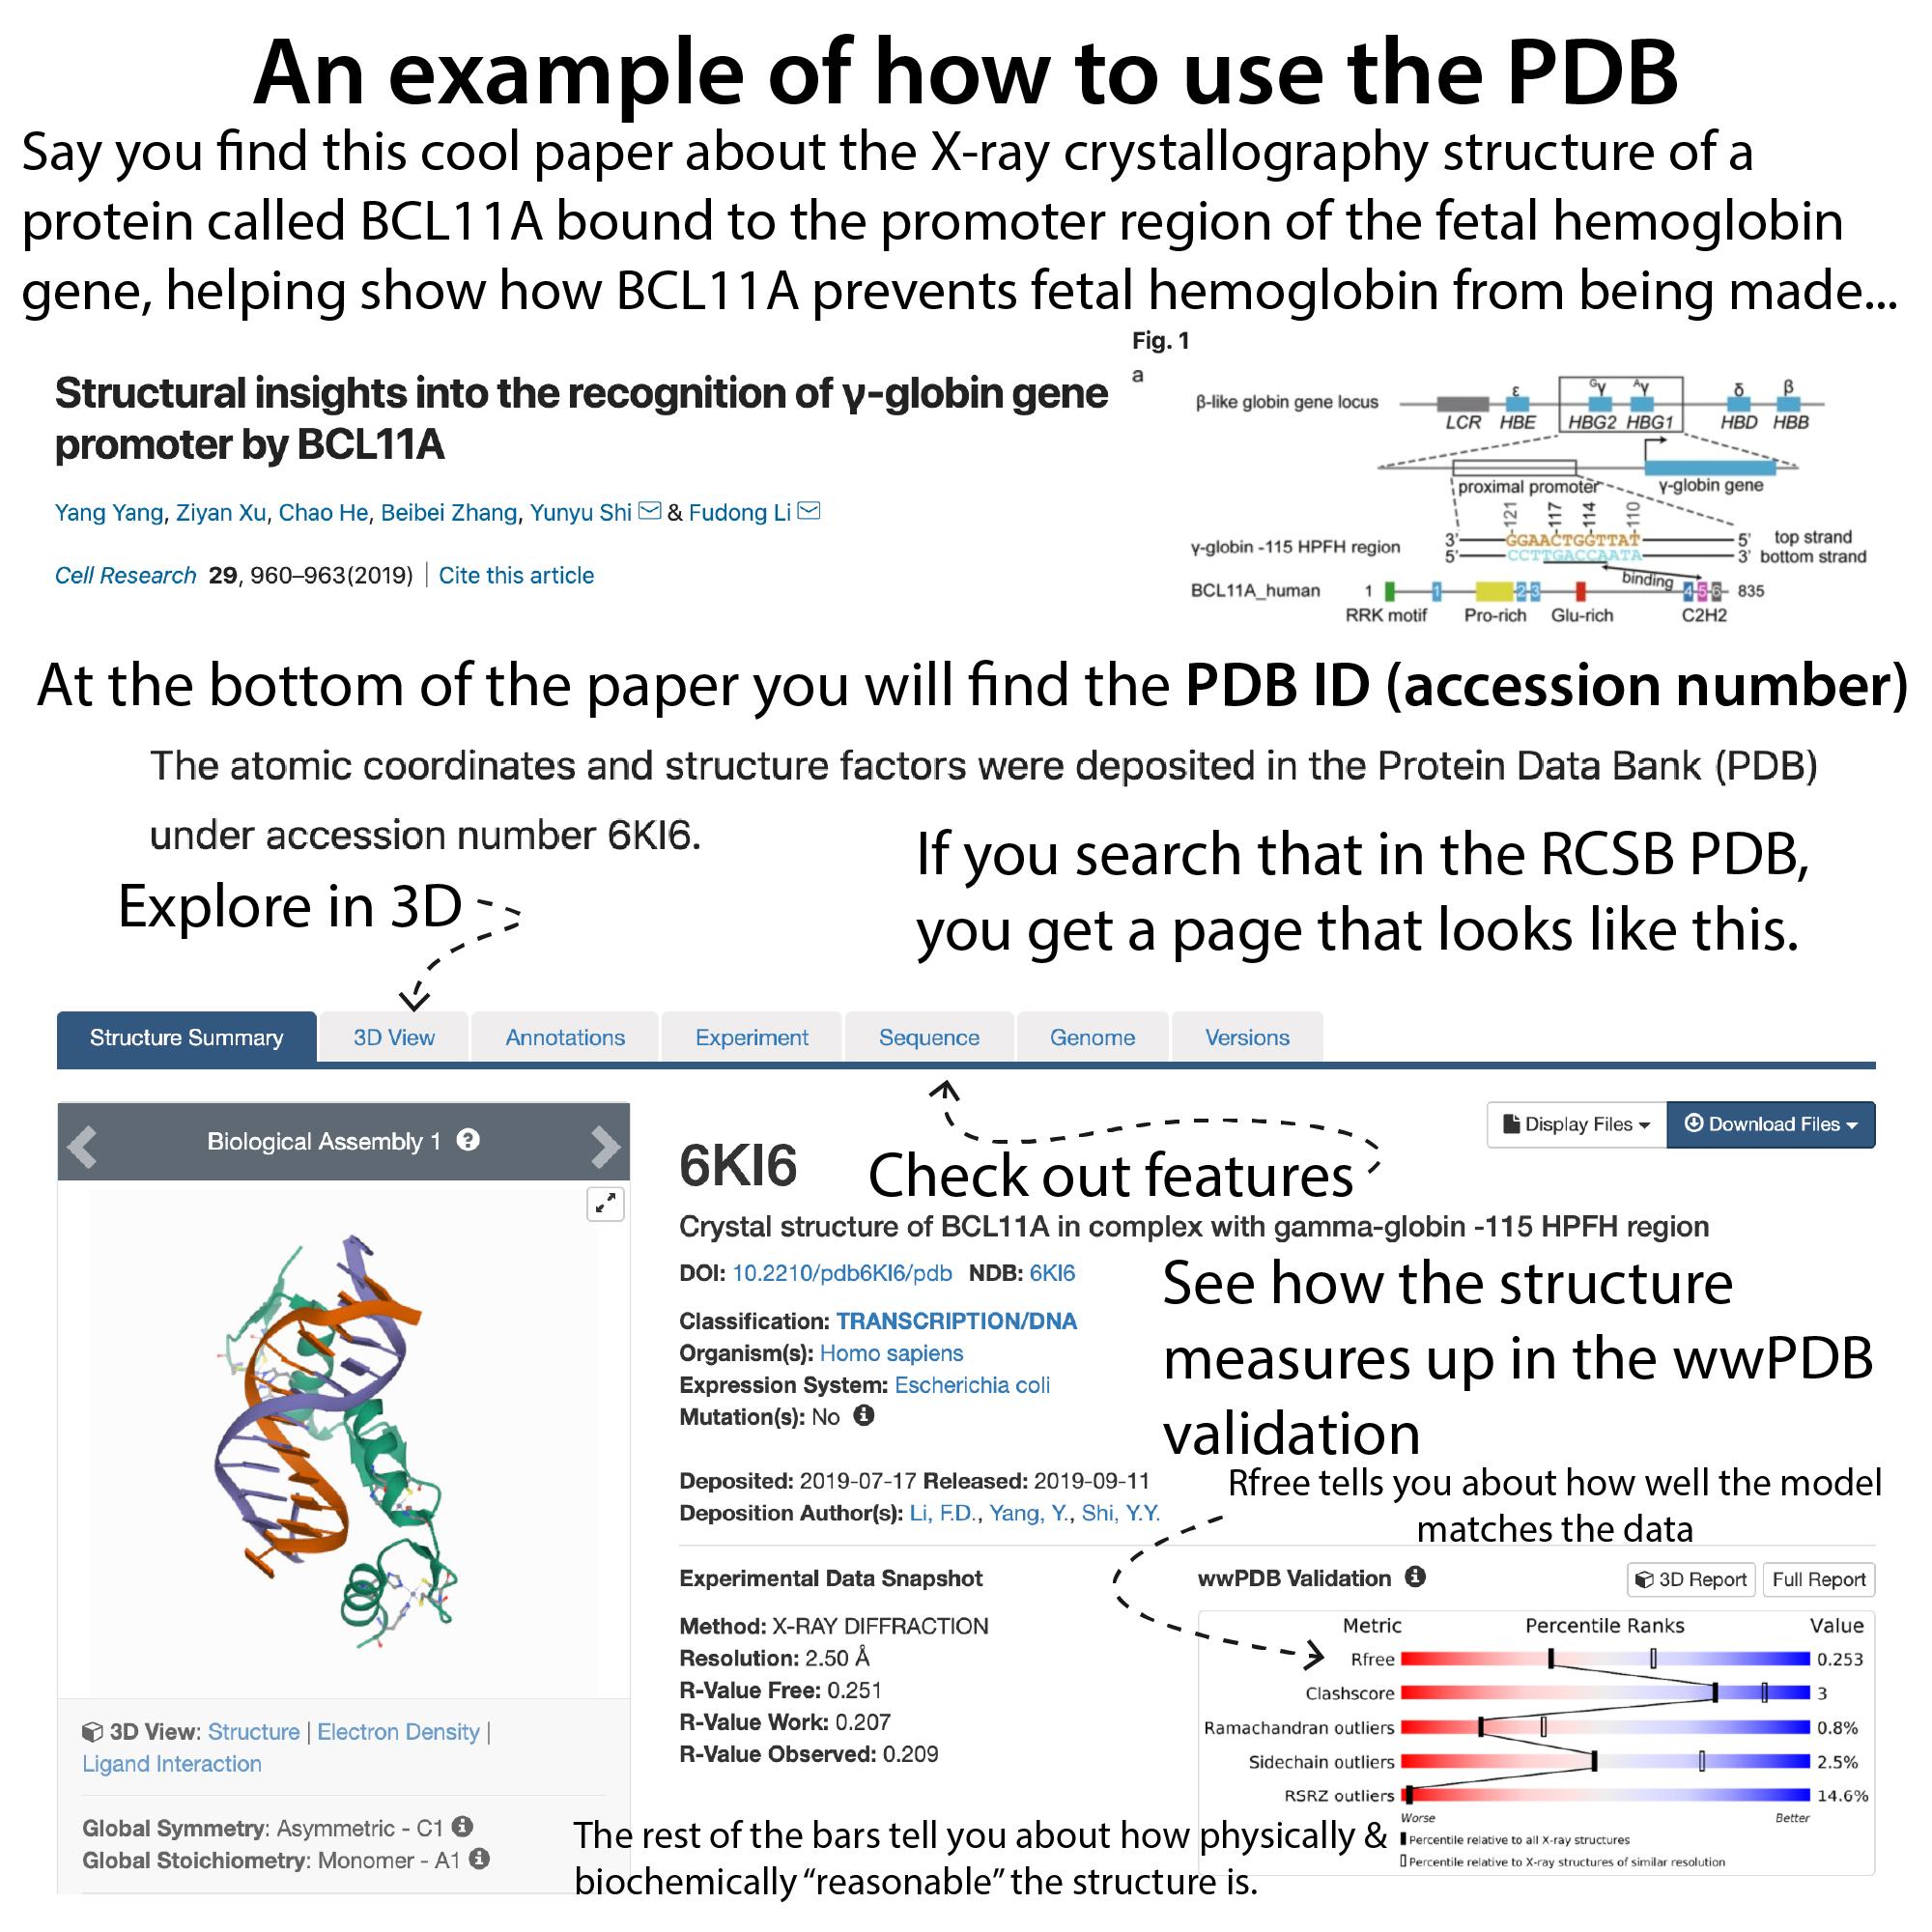
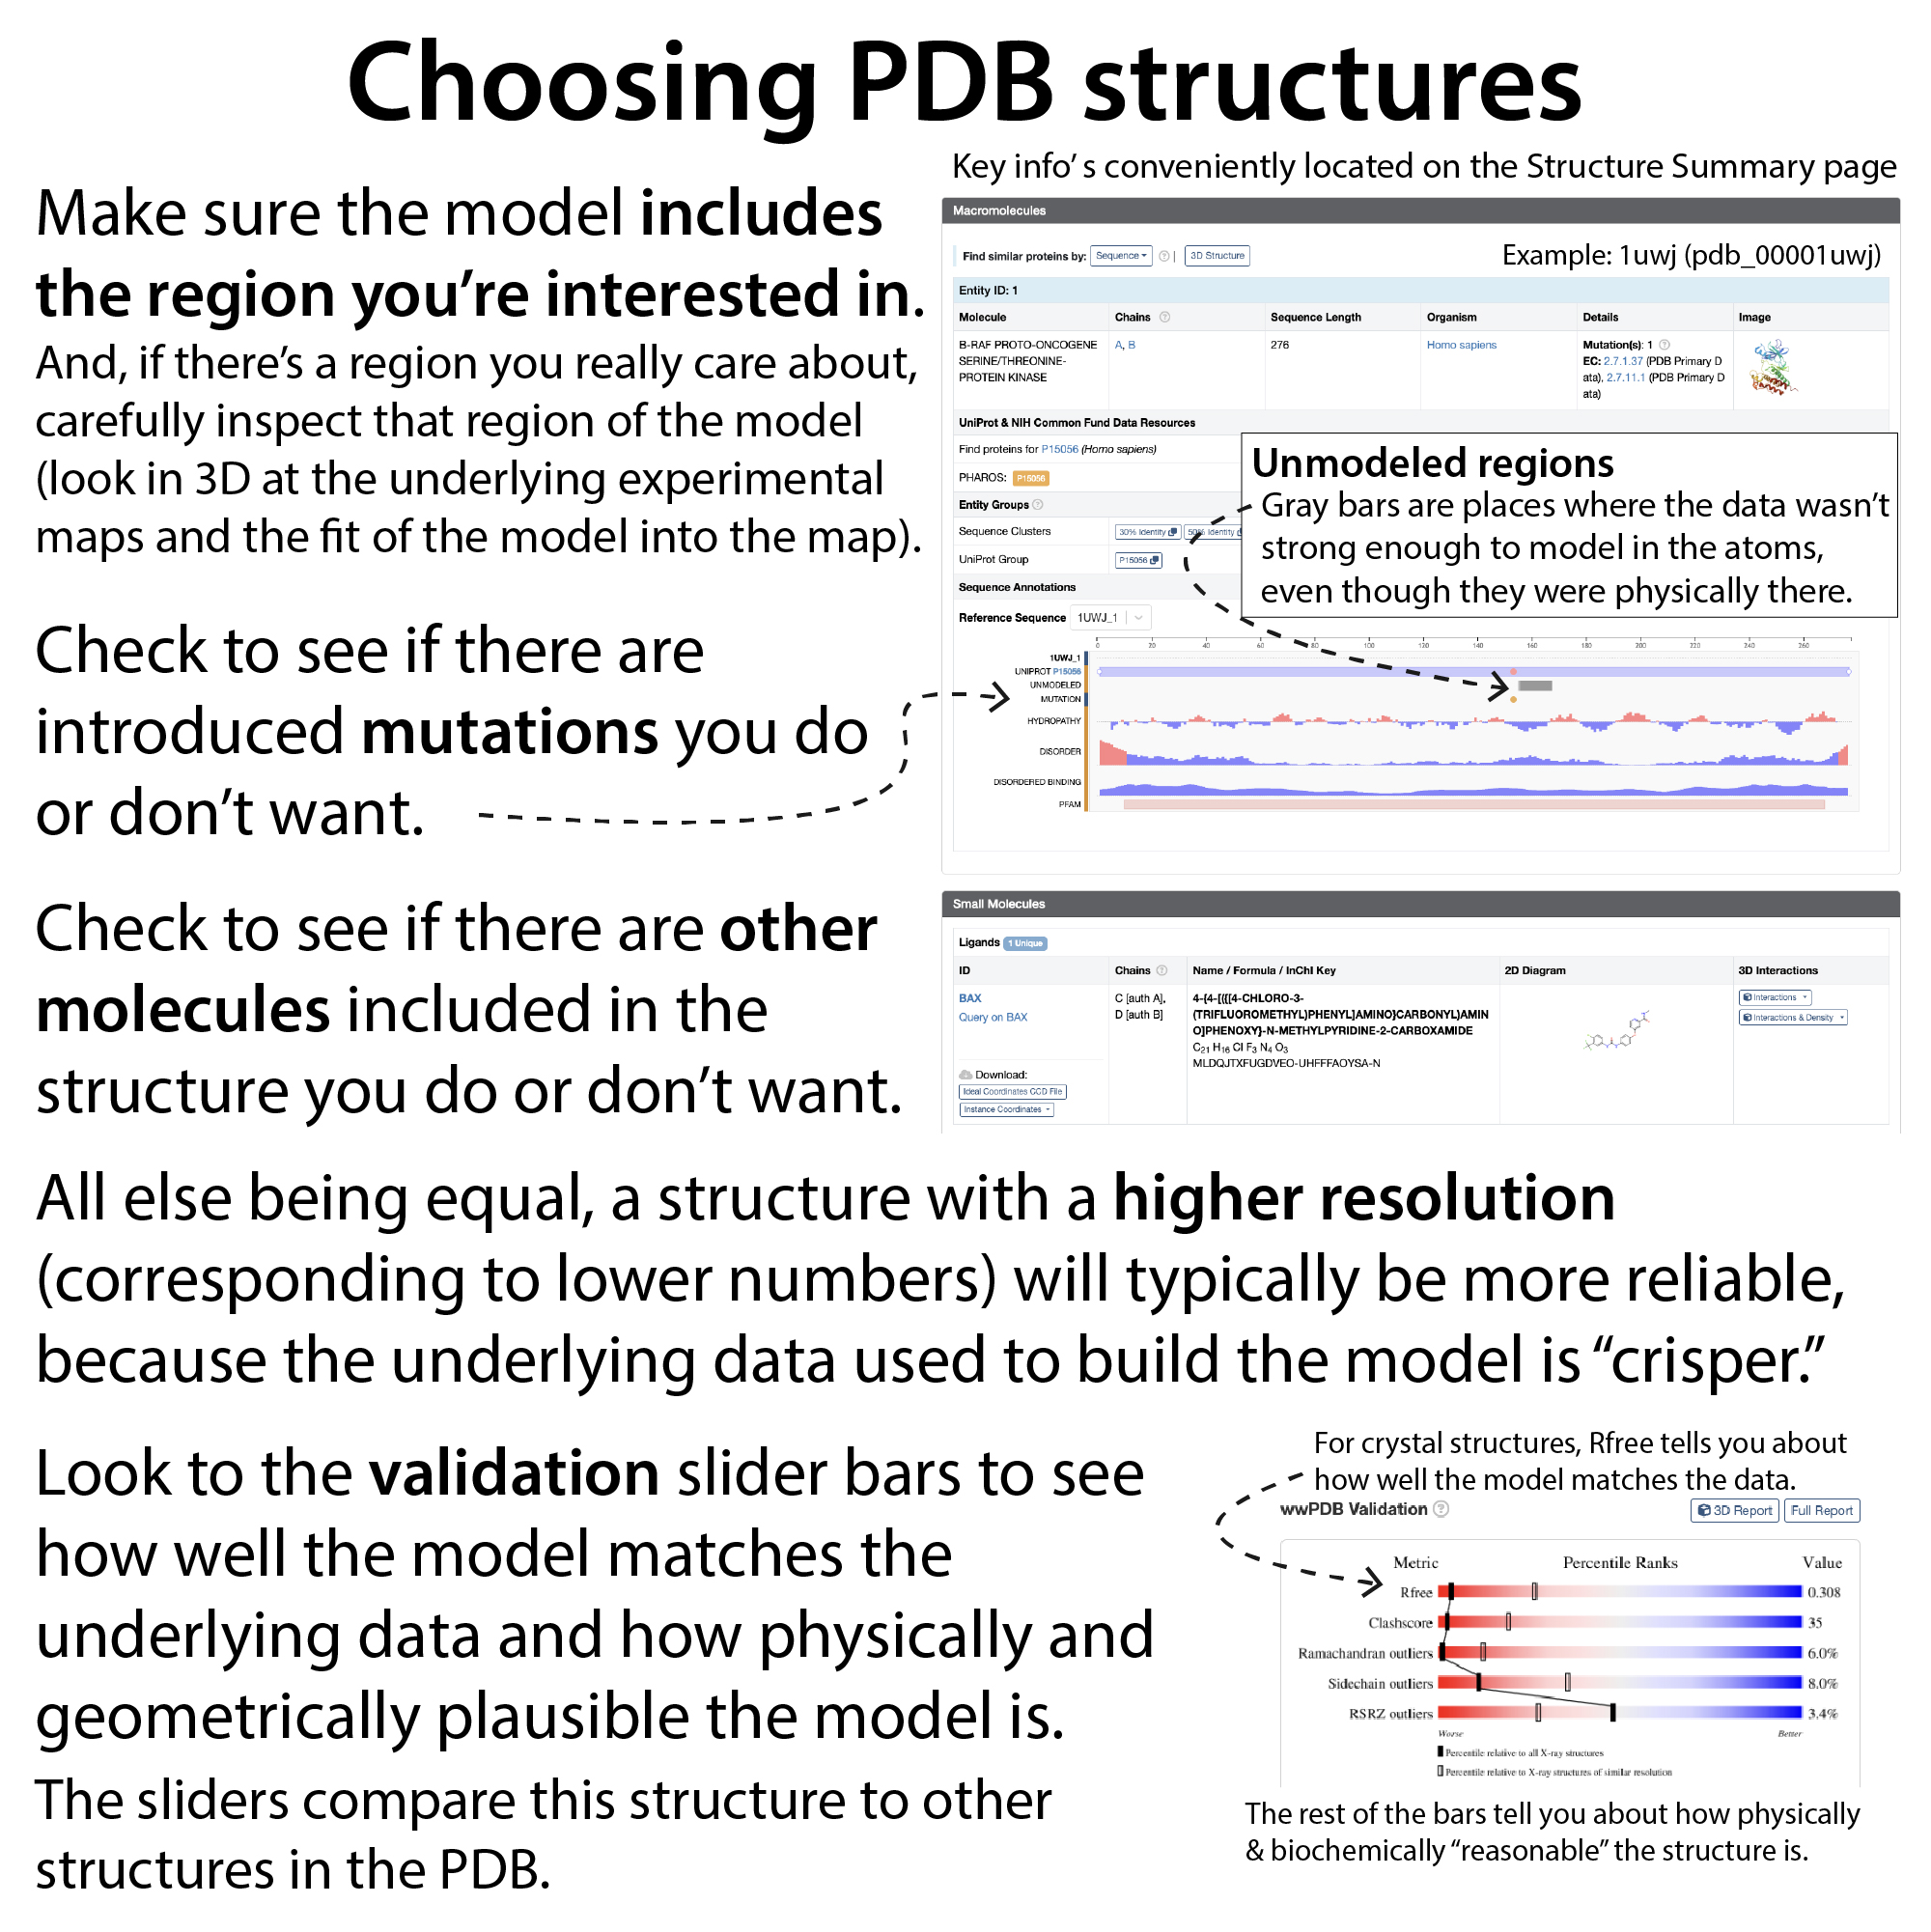
At least on the RCSB website, which is what I’m going to be referencing and showing in the figures, an overview of the validation report is shown in a quick visual form as slider bars. And then you can click to see the full report. These bars contain some global statistics that tell you about the overall fit and the molecular feasibility of the model, shown as red (worse than average) to blue (better than average) slider bars in their wwPDB validation report. “Average” here is compared to all other structures solved using that same experimental technique (e.g., x-ray crystallography or cryo-EM) (black bars) as well as to all other structures solved using that same experimental technique with similar resolution (unshaded bars).
Note: it’s known from really high-res structures that it’s normal for actual proteins to physically have some outliers and deviations from ideal, so it’s also normal for models to have some. If the outliers are too low, it could mean that the model was being refined too much to be “ideal” based on geometry instead of being refined to actually match the data. Refinement should include a mixture of the two, and you should end up with a low, but not too low, level of weirdos.
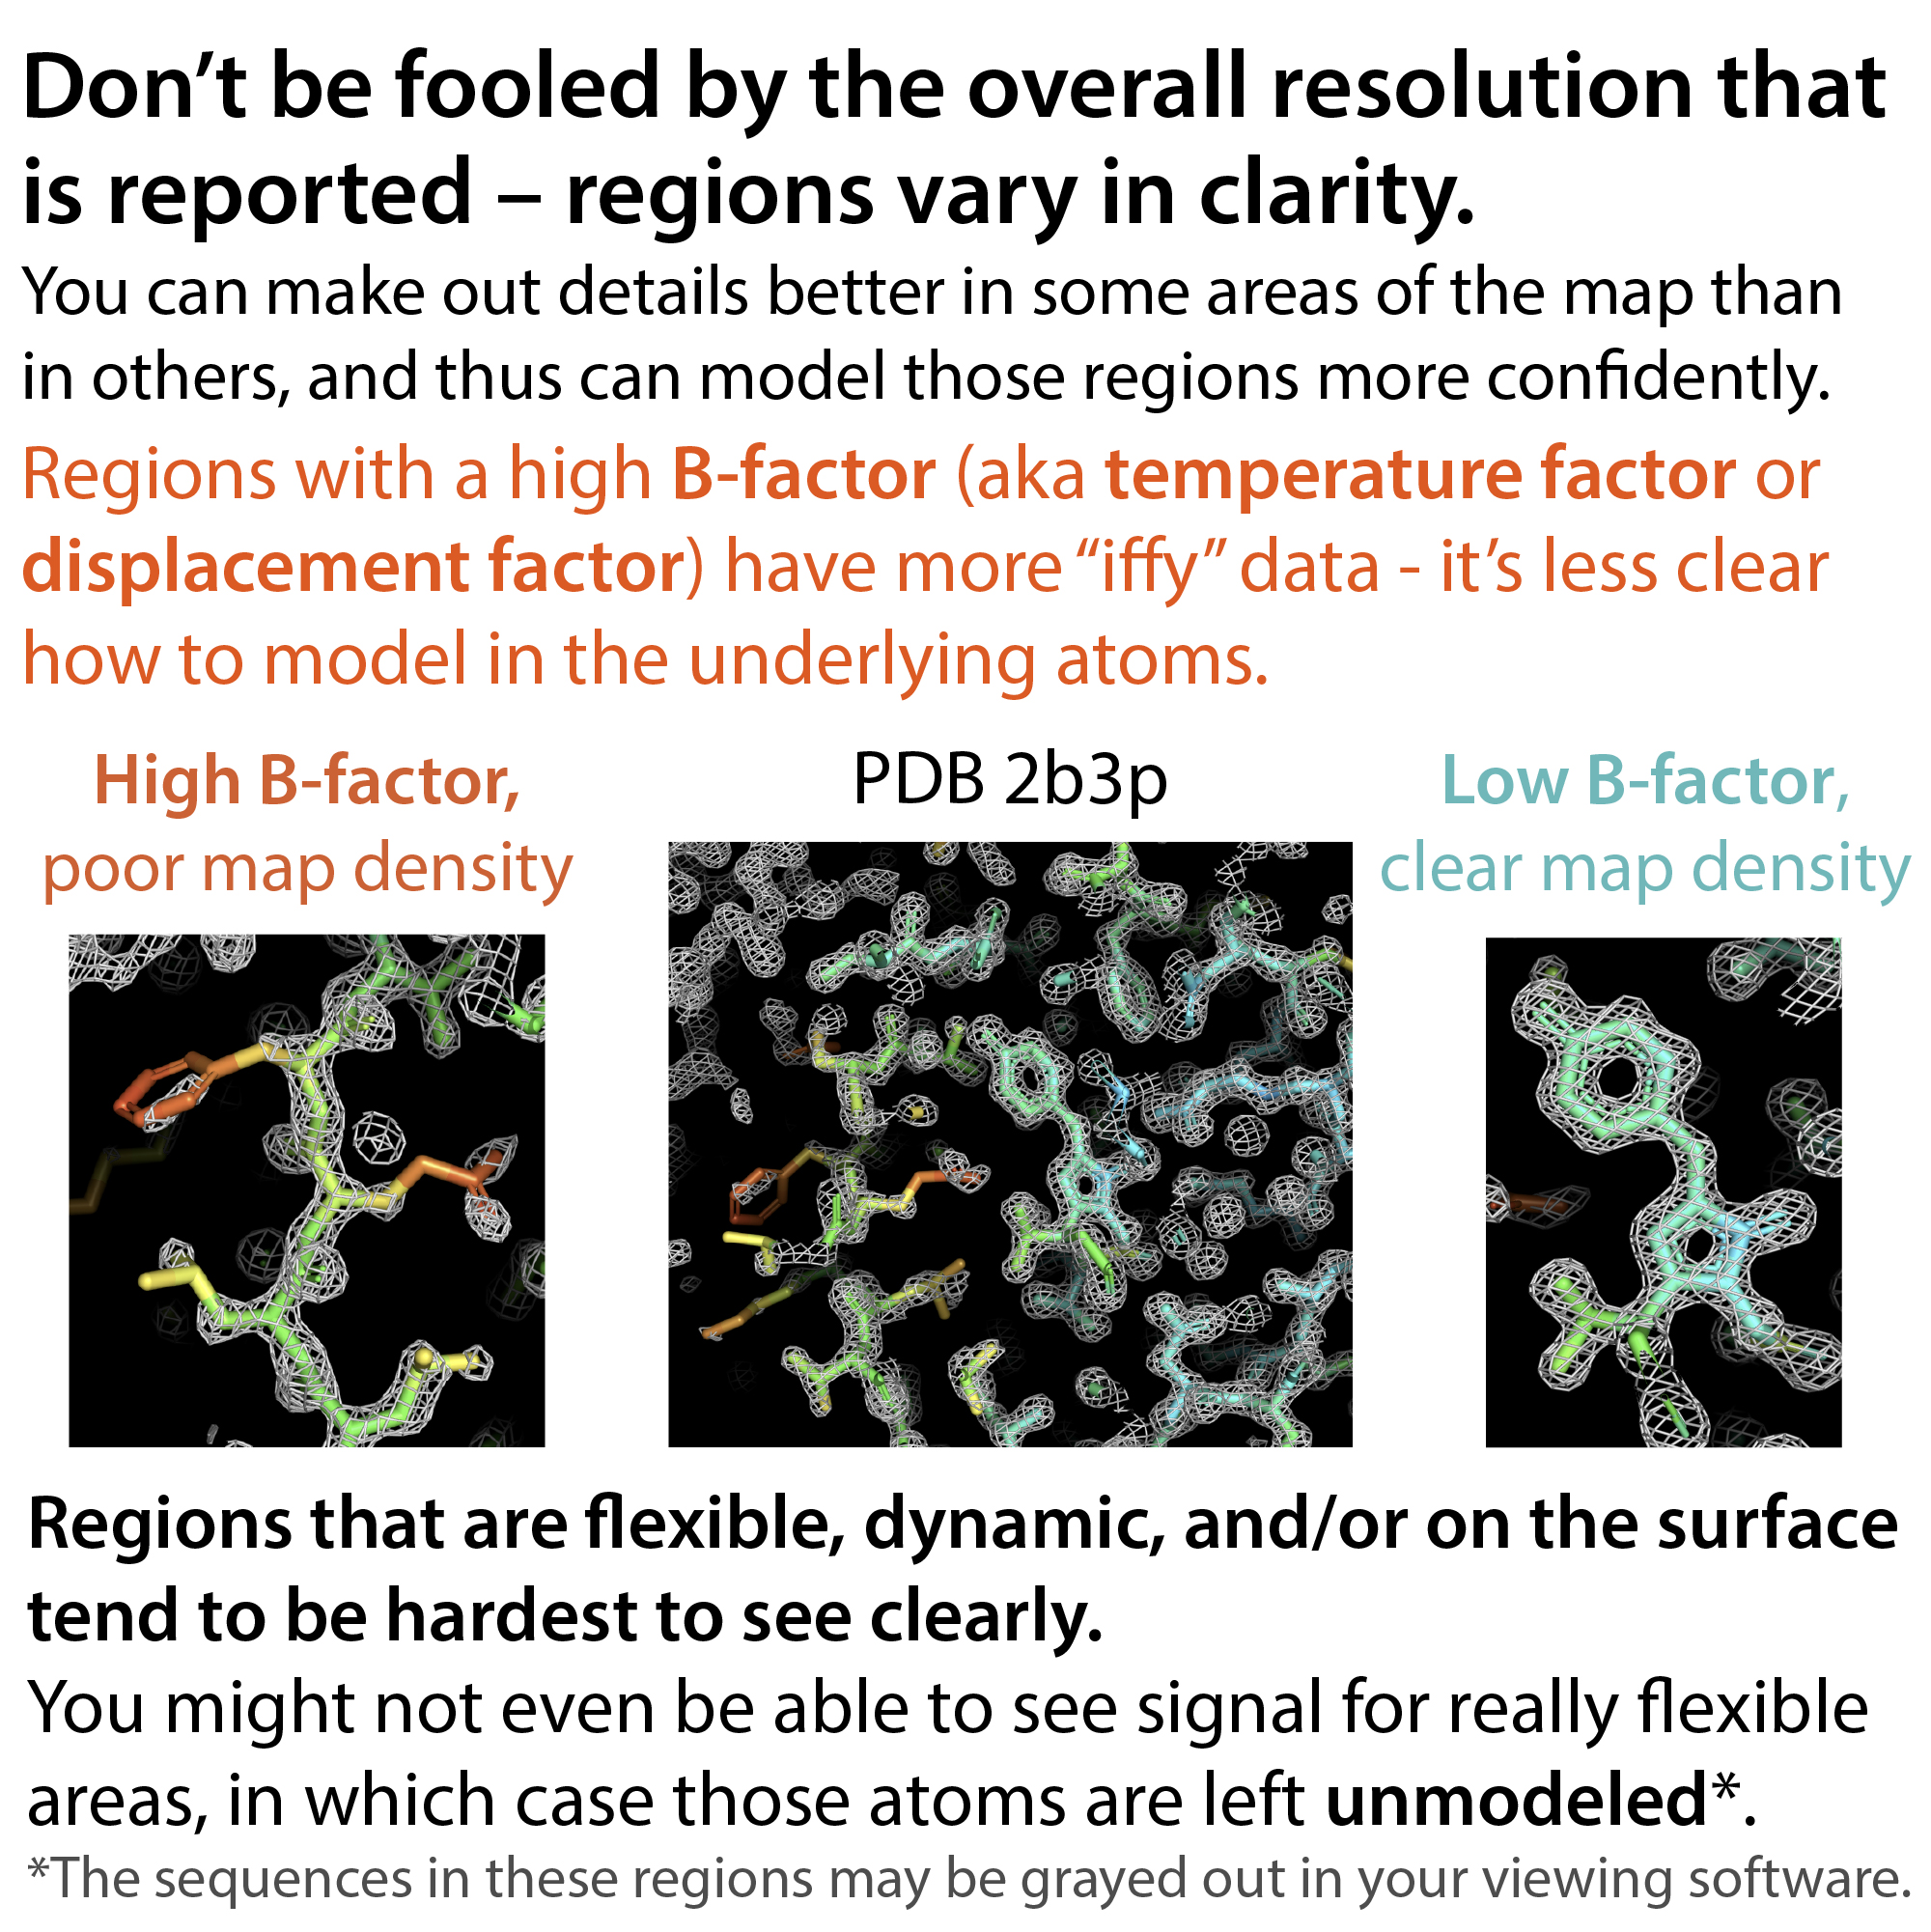
I’ll go into what those values actually mean technically-speaking in a minute, but it’s important before we get too deep that you recognize that those figures only tell you an overall assessment of the fit. Sometimes you want to look in more detail at a specific region you’re interested in, and there, looking at the density maps can help, as well as clicking on the “3D report” to see where potential problems are on the structure. And if you click on the validation report, you can download an-depth report with a lot more details. You can also look at something called a B-factor which can tell you about how reliable the pinpointed position in the model is likely to be. You can set the PDB to color based on uncertainty/disorder if you want to see that.
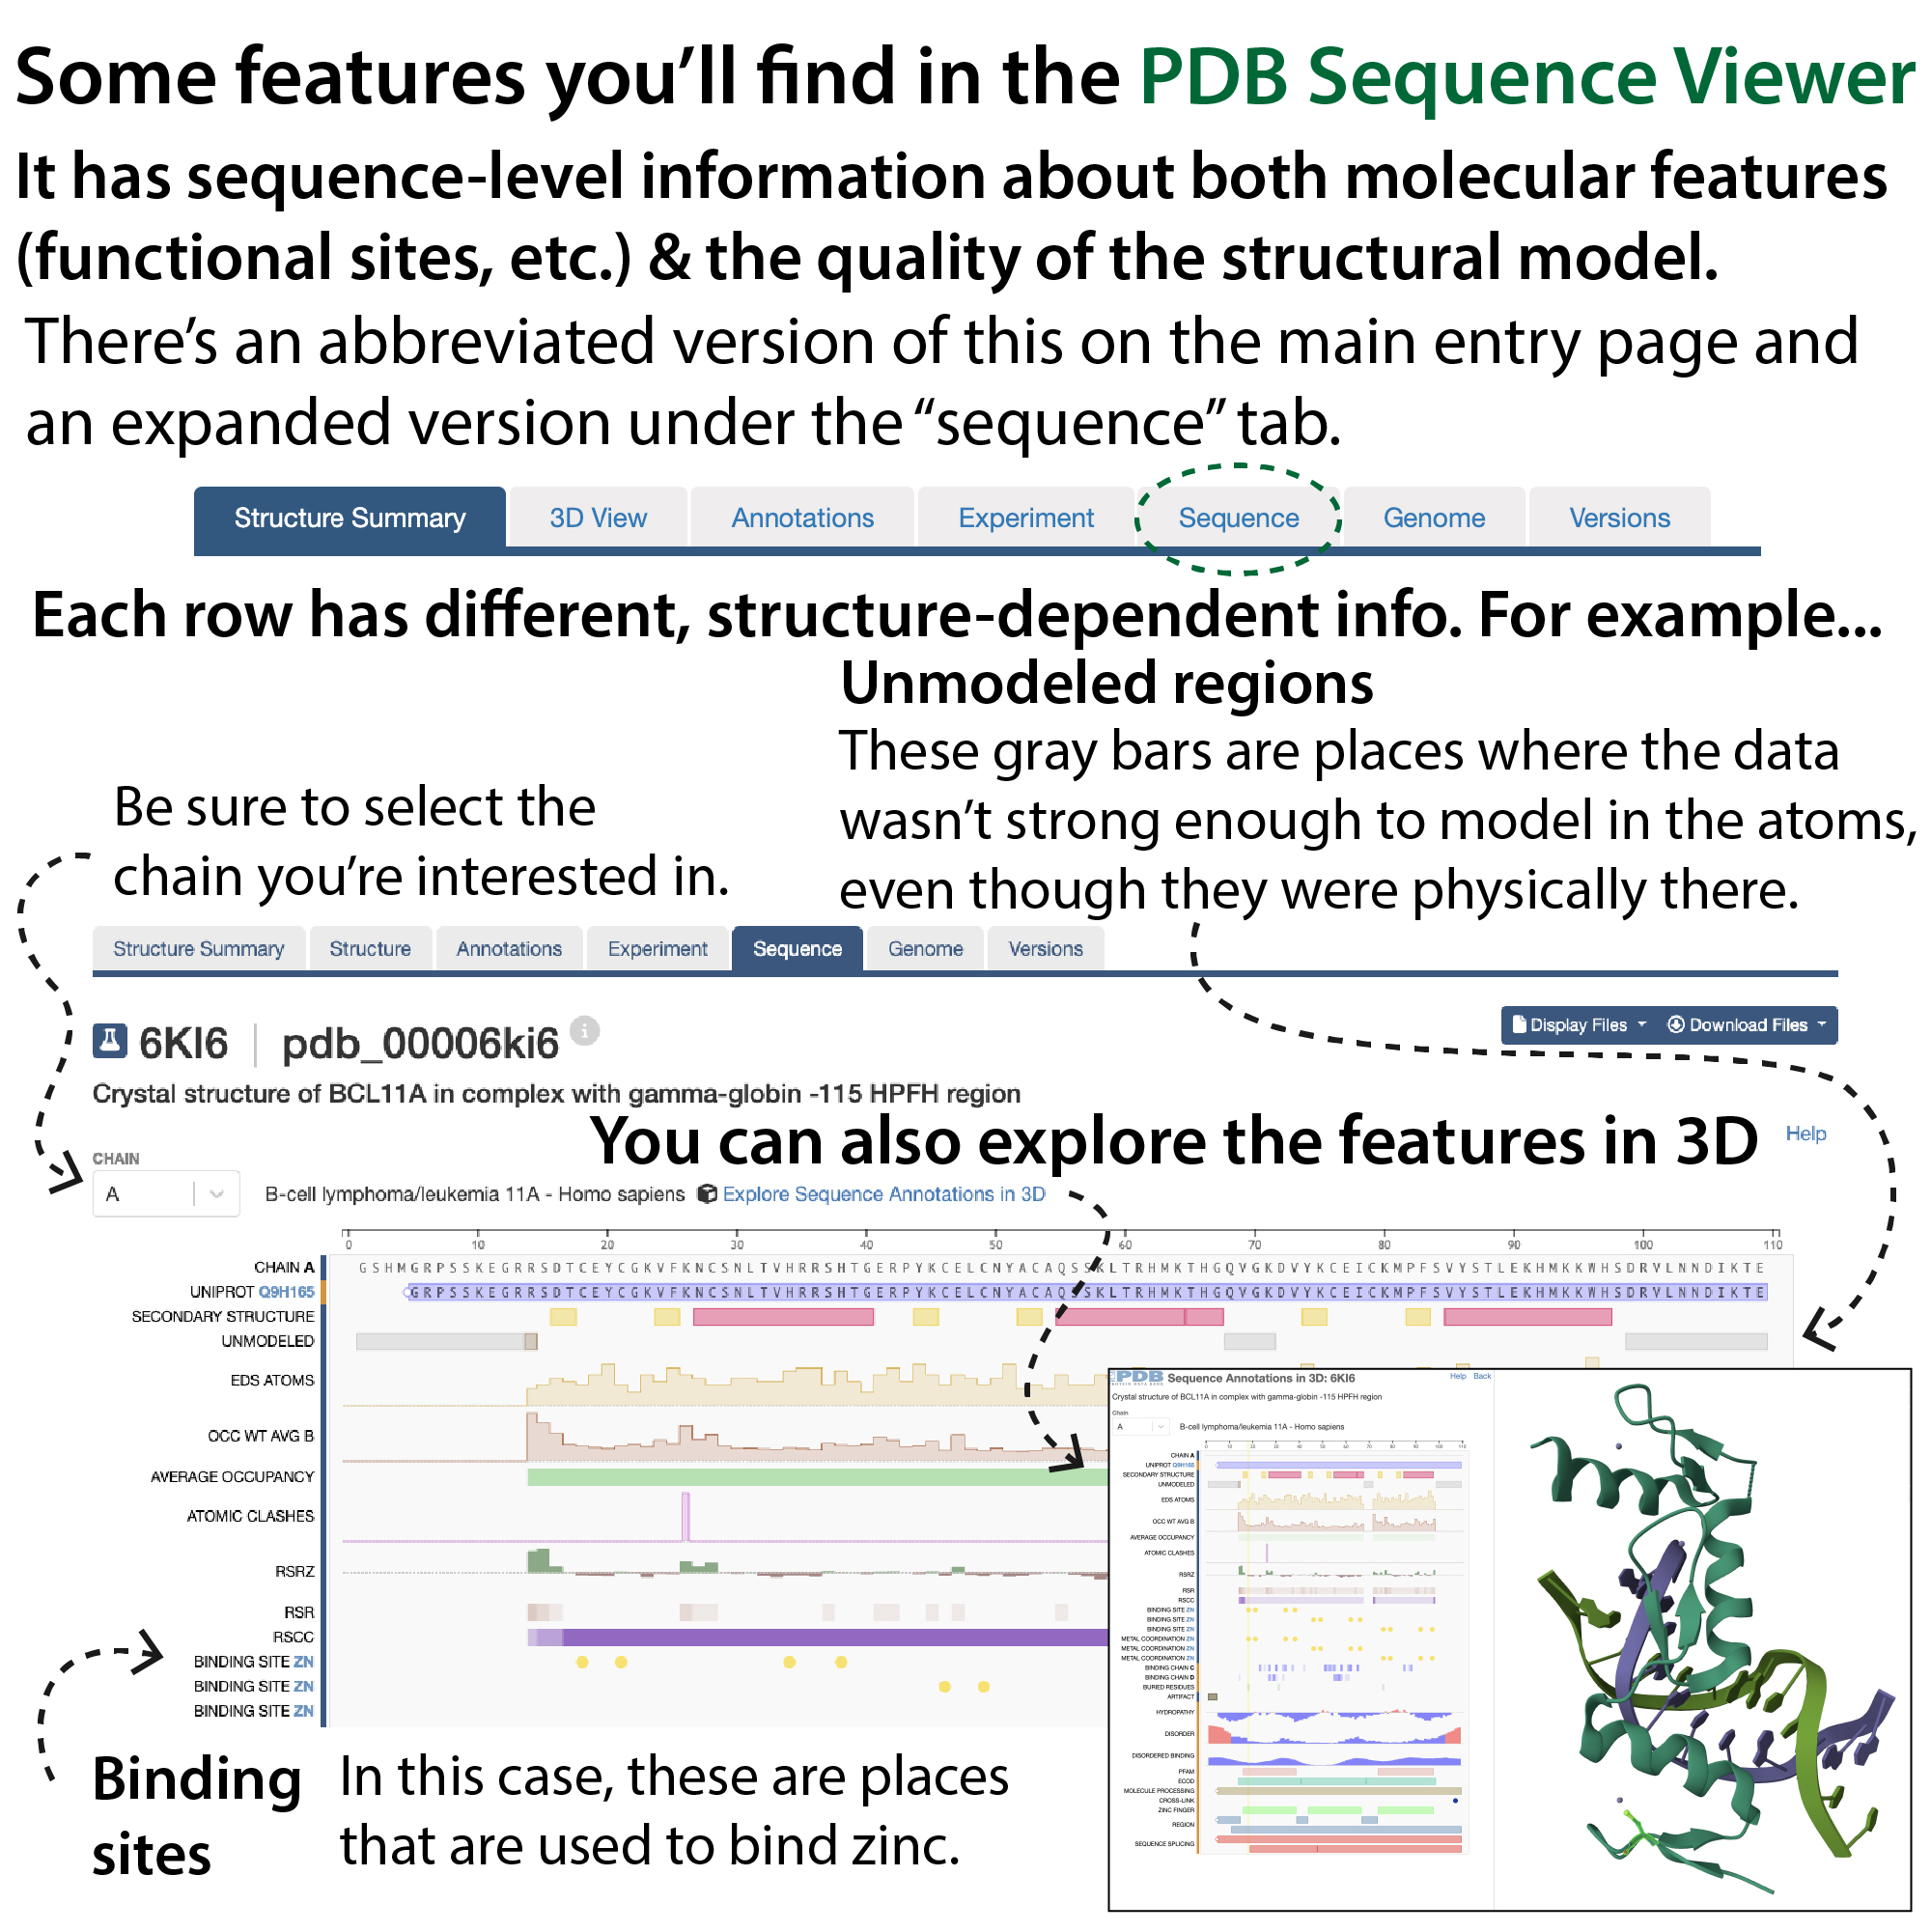
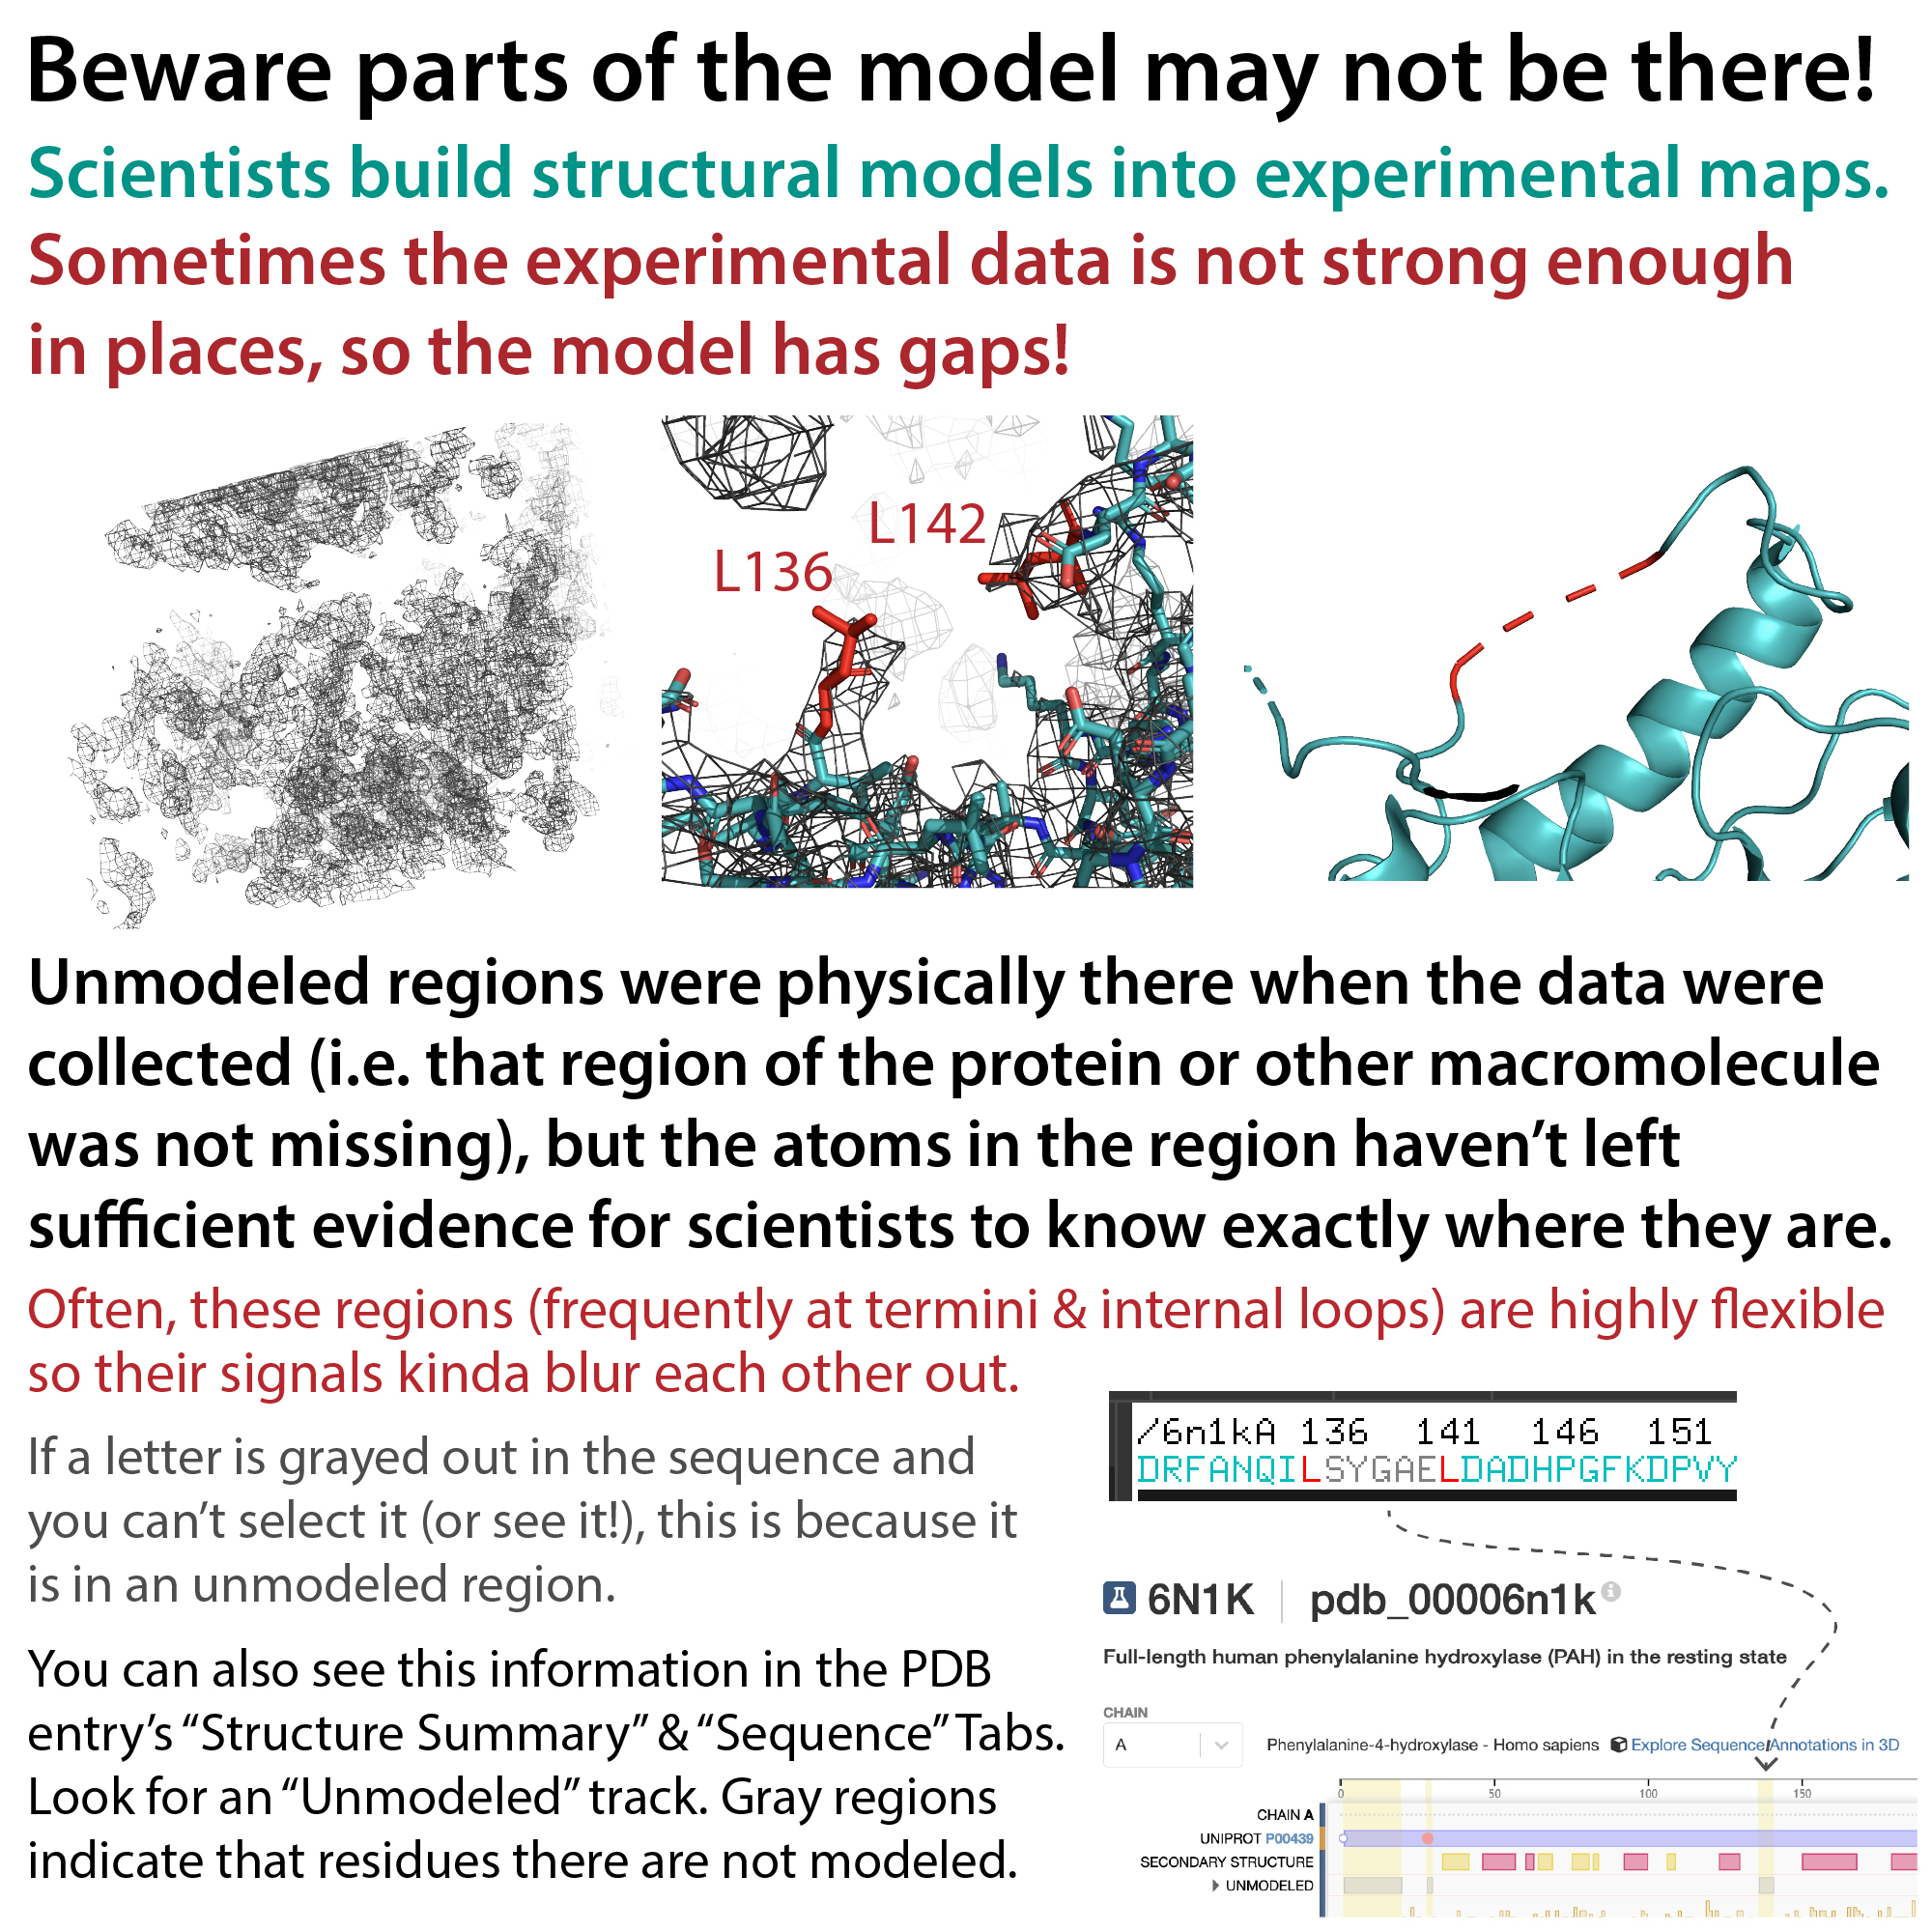
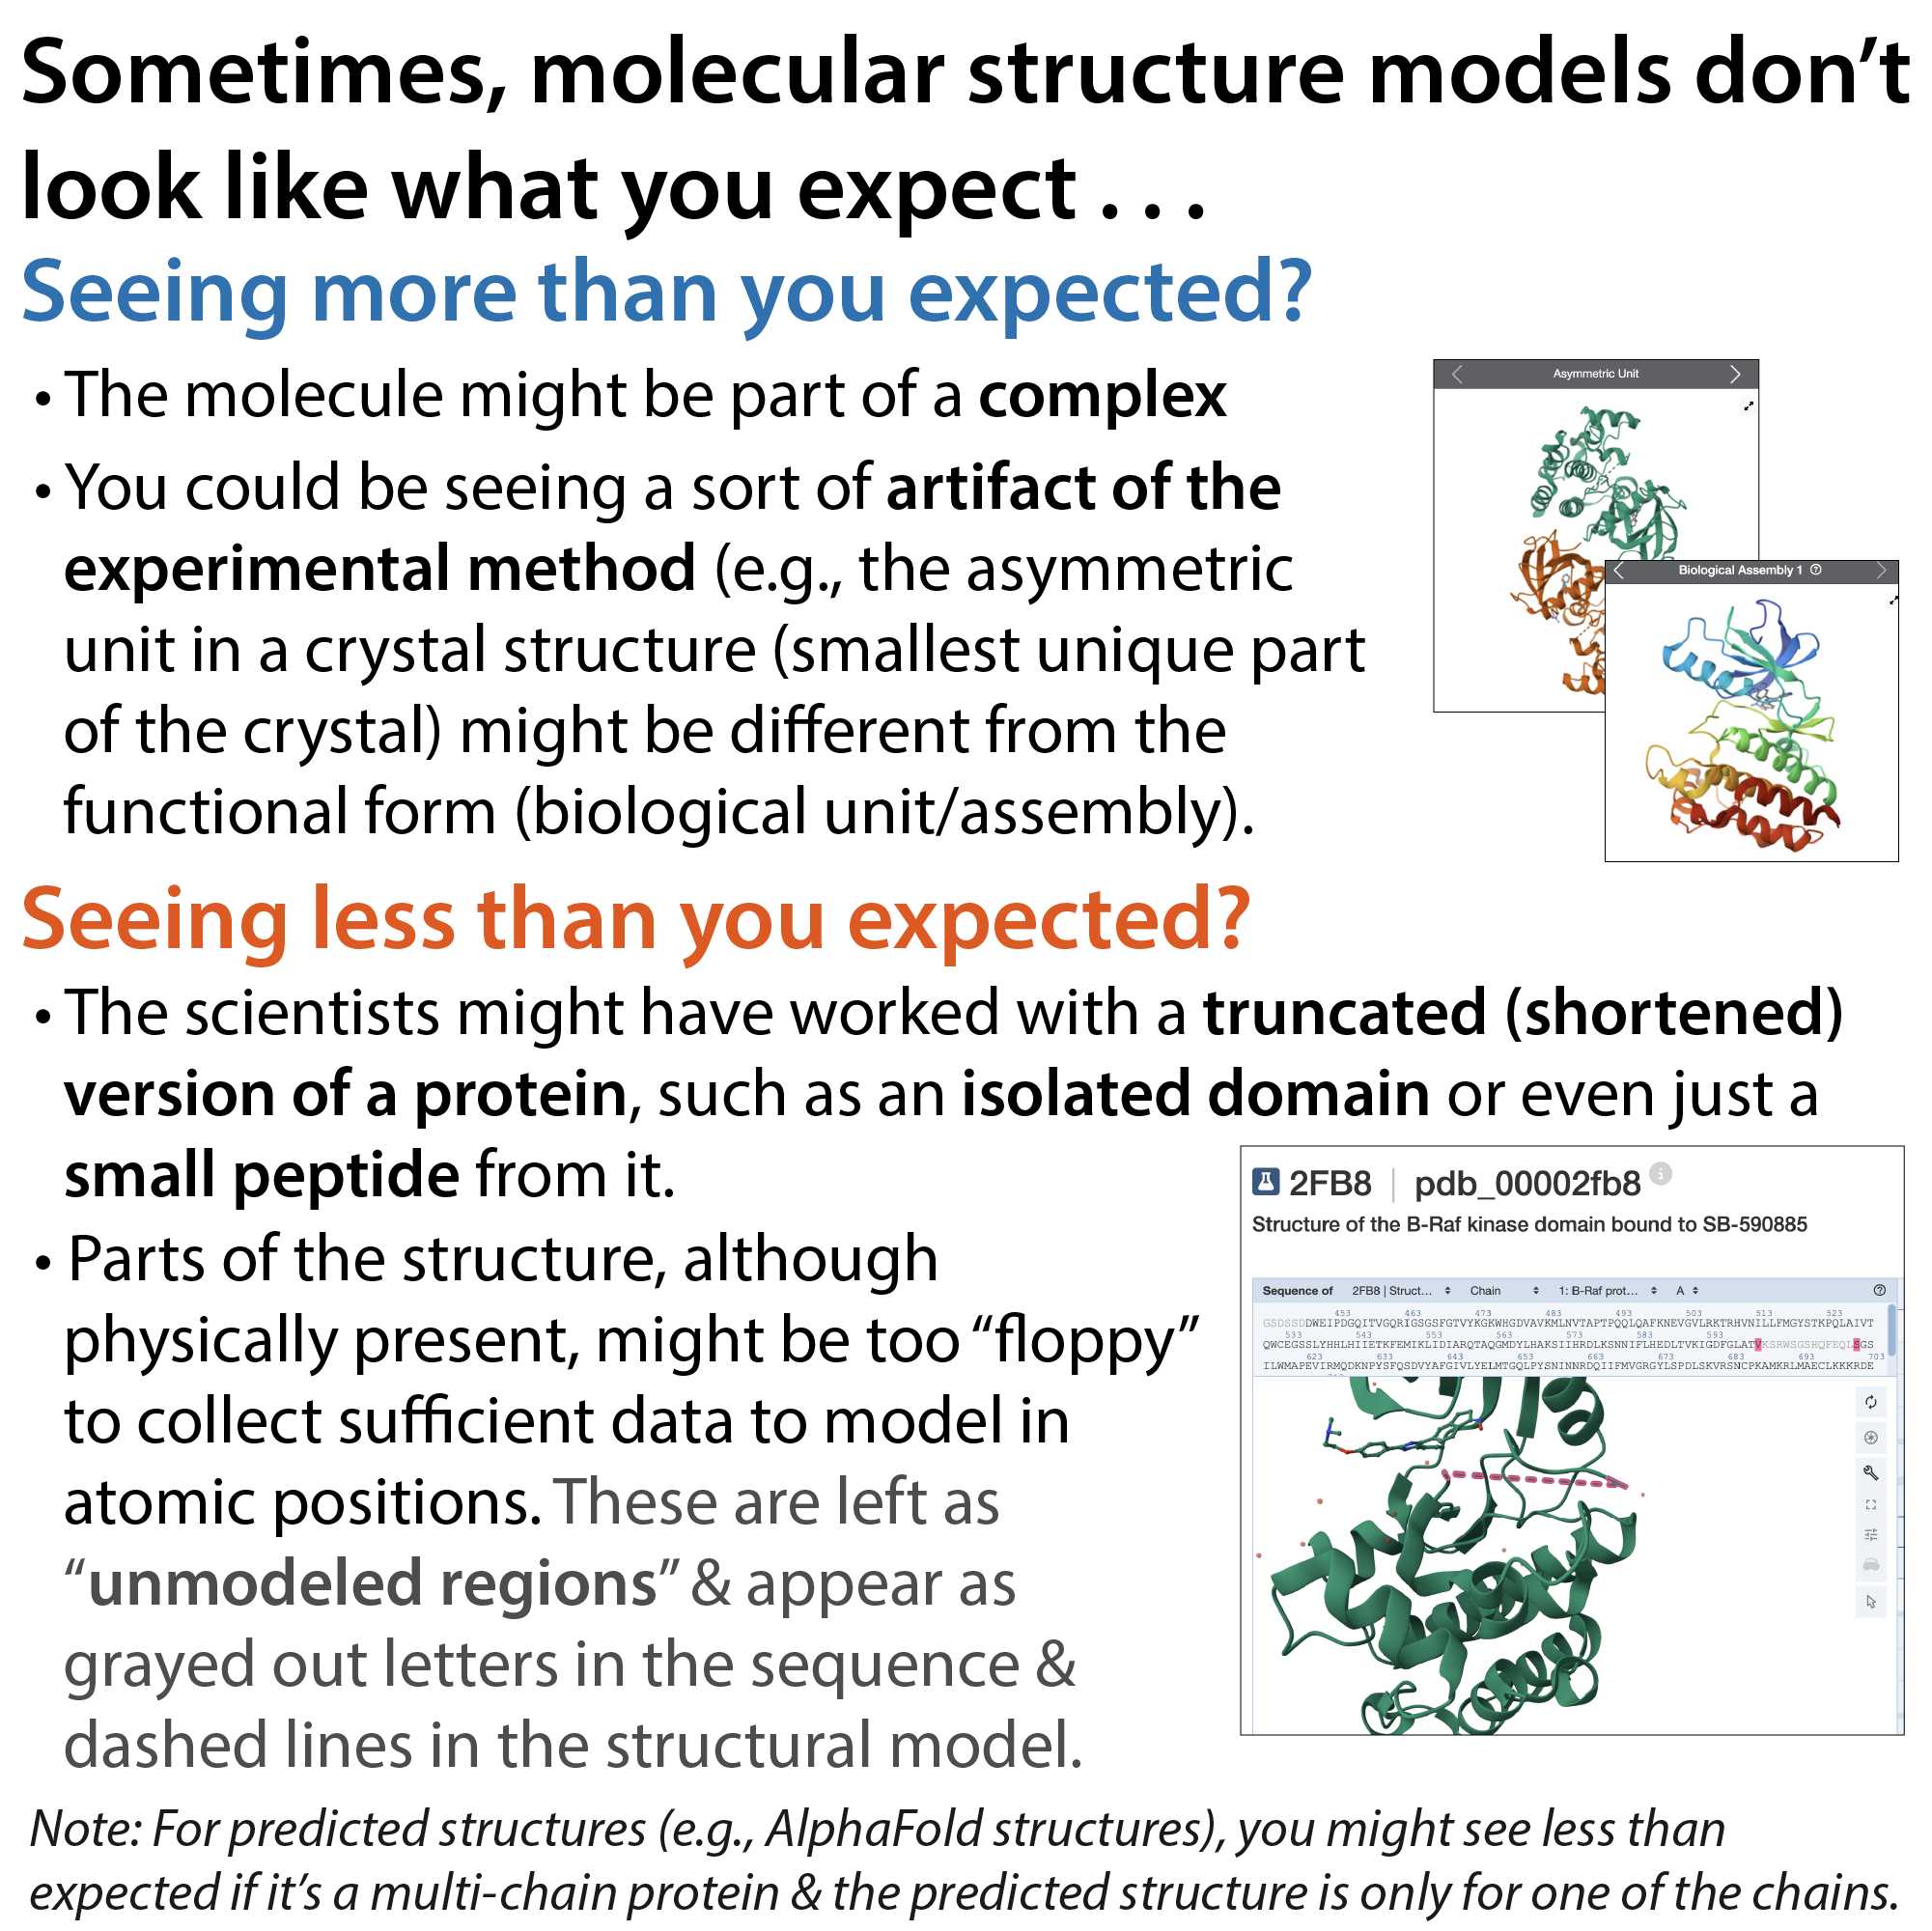
Also, be aware that sometimes there are “unmodeled regions” – these are parts of the structure where the density wasn’t resolvable. These regions often correspond to flexible or dynamic regions of the protein that didn’t like to sit still for the X-ray beam, so their signals kinda canceled each other out and there wasn’t enough blobby stuff there to try to fit atoms into. It’s not really like this at the technical level, but you can think of it a bit like taking a picture of someone waving their hand – you can see most of the person fine, but the waving hand is too blurry to make out. With unmodeled regions, you have a similar thing – you can see most of the protein but not some parts, even though those parts are physically there.
Sometimes, however, there will be parts that aren’t in the model that aren’t there because they were physically taken out of the protein – scientists will often intentionally make mutations to proteins like chopping off regions that are predicted to be disordered or changing some residues in order to try to get them to crystallize better.
You can find this information in the “Sequence Annotations,” section, which you can access an abbreviated version if you scroll down on the main entry page in RCSB or, with more detail, under the “Sequence” tab (which can also be reached by expanding the abbreviated version from the main page).
Note that they also show a lot of various things, including some residue-level quality indicators, and you can click on the “Explore Sequence Annotations in 3D” button to see the annotations mapped to the 3D structure.
Now, a bit more about the individual parameters:
When crystallographers build a structural model based on experimental data, they do so using most, but not all, of their experimental data. They leave out a portion of their data (~10%) when building the model, and then, once they build the model, they go back to that unused data and see how well the model fits that data that wasn’t originally included. This helps ensure that they didn’t “overfit” their data and/or make errors in their model.
To help you see what I mean, imagine that you’re listening to the same song over and over and during one of the times the song’s playing, there was a fire alarm going off. If you were to try to recreate the song using the average of a bunch of times you heard the song, your model may have evidence of the fire alarm which isn’t part of the actual song. Similarly, it’s possible to fit artifacts and noise into a model.
Such overfitting can be detected by comparing the Rwork (which doesn’t include the left-out data) to the Rfree (which only includes the left-out data). The Rfree will typically be ~0.05 or so higher than the Rwork (that is, the model doesn’t fit the left-out data quite as well as the data that was used to build the model) but it shouldn’t be significantly higher. If it is significantly higher, the model may have been overfitted and/or the model has errors.
Quality measurements for the model:
Overall:
- R factor: a measure of how well the structural model fits the experimental evidence
- Rwork: a measure of how well the structural model fits the experimental evidence used to generate the model. You want this value to be low, typically ~0.2
- Rfree: a measure of how well the structural model fits experimental evidence not used to generate the model
- The Rfree will typically be ~0.05 or so higher than the Rwork (that is, the model doesn’t fit the left-out data quite as well as the data that was used to build the model) but it shouldn’t be significantly higher. If it is significantly higher, the model may have been overfitted and/or the model has errors.
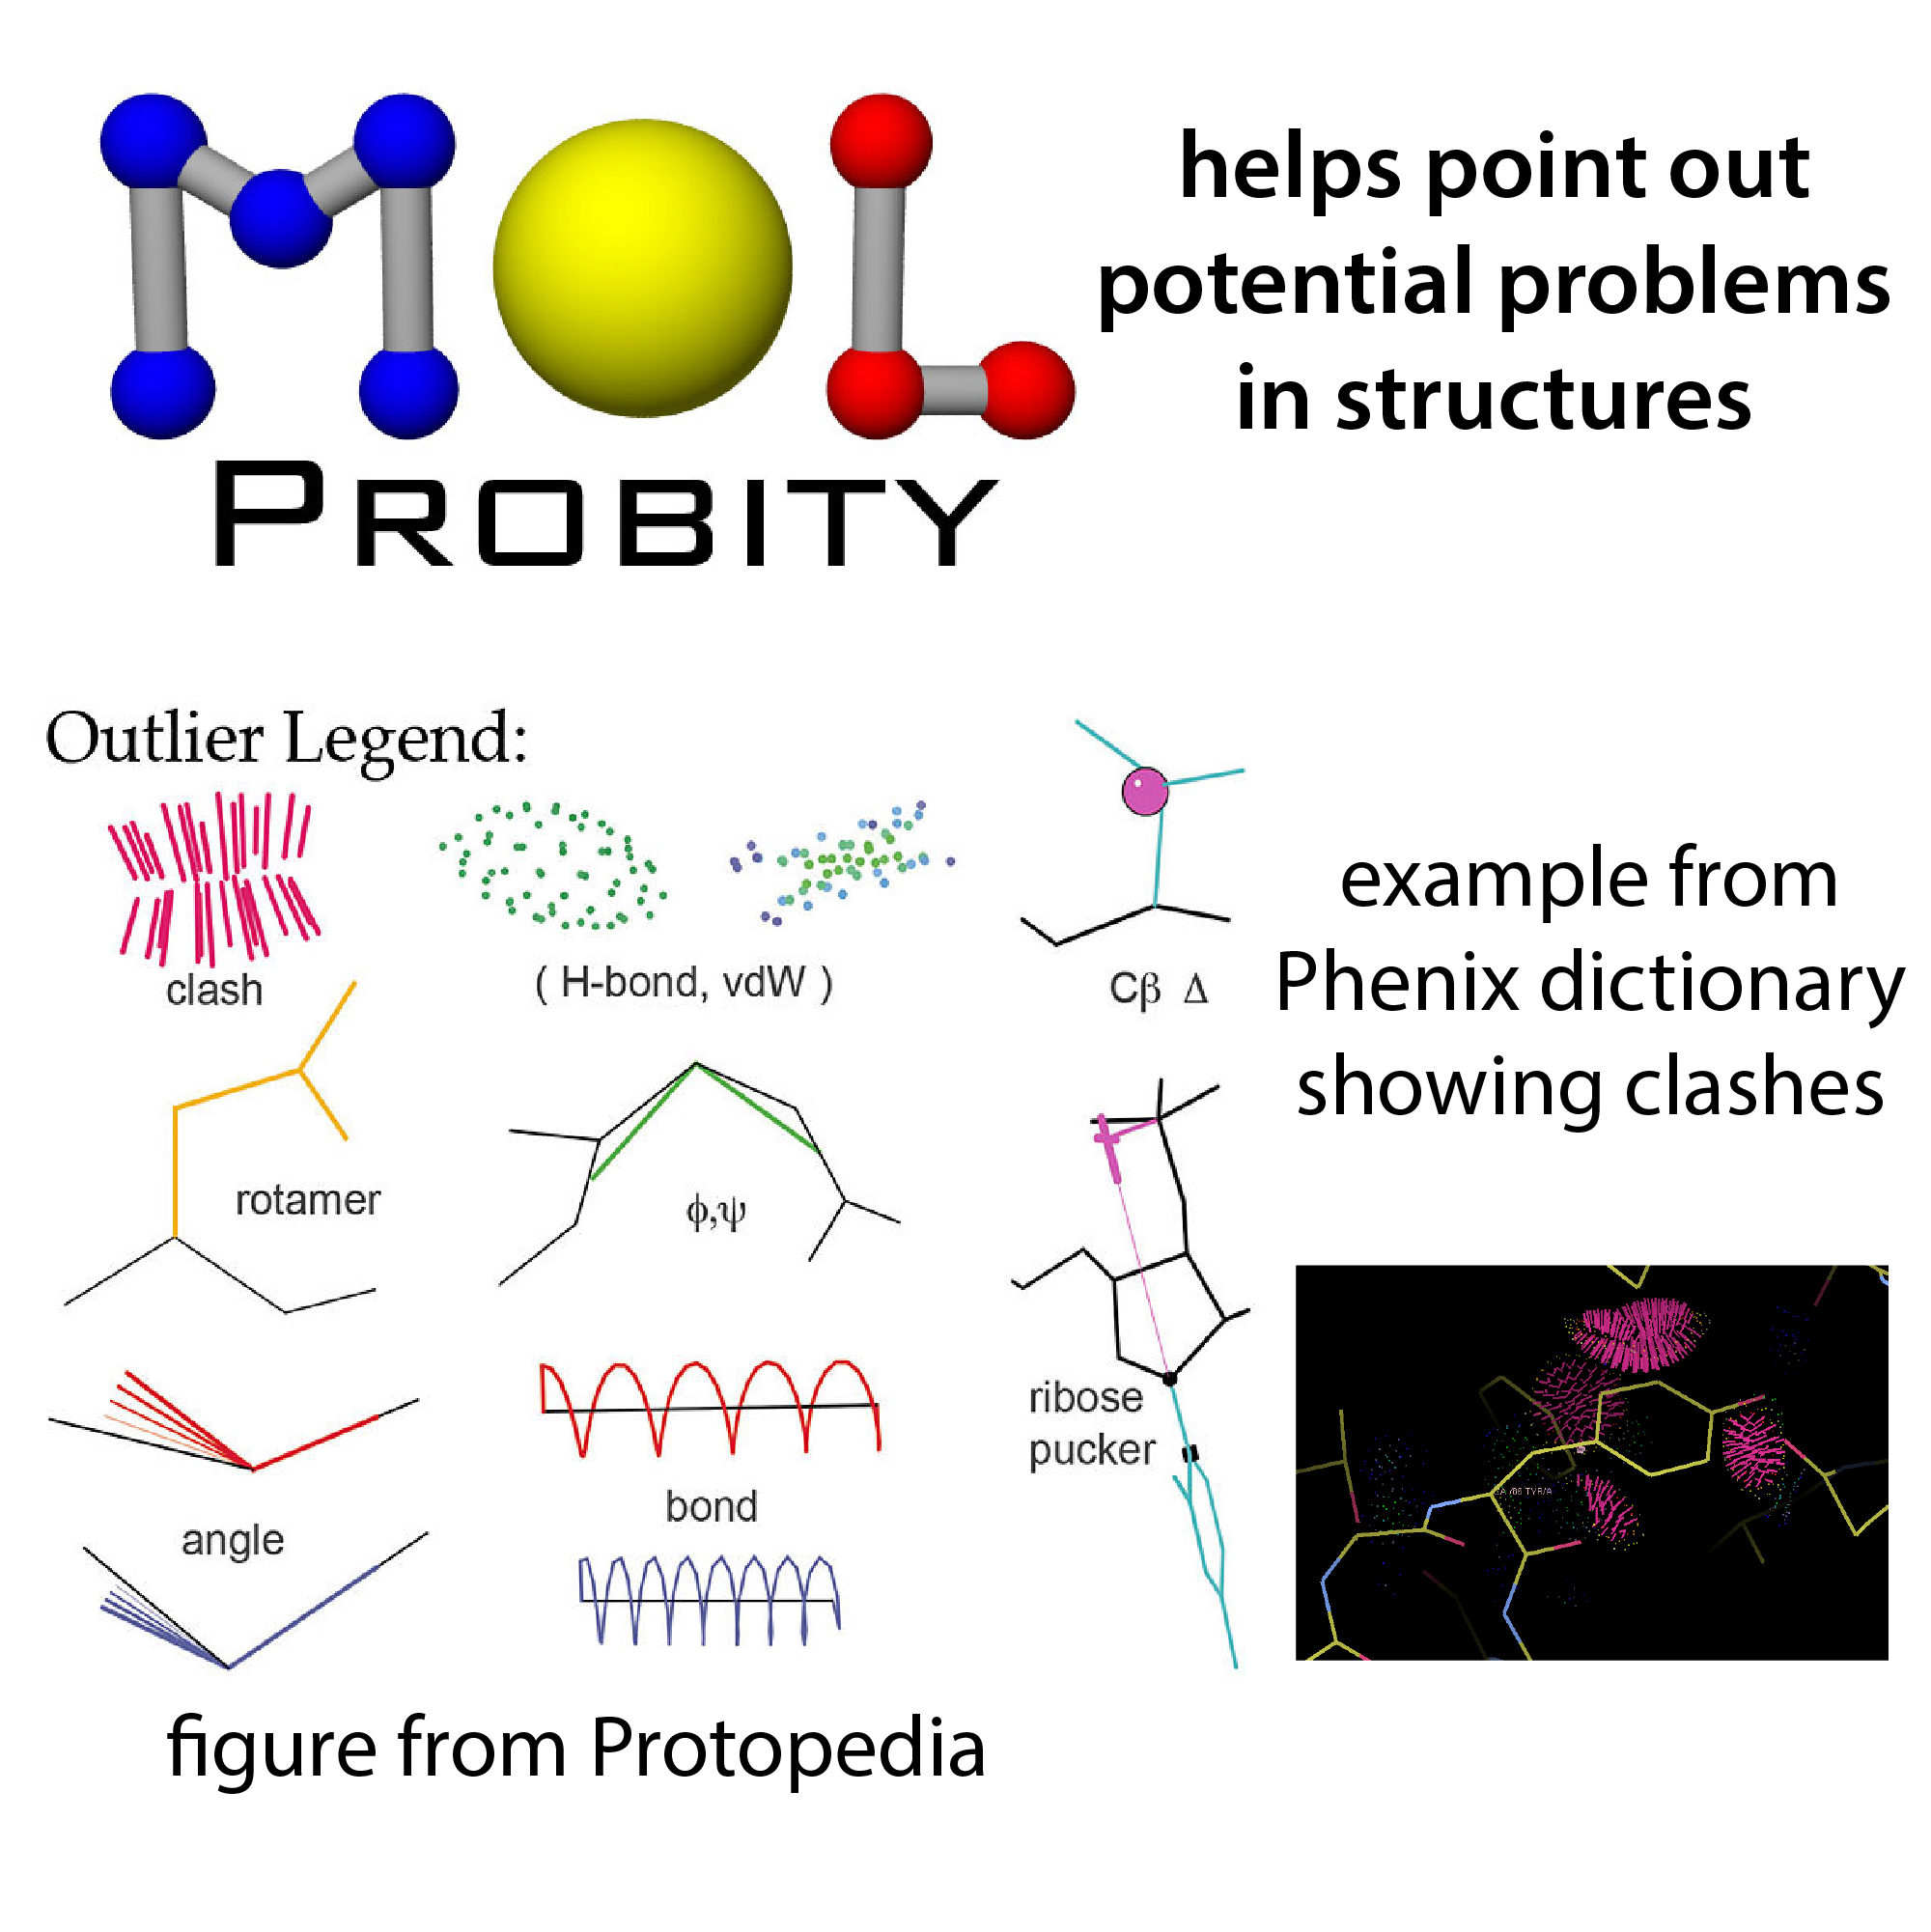
- clashscore: a measure of what proportion of the atoms would physically clash with each other if they’re really where the model says they are – it’s normalized as number of clashes per 1000 atoms so you can compare between structures fairly
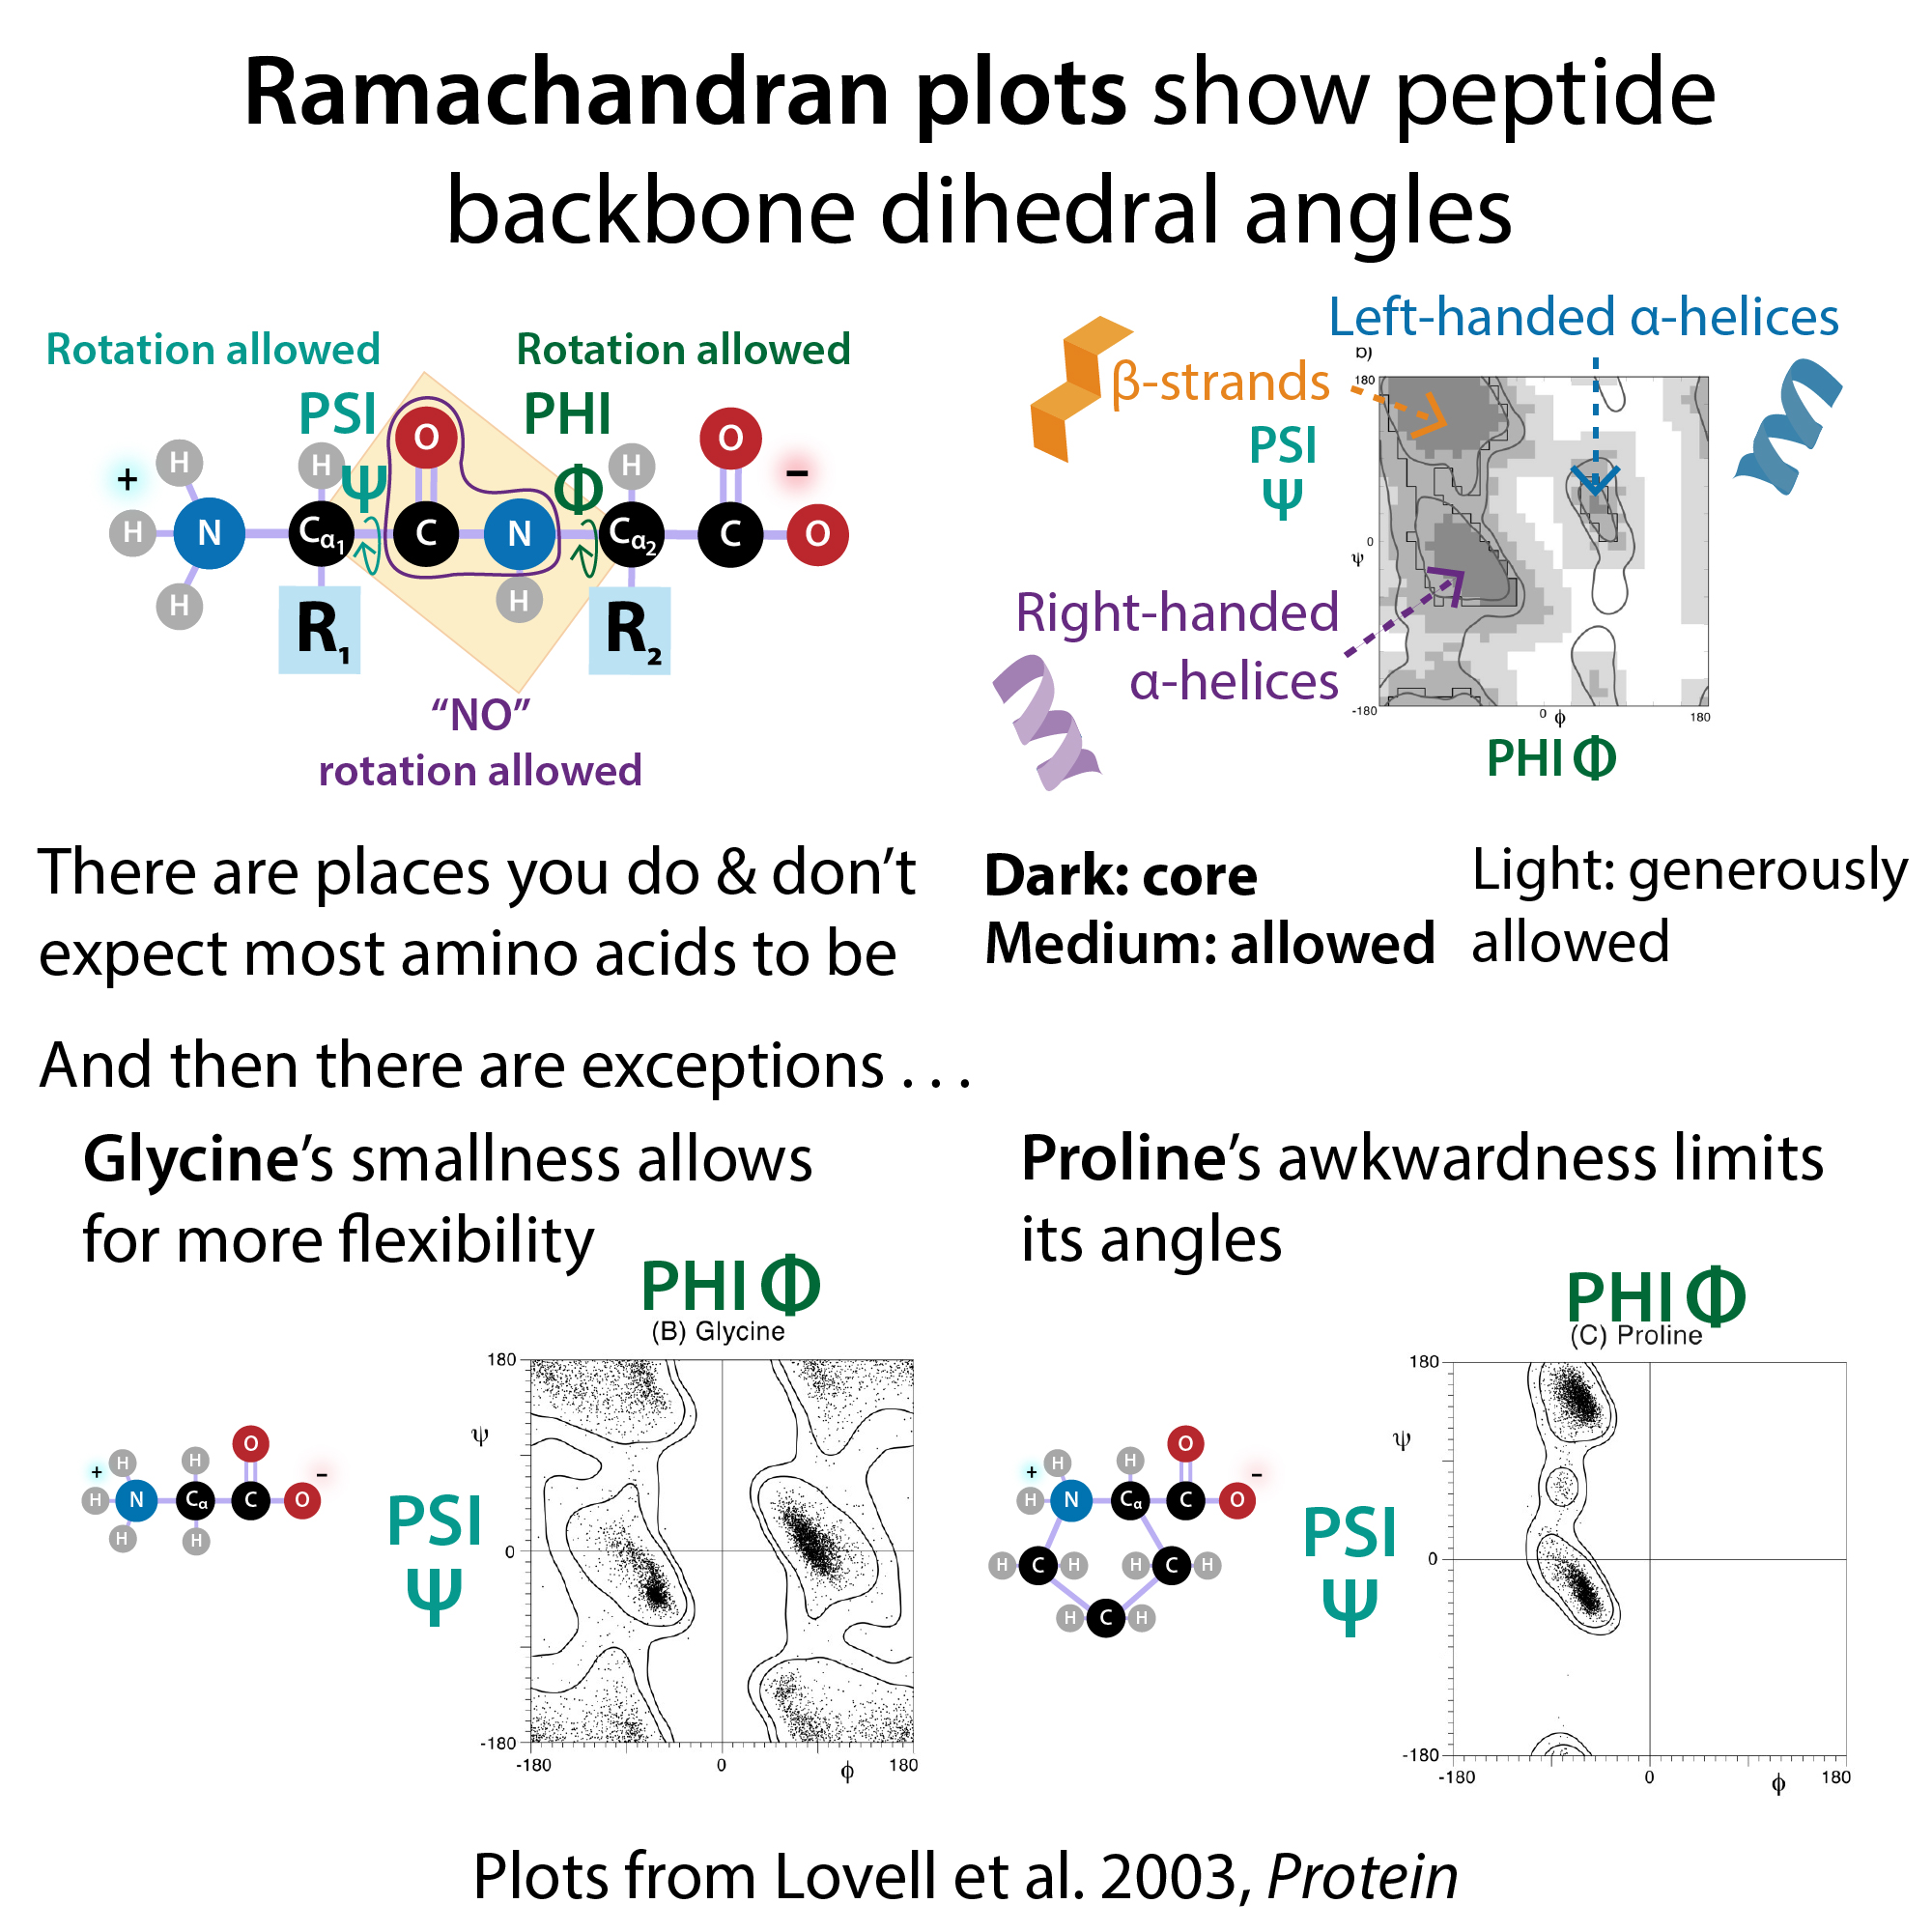
- Ramachandran outliers: a measure of how many non-typical peptide backbone angles there are (reported as a percentage)
- Because different residues have different side chains, and those side chains have different amounts of bulkiness, the flexibility of the protein backbone is more constrained around certain residues. There are particular backbone angles that each residue likes to take, which can be visualized as “allowed zones” on a Ramachandran plot. If you plot the angles in the model, some of them will likely fall outside of their allowed zone, indicating an awkward angle and we call that a Ramachandran outlier.
- Sidechain outliers: a measure of how many non-typical side chain angles there are (reported as a percentage)
- This is similar in concept to the Ramachandran outliers, but here you’re looking at the angles of the side chains instead of the backbone.
- RSRZ outliers: a measure of what percent of individual residues don’t fit the density well (kinda like how many of the stick-y groups in the diagram stick out of the blob they’re supposed to be inside)
- RSR stands for Real Space R-factor and RSR-Z is a normalized RSR that takes resolution and residue identity into account. More below
At the residue and/or atom level:
- Rotamer outlier: A side chain is in a conformation that’s not frequently observed
- Bond outlier – length or angle: A modeled bond is shorter or longer than normally observed and/or has an angle greater or larger than normally observed
- This is typically determined through a suspicious Z score, which compares the observed value to the expected or average value and divides by standard deviation and statistical stuff like that (better explained in the wwPDB validation guide). Bottom line, if it’s greater than 5 or less than -5 it gets flagged.
- Occupancy: is there evidence that thing is there “all the time”? Is a ligand present in all the copies? How frequently is a side chain in one rotamer vs. another
- RSR (Real Space R factor): How well does the modeled part of a model (e.g., an amino acid residue) fit the electron density (want this value to be low).
- RSR-Z: Normalized RSR that takes resolution and residue type into account (want this value to be < 2)
- RSCC: Real Space Correlation Coefficient – how well does the modeled residue or atom fit the electron density (want this to be close to 1 (perfect match))
Underlying data quality:
Any method:
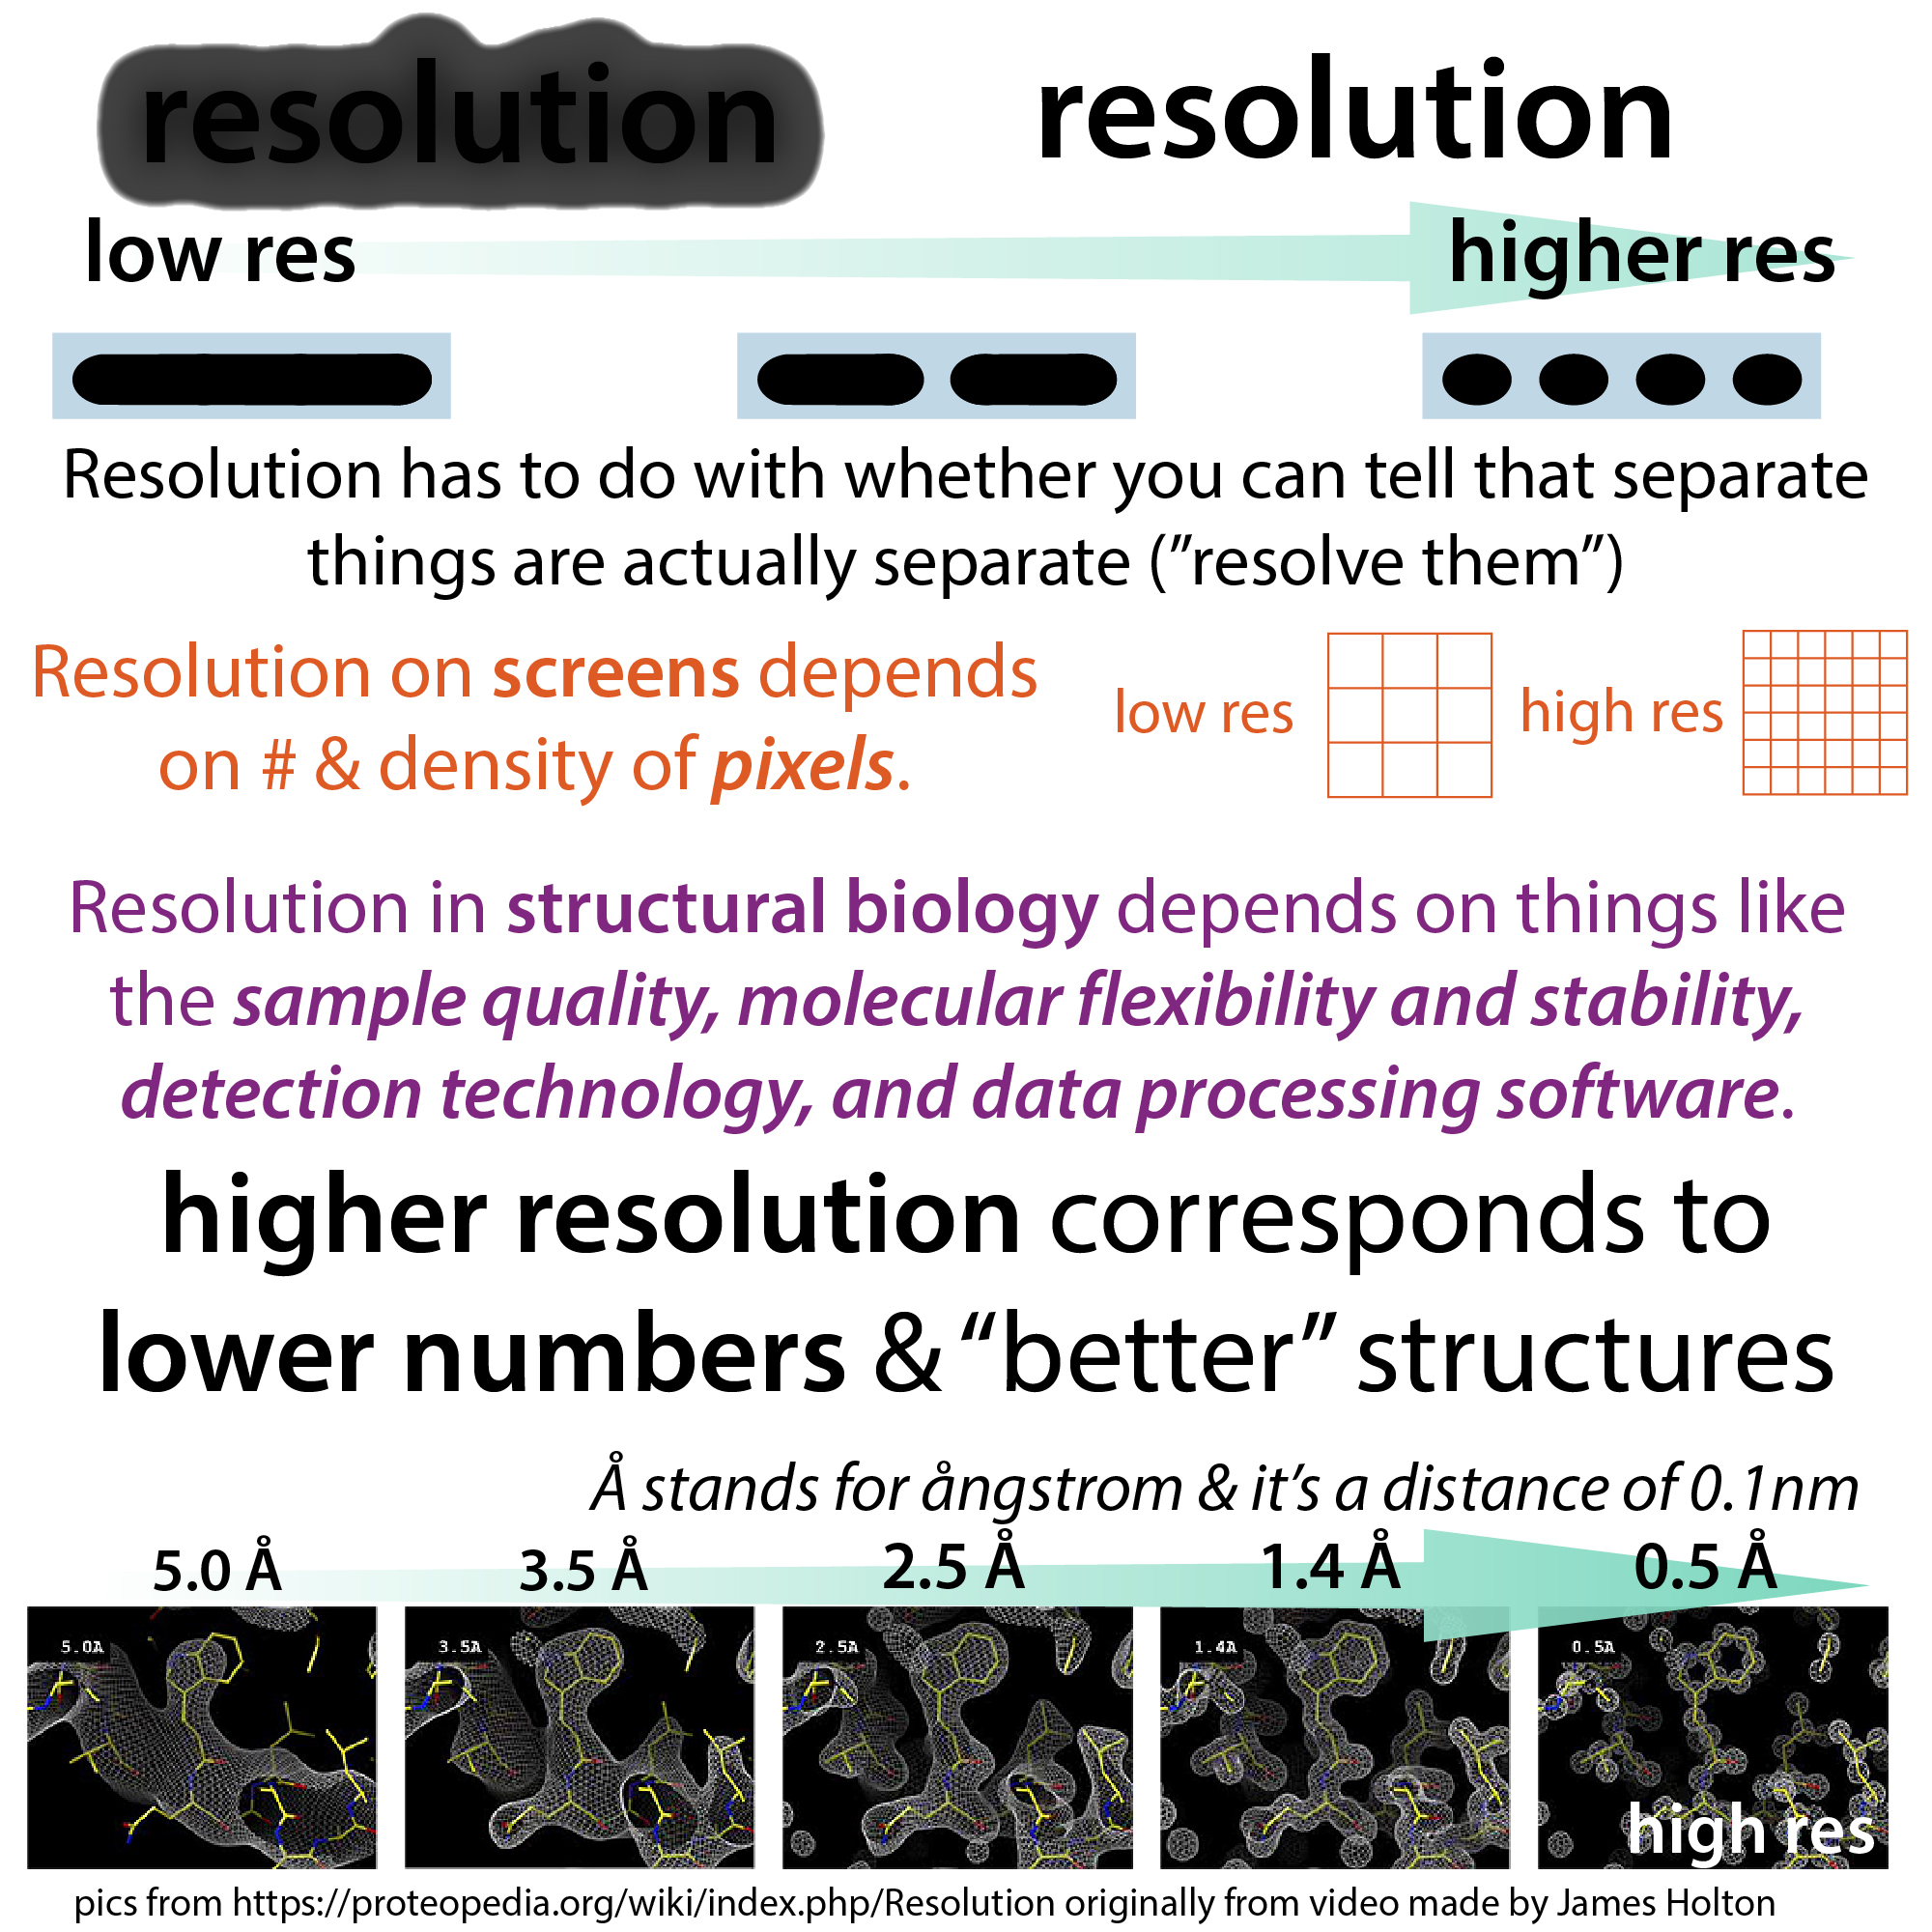
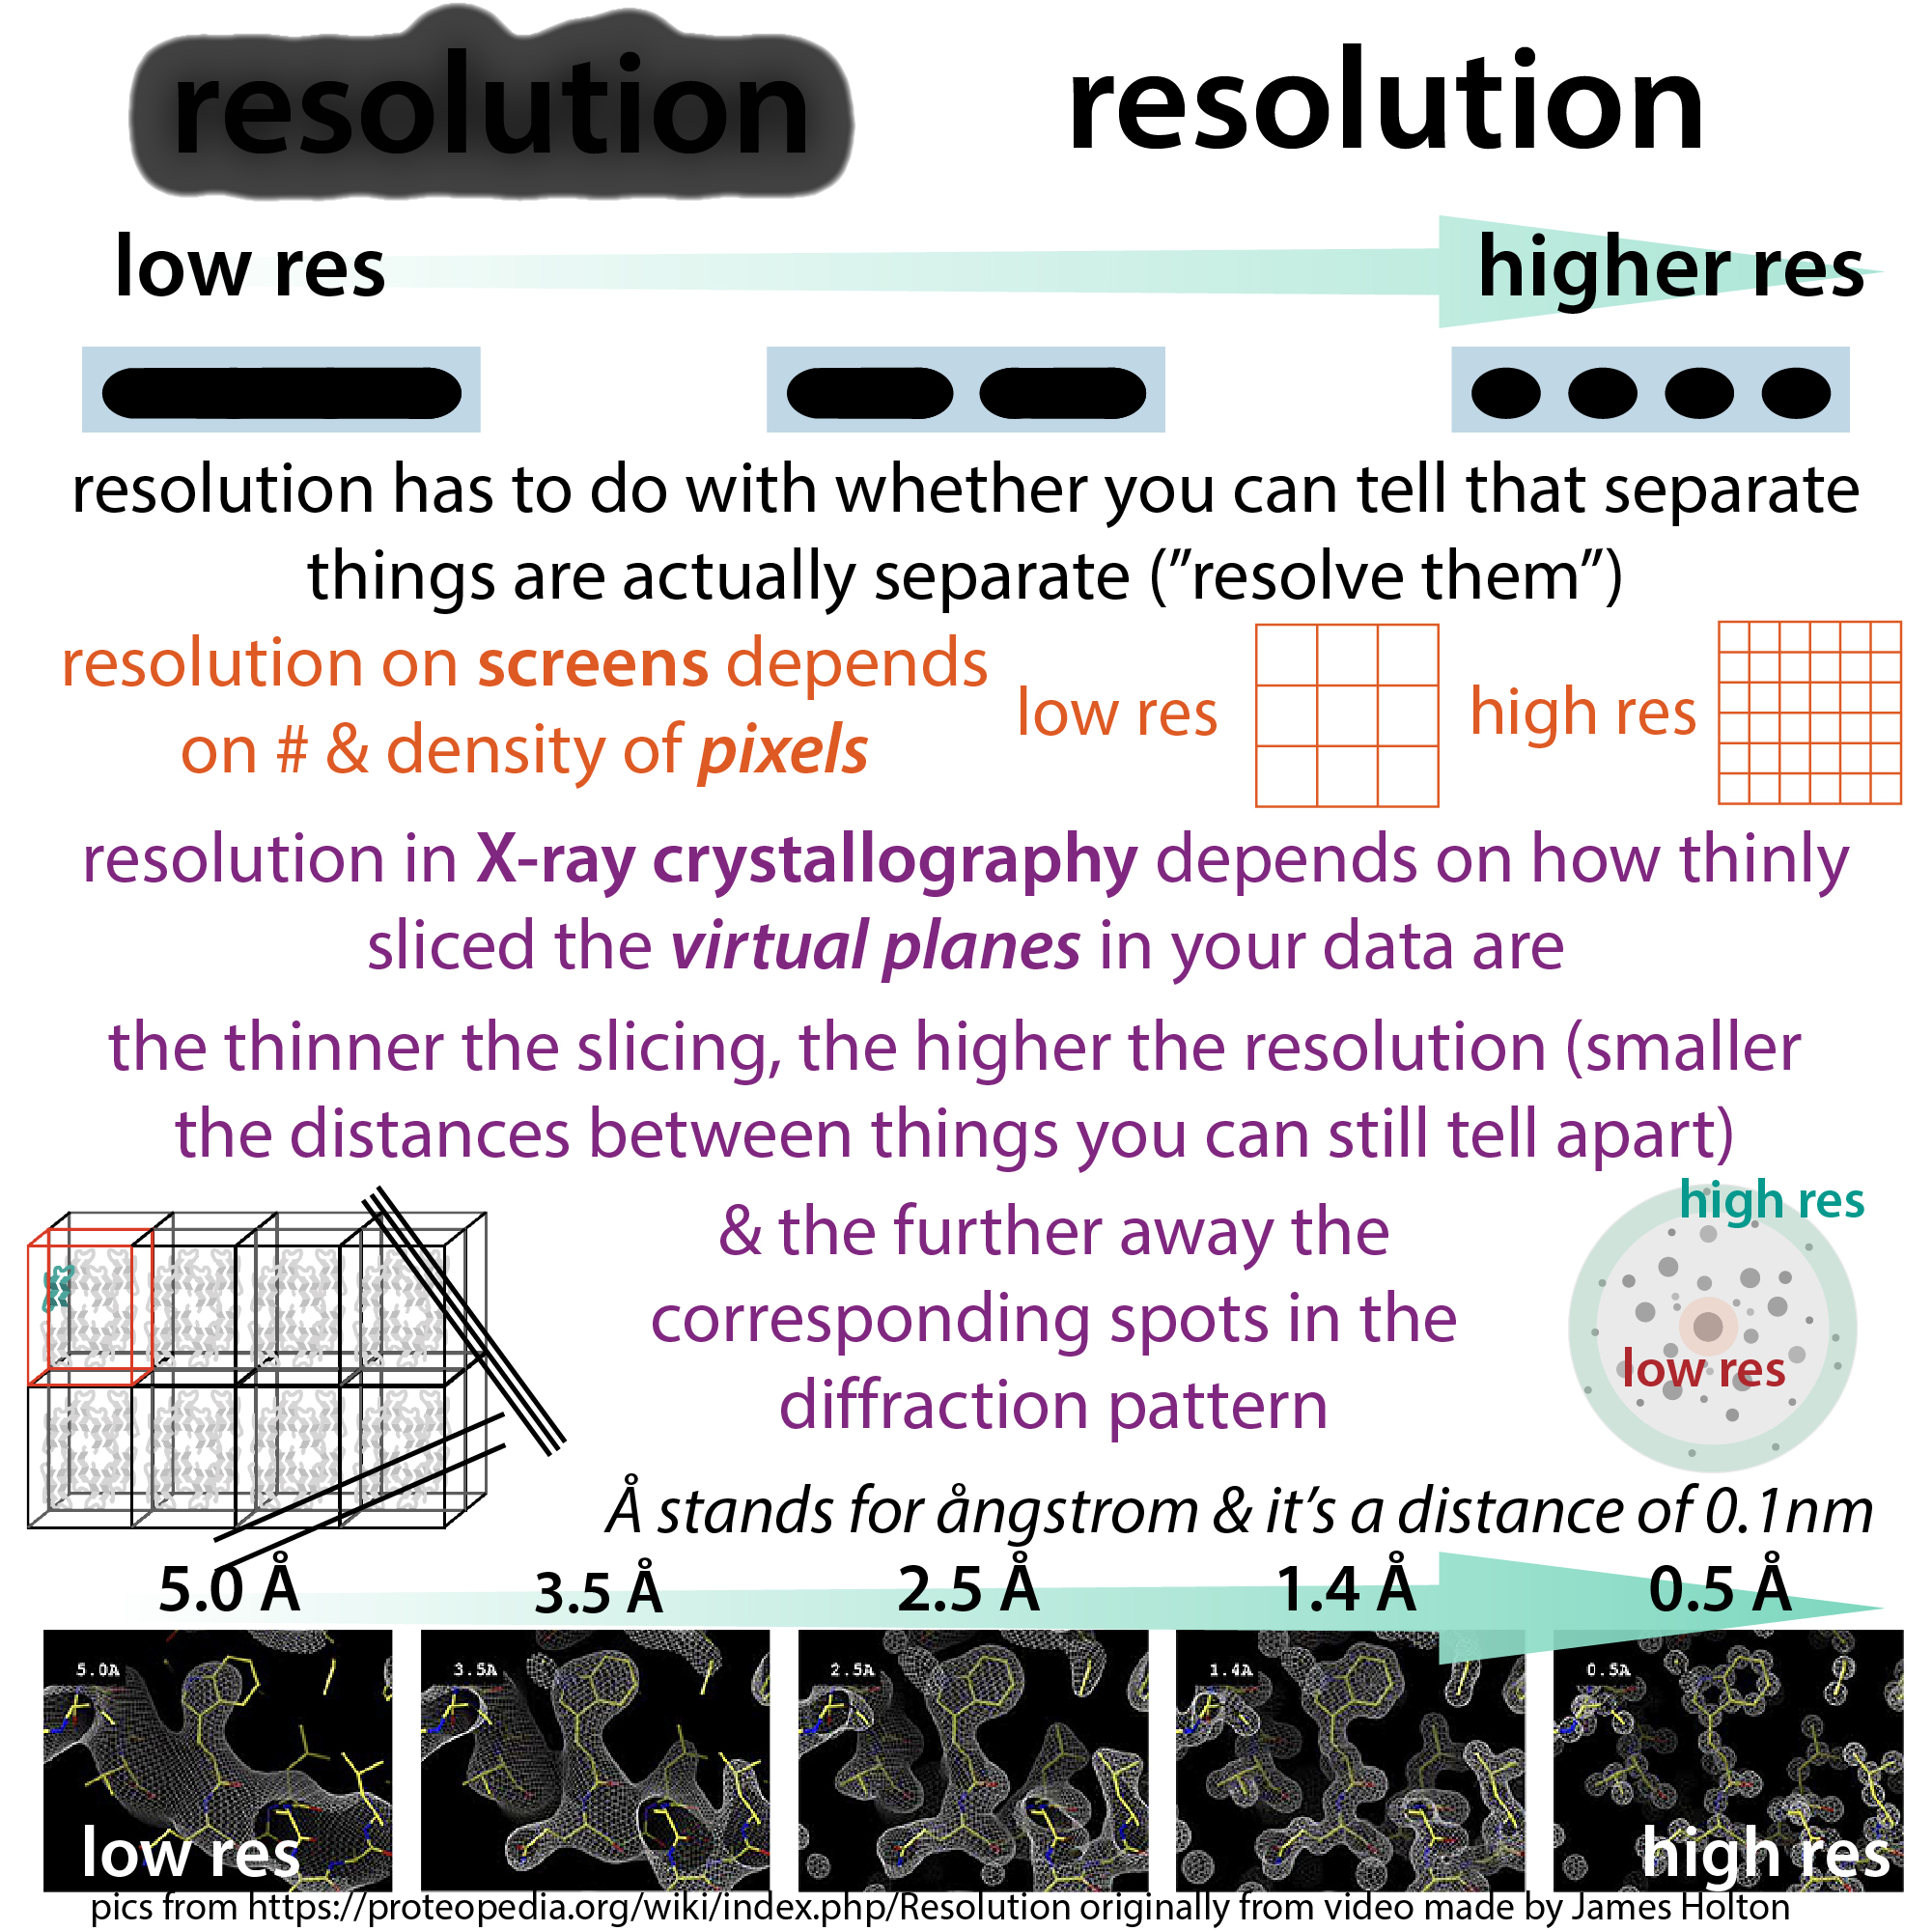
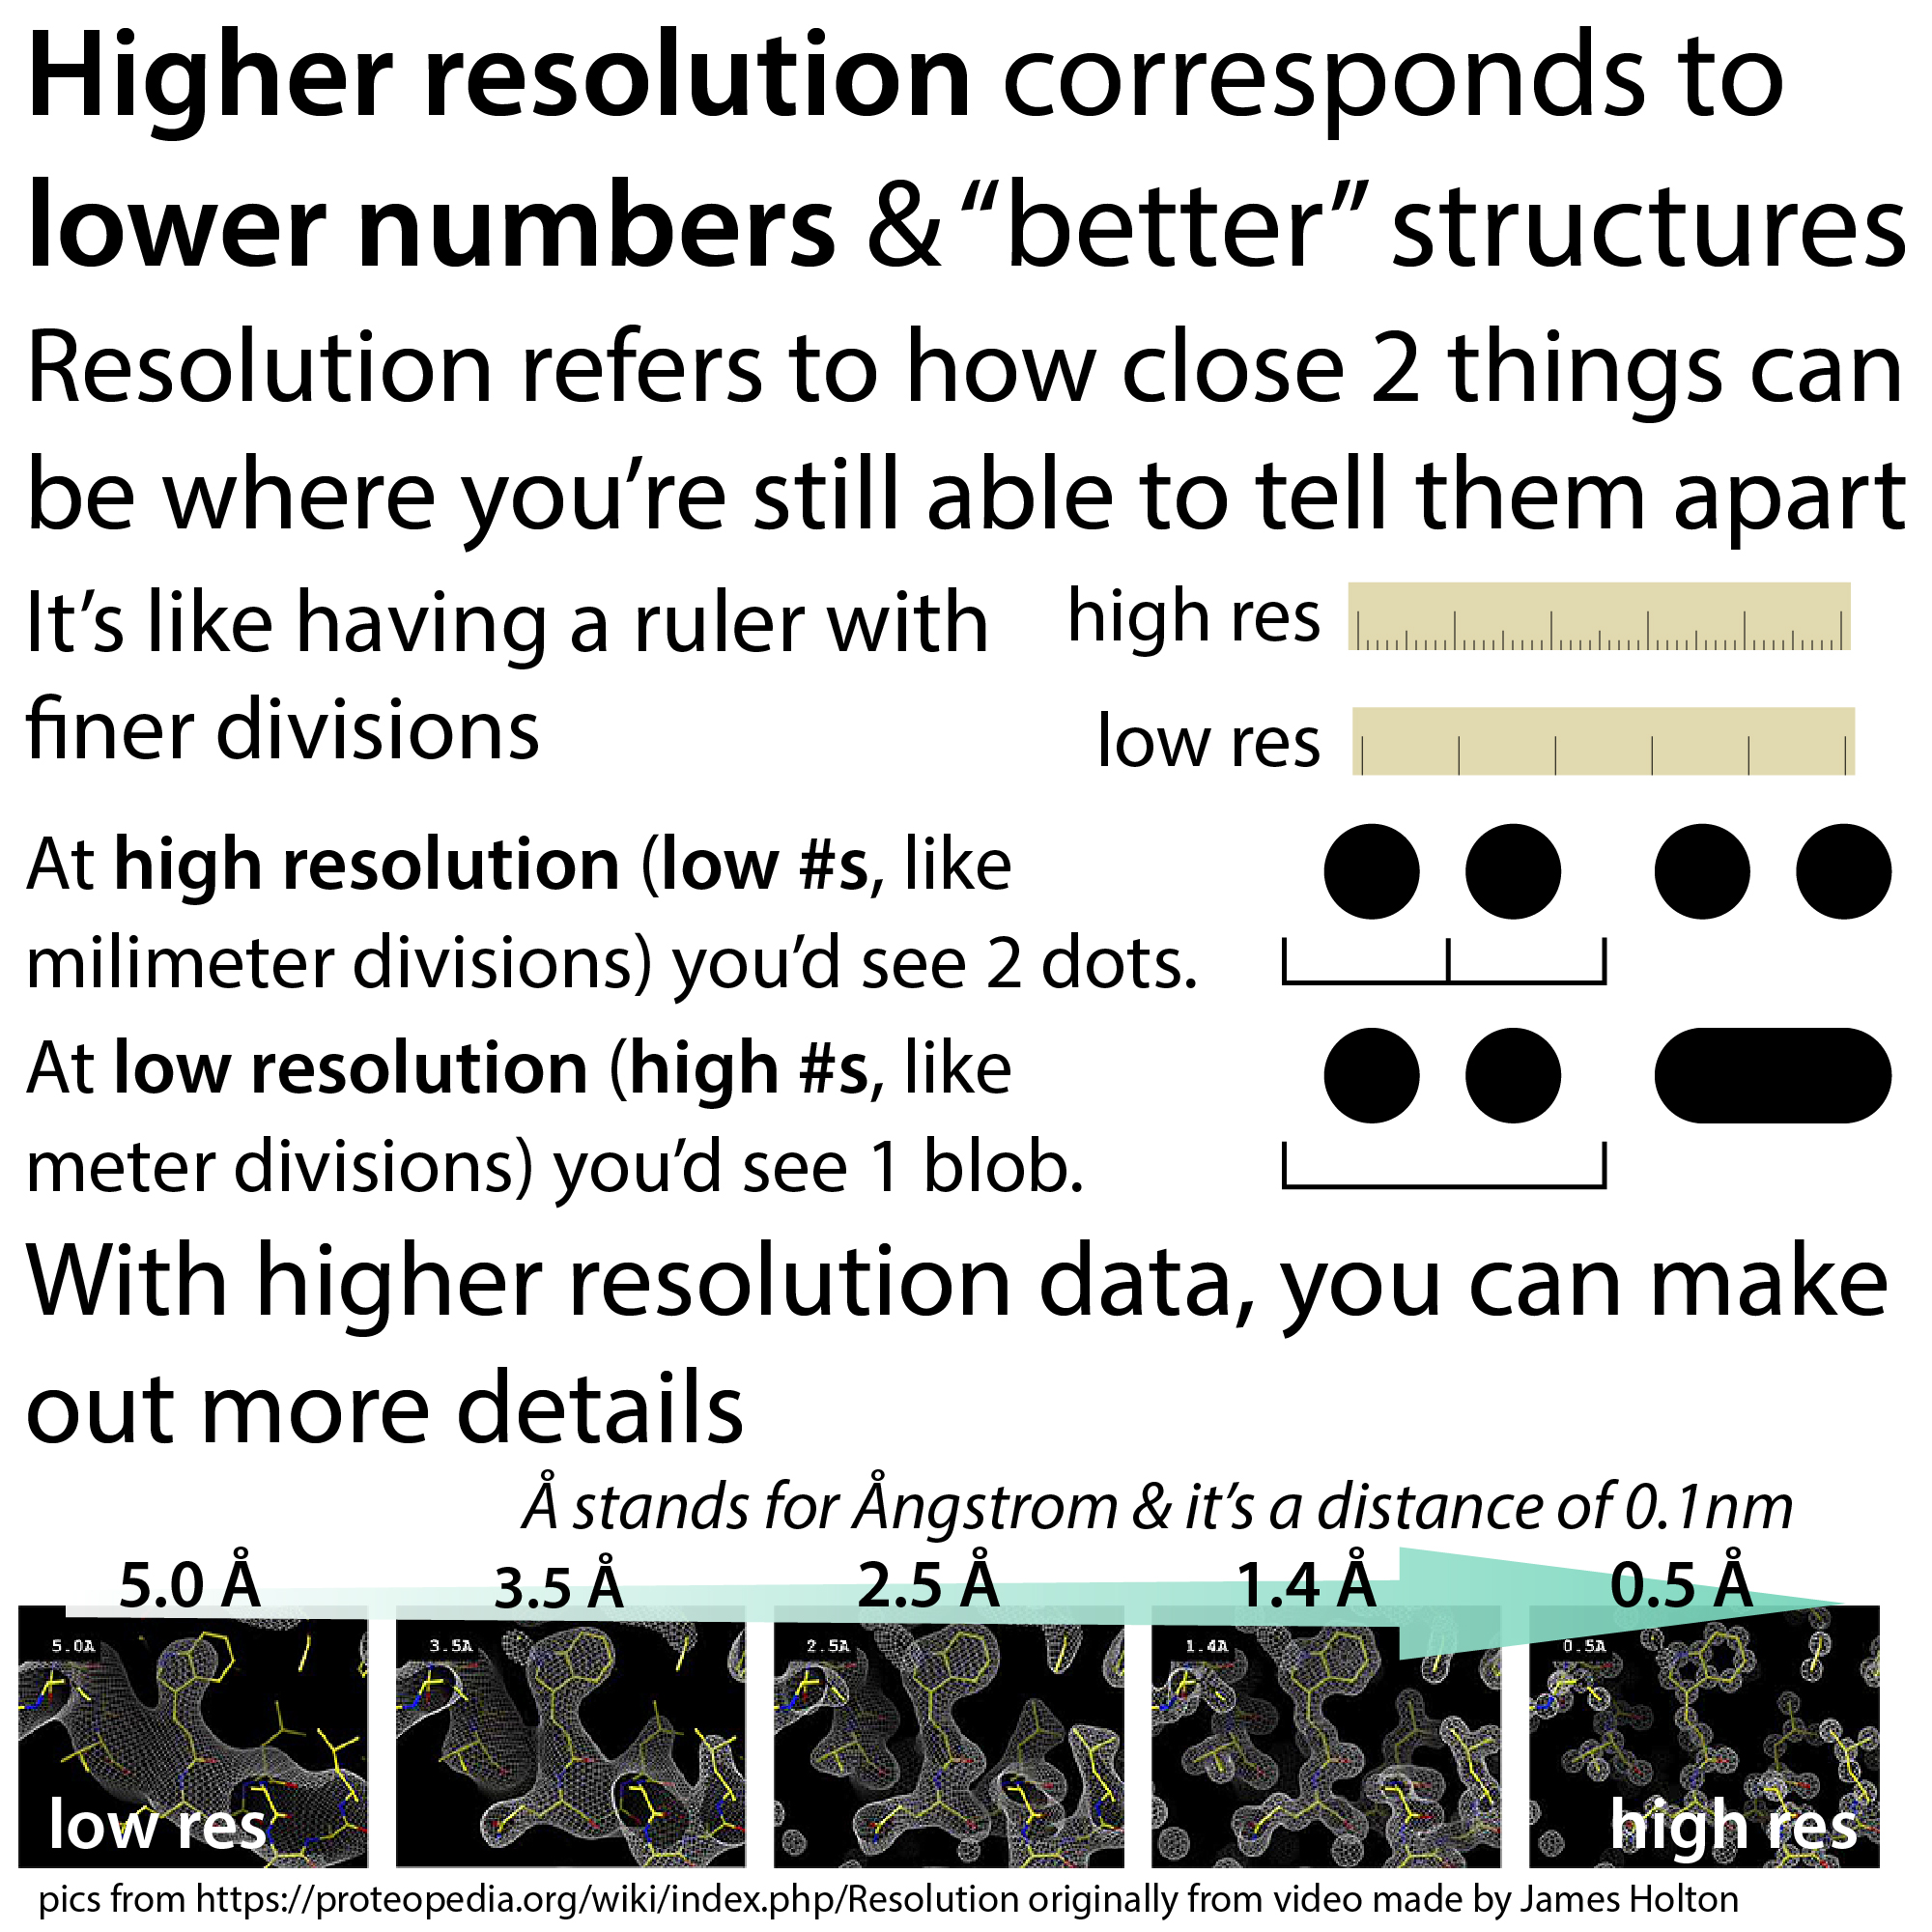
- Resolution: How crisp the data is, typically reported in angstroms (Å), which are 0.1 nm so less than a billionth of a meter.
- Higher resolution corresponds to lower numbers & “better” data.
- Resolution refers to how close 2 things can be where you’re still able to tell them apart (i.e, “resolve” them). The shorter the distance between the things you want to tell apart, the higher the resolution you will need (smaller resolution cut off number). The length of an average carbon-carbon single bond is ~1.54Å and the length of an average carbon-hydrogen bond is ~1.09Å. So if we want “atomic-level” resolution, we need to get to around 1.5.
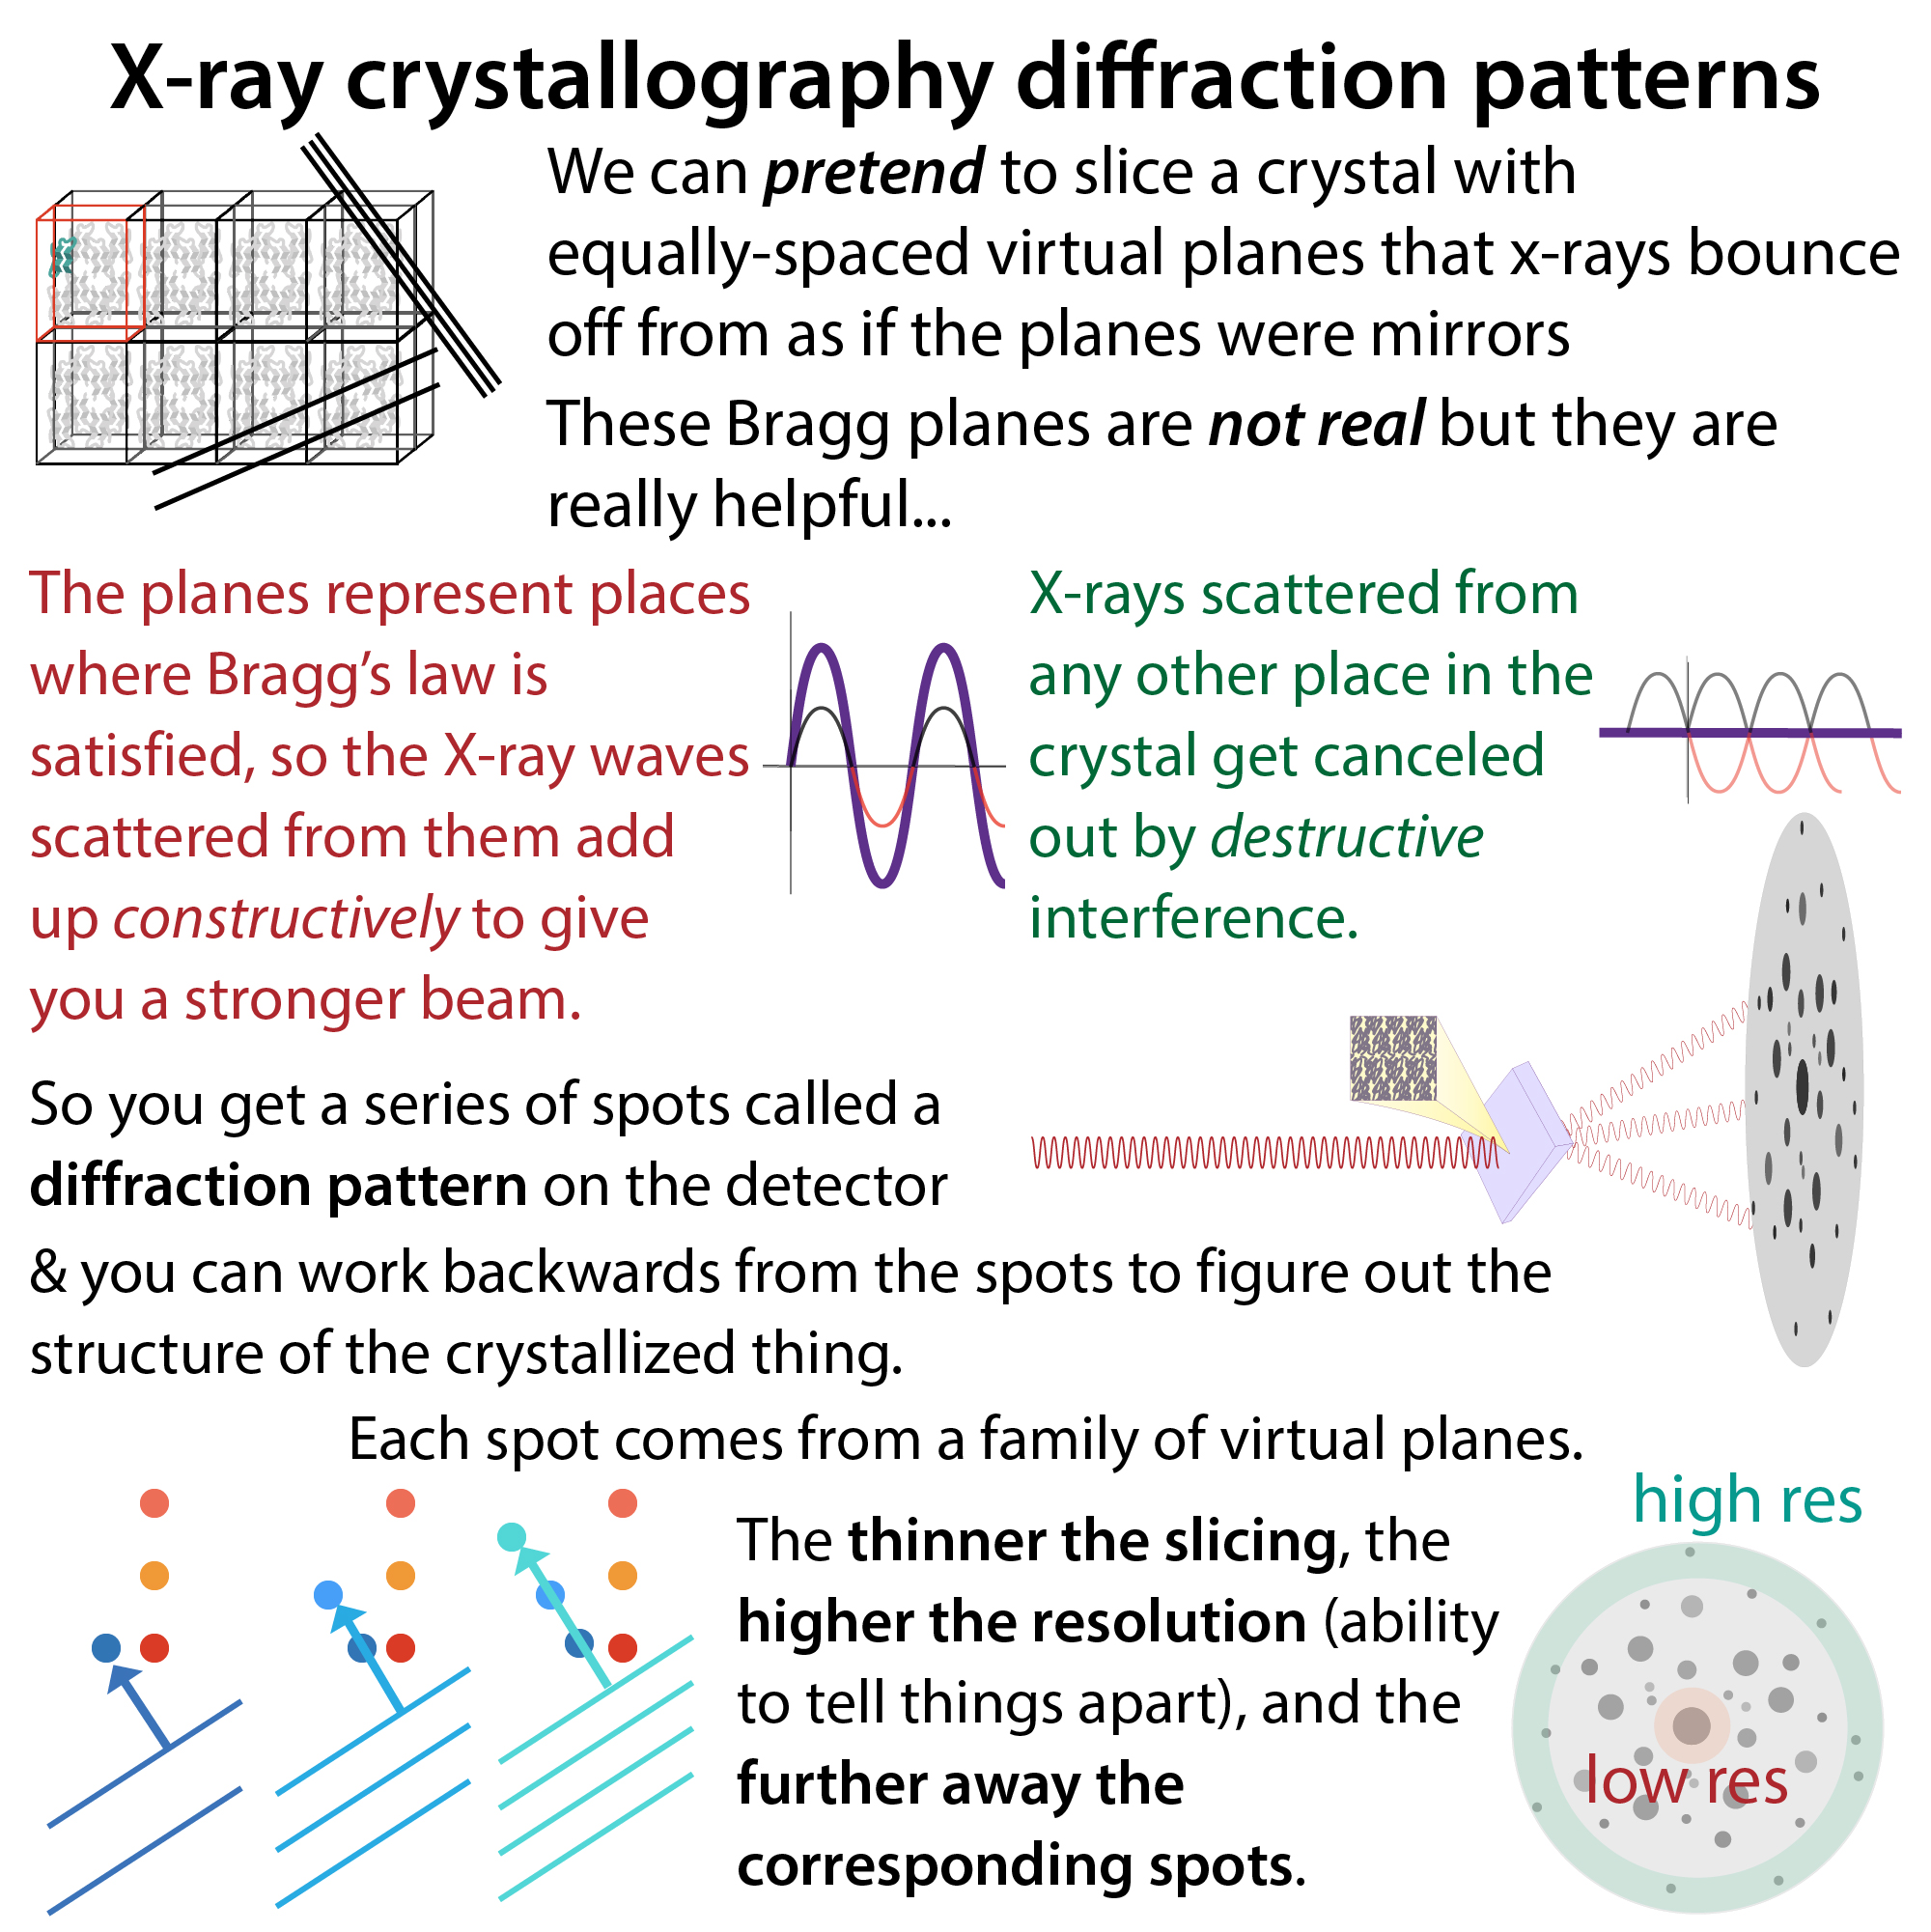
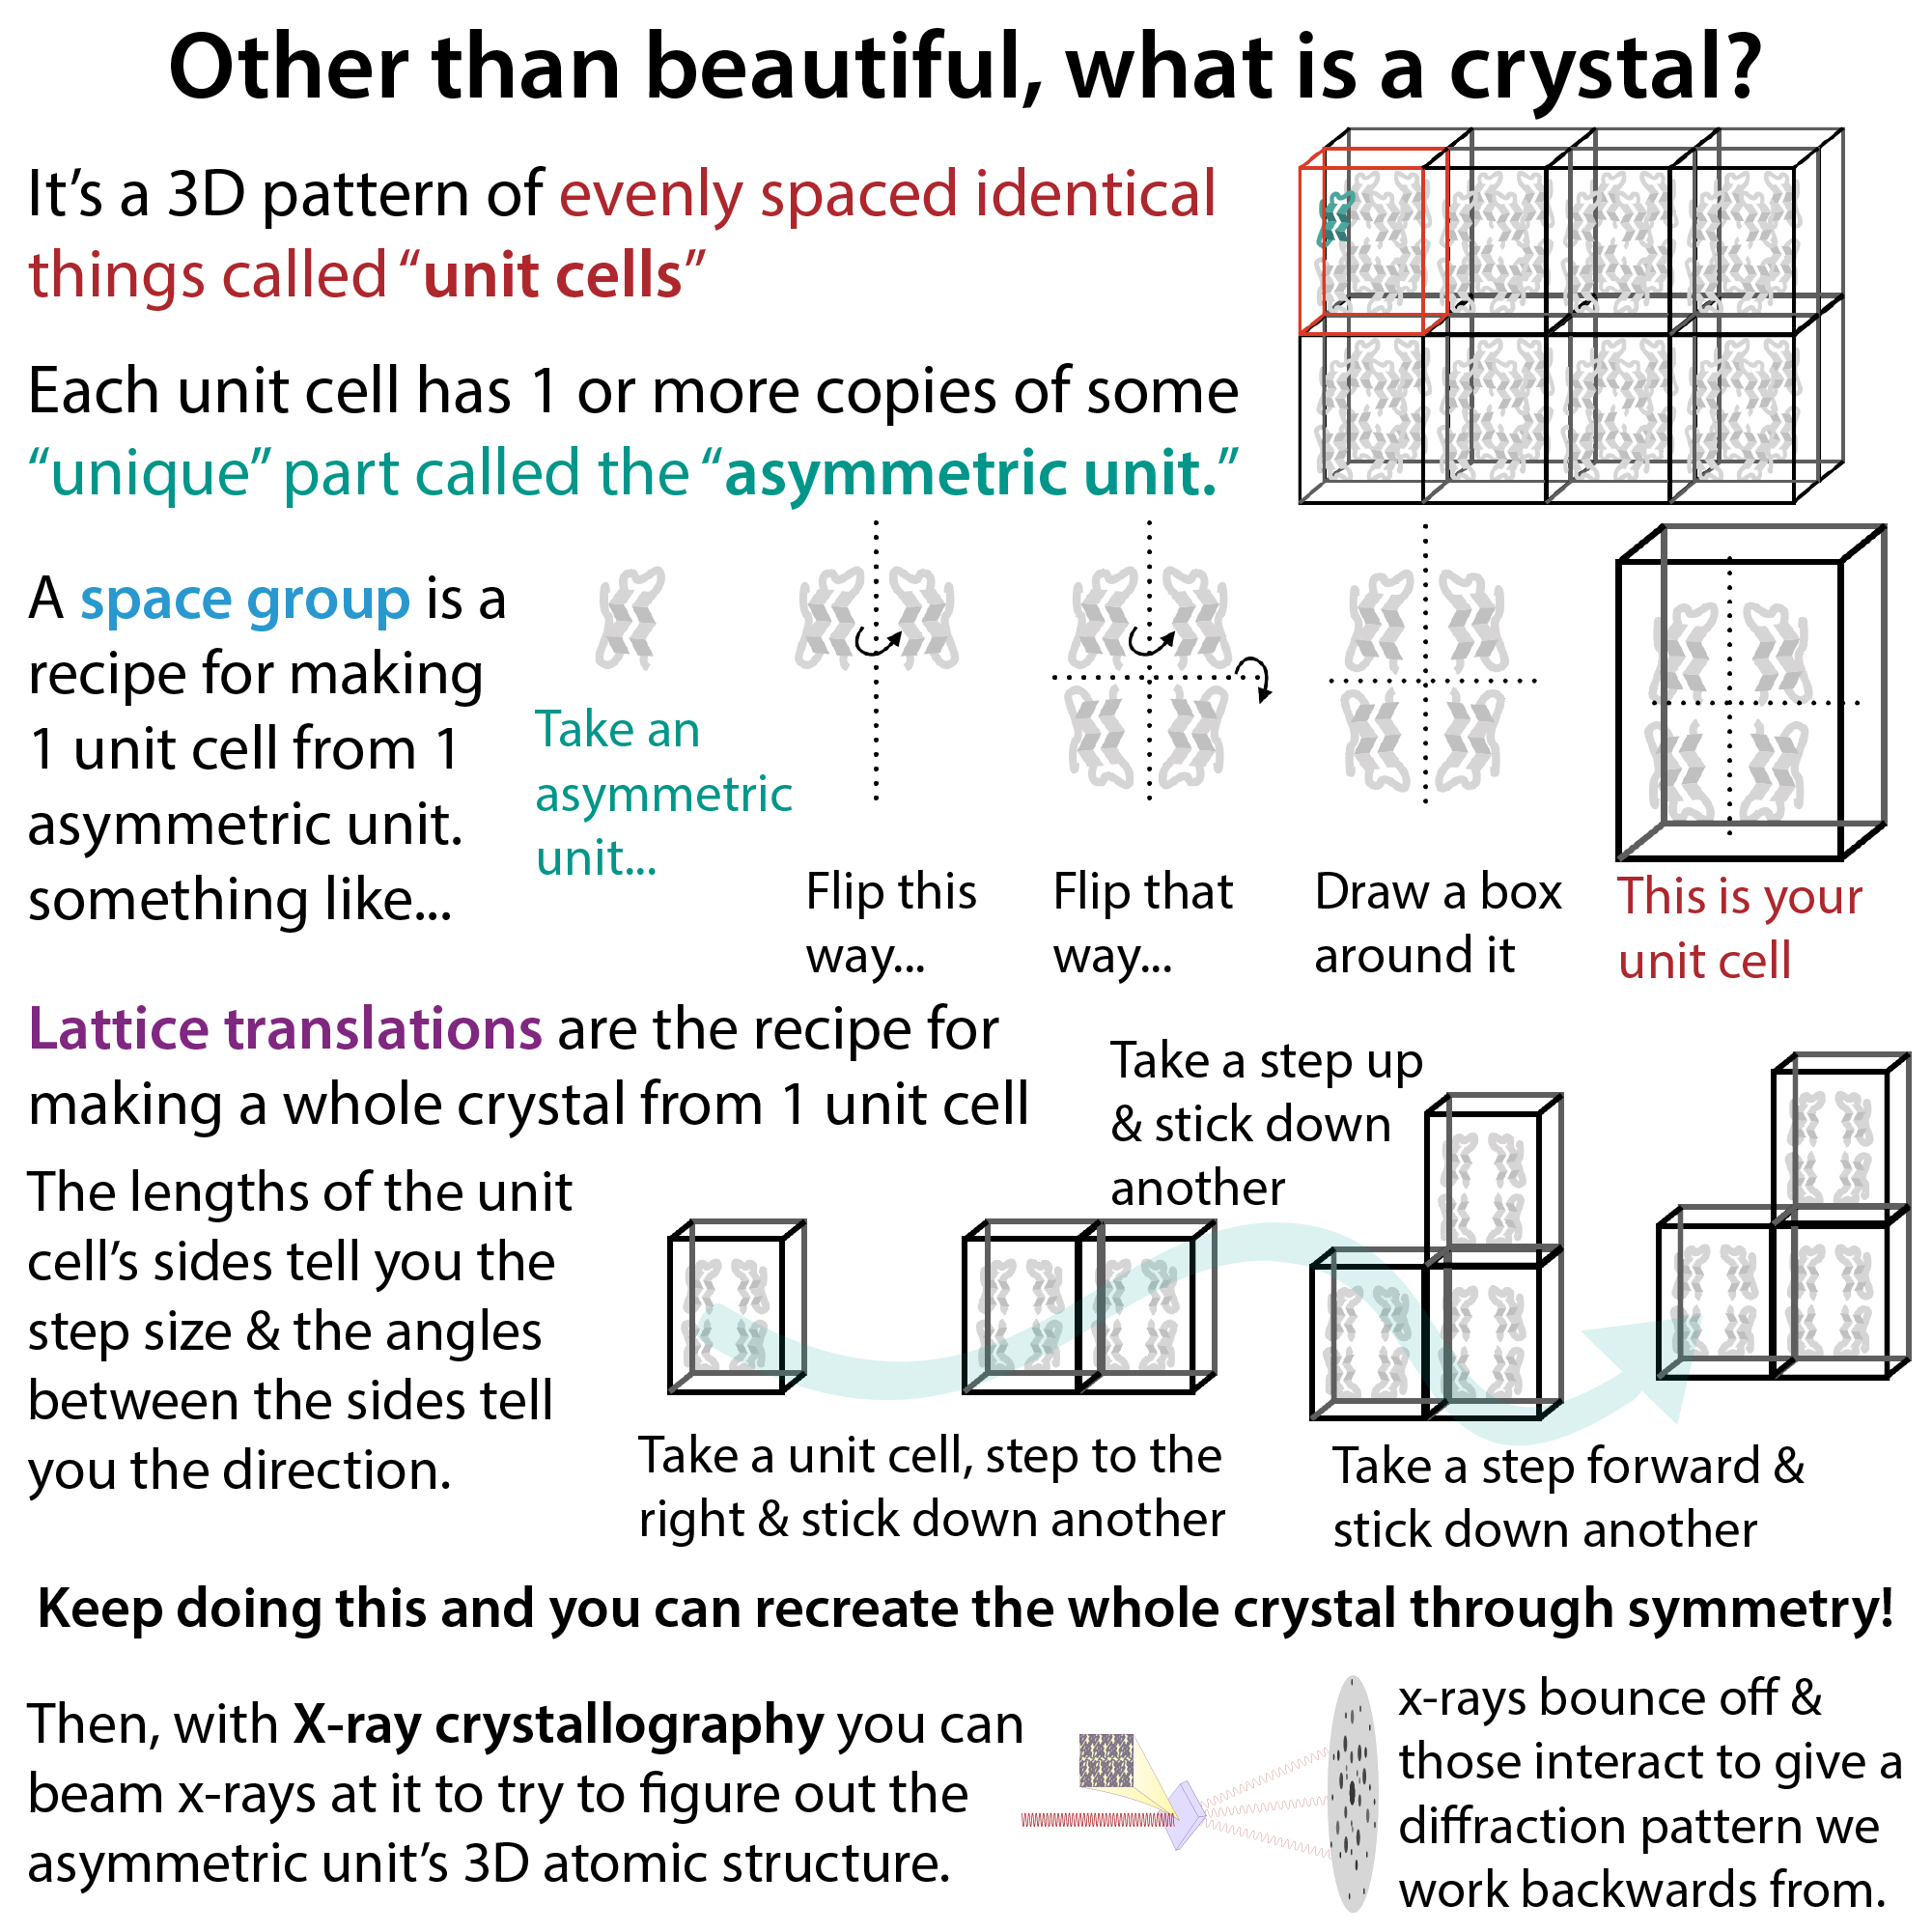
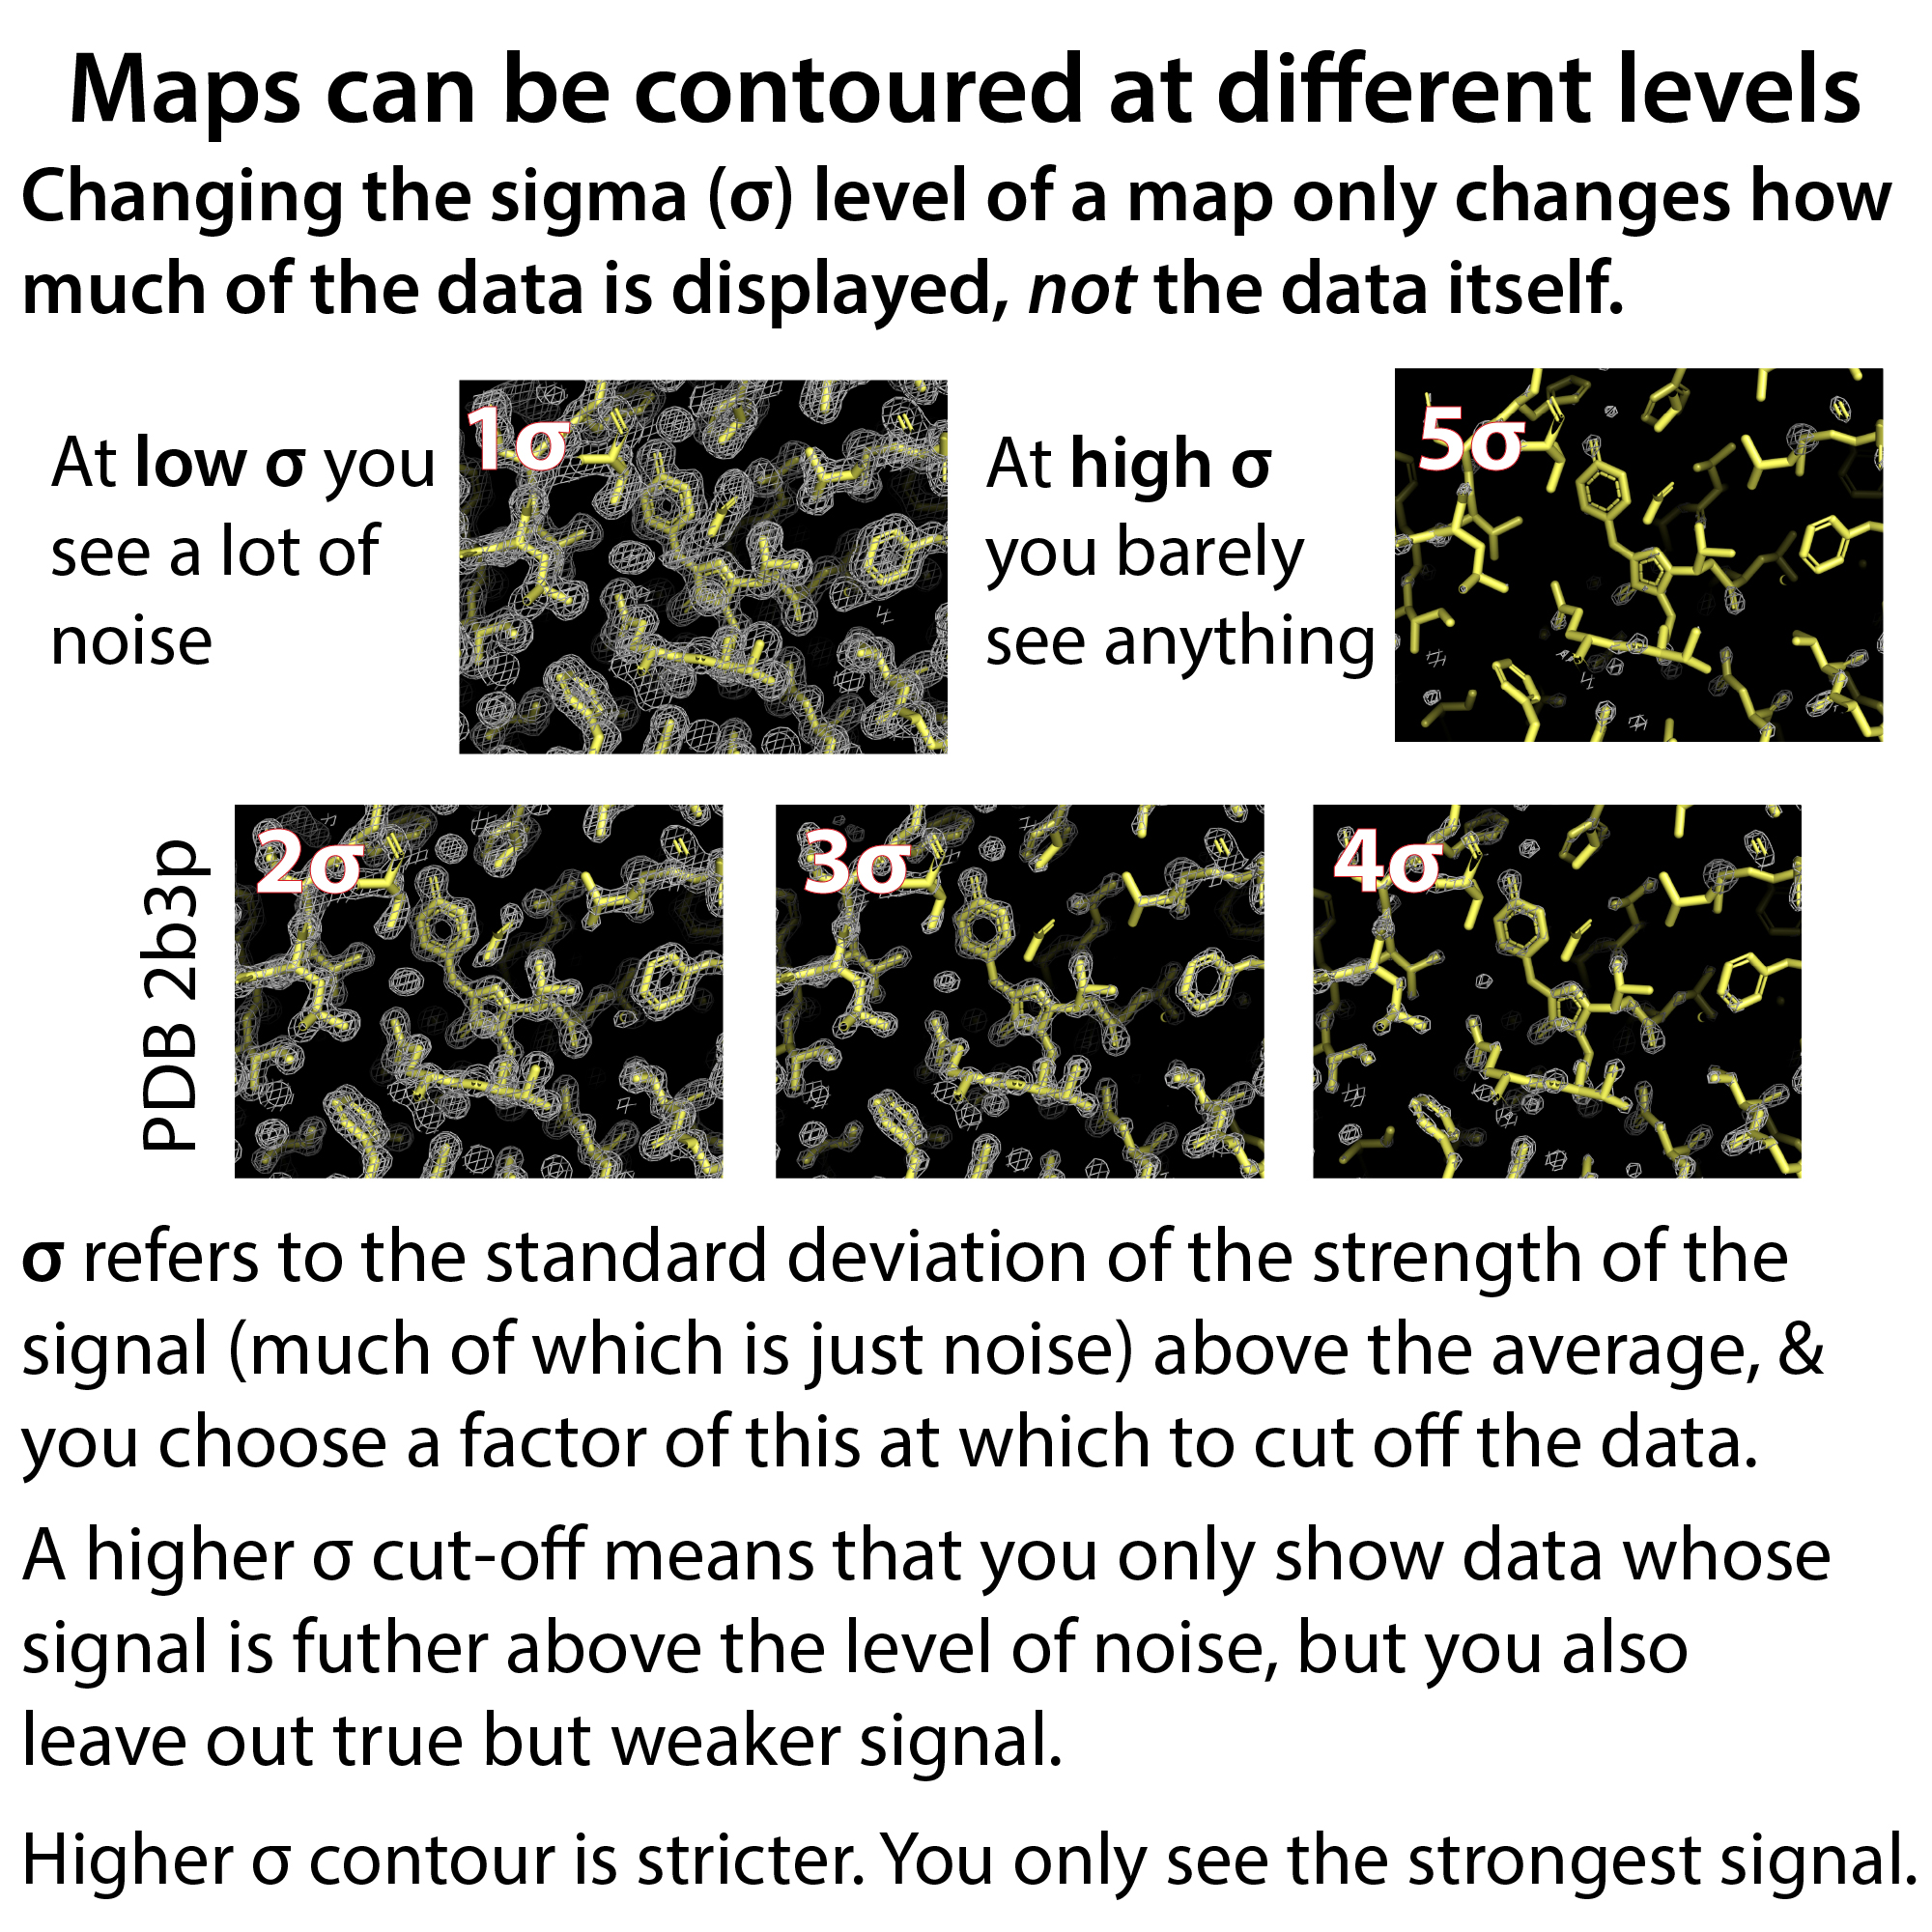
- Notes on resolution in crystallography: In crystallography, resolution is based on where you cut off which spots of the diffraction pattern data to include when building your maps and model. With crystallographic diffraction patterns, its’s like a reverse dart board; lower resolution data (higher numbers) is closer to the center of the diffraction pattern, and its spots are typically stronger than the higher resolution (lower numbers) data which is fainter and further from the bulls-eye. At some point, the noise (σ) starts to outweigh the true signal (I), so if we were to include more points we’d be adding noise instead of information. We have to decide where to make this cut-off & there are different statistical measures (including I/σ) we use to decide what “ring on the dart board” (resolution shell) to cut off at. The reported resolution corresponds to where we make this cut-off in terms of what data to use. Often data quality measurements are reported for all the used data combined as well as for “highest resolution shell” (just outer ring) so readers can get a sense of whether they “cut” appropriately & didn’t try to use higher resolution “data” that was really just noise.
More measurements specific to crystallography:
Diffraction data quality:
- Data completeness: What percent of the expected diffraction spots (expected based on symmetry and unit cell dimensions) are actually present and measured?
- Redundancy: How many times is each “identical” diffraction spot measured
- You want this to be high so that noise cancels out. But be careful collecting too much data because radiation damage will degrade the quality of your measurements.
- Rmerge, Rsym: How well do the different measurements of an “identical” diffraction spot agree with one another
- <I/σ(I)>: average signal/noise
Resources:
RCSB PDB Help section: Assessing the Quality of 3D Structures https://www.rcsb.org/docs/general-help/assessing-the-quality-of-3d-structures
wwPDB (worldwide PDB) Validation Reports: https://www.wwpdb.org/validation/fetch?page=XrayValidationReportHelp
I also recommend:
- Wlodawer, A.; Minor, W.; Dauter, Z.; Jaskolski, M. Protein Crystallography for Aspiring Crystallographers or How to Avoid Pitfalls and Traps in Macromolecular Structure Determination. The FEBS Journal 2013, 280 (22), 5705–5736. https://doi.org/10.1111/febs.12495.
- Wlodawer, A.; Minor, W.; Dauter, Z.; Jaskolski, M. Protein Crystallography for Non-Crystallographers, or How to Get the Best (but Not More) from Published Macromolecular Structures. FEBS Journal 2008, 275 (1), 1–21. https://doi.org/10.1111/j.1742-4658.2007.06178.x.
more on PDB entries: https://bit.ly/pdbstructures
Structural biology resources guide: https://bit.ly/structural_biology
My structural biology YouTube playlist: https://youtube.com/playlist?list=PLUWsCDtjESrGhwVxsRbTJdL-BEsN60RCs
My x-ray crystallography YouTube playlist: https://www.youtube.com/playlist?list=PLUWsCDtjESrHIGzgUctYRWSWm-lw9_VhX
more on crystallography here: http://bit.ly/xraycrystallography2